Global Specialty Generics Market Size, Share & Analysis By Application/Therapy Area (Oncology, Immunology), By Distribution Channel (Specialty Pharmacy, Retail Pharmacy, Hospital Pharmacy, Other Distribution Channels), By Dosage Form, Industry Outlook, Patent Expiry Trends & Forecast 2025–2034
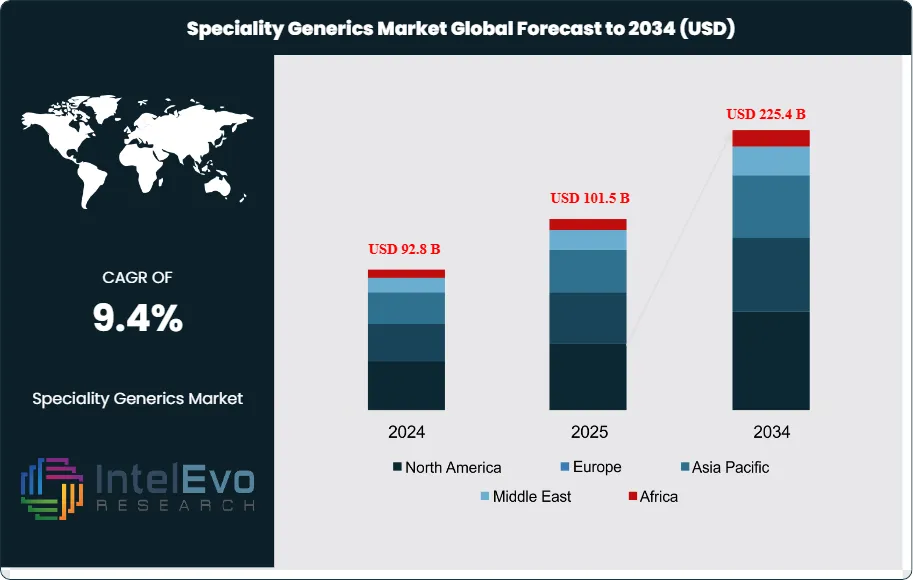
The Specialty Generics market is valued at USD 92.8 billion in 2024 and is projected to reach approximately USD 225.4 billion by 2034, reflecting a robust CAGR of about 9.4% during 2025–2034. Growth is accelerating as healthcare systems worldwide push for cost-effective therapies in oncology, autoimmune disorders, and complex chronic diseases. Increasing patent expiries and rising demand for high-quality, affordable specialty formulations are reshaping competitive dynamics. With biologics-adjacent generics, advanced delivery systems, and regulatory fast-track pathways gaining traction, specialty generics are emerging as a key engine of pharmaceutical affordability and global market expansion.
Over the past decade, specialty generics have transitioned from a niche segment to a central pillar in the broader generics industry. Demand has grown steadily as healthcare systems face mounting pressure to reduce costs while maintaining access to complex treatments. Specialty generics, which include off-patent versions of high-cost branded drugs used to treat chronic and life-threatening conditions, are increasingly seen as viable alternatives. This shift is especially pronounced in oncology, autoimmune diseases, and hepatitis C—areas where treatment costs are high and patient populations are expanding.
One of the most critical demand-side drivers is the aging global population. Individuals aged 65 and older now account for over 10% of the world population, with projections suggesting continued growth through 2032. This demographic is disproportionately affected by chronic conditions such as cancer, arthritis, and cardiovascular diseases, increasing the reliance on specialty medicines. On the supply side, several pharmaceutical companies are deepening their specialty generics portfolios through strategic acquisitions and licensing deals. However, brand loyalty, complex manufacturing requirements, and low-margin structures remain formidable barriers for new entrants.
Despite these challenges, the outlook remains strong. Regulatory pathways for generic approvals have become more streamlined in key markets such as the U.S. and Europe, encouraging faster market entry and broader adoption. Meanwhile, advances in formulation technologies and biosimilar development are expanding the scope of what qualifies as a specialty generic, further widening the addressable market.
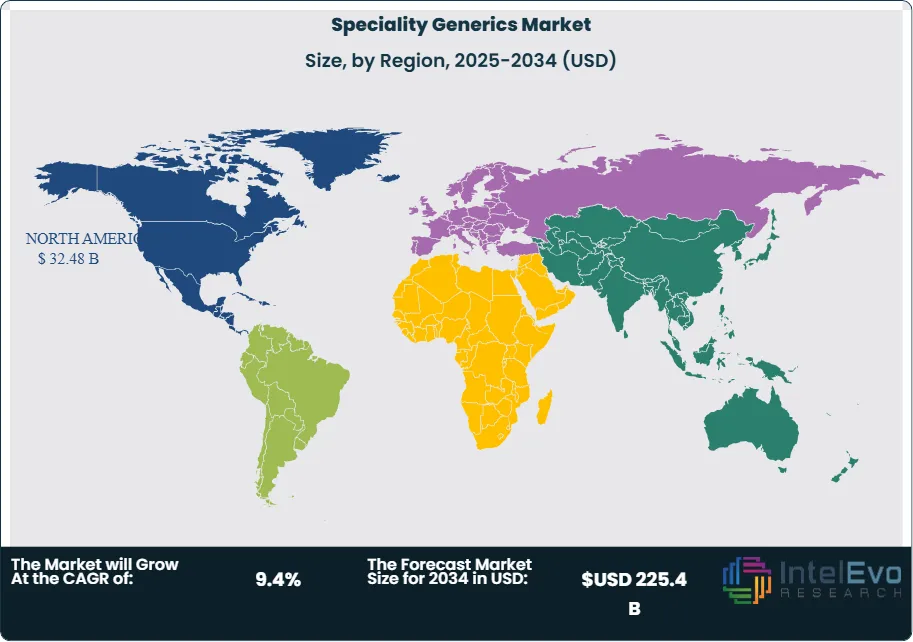
North America currently holds the dominant market share, driven by favorable reimbursement structures, a high burden of chronic disease, and strong distribution networks. However, Asia-Pacific is emerging as a key growth region. Countries like India and China are seeing increased domestic demand and rising manufacturing capabilities, attracting investor interest.
As cost-containment pressures intensify globally, specialty generics will continue to gain strategic importance for payers, providers, and manufacturers. The ability to scale production while navigating regulatory and pricing complexities will define the next wave of market leaders.
Key Takeaways
Market Growth: The global Specialty Generics market is projected to reach USD 225.4 billion by 2034, up at USD 92.8 billion in 2024, growing at a CAGR of 9.4% from 2023 to 2032. Growth is driven by rising chronic disease prevalence and increased demand for cost-effective alternatives to branded specialty drugs.
Route of Administration: Injectables account for the largest revenue share in the market, supported by their high bioavailability and widespread use in oncology, autoimmune diseases, and chronic infections.
Application: Inflammatory diseases represent a major revenue-contributing segment, with rising incidence rates of conditions such as rheumatoid arthritis and Crohn’s disease pushing demand for targeted specialty generics.
Driver: The global rise in chronic conditions like cancer, hepatitis C, and cardiovascular disorders is a key demand-side driver. Over 60% of adults in the U.S. live with at least one chronic illness, accelerating adoption of specialty generics in long-term treatment plans.
Restraint: High entry barriers, including complex manufacturing, stringent regulatory pathways, and low pricing margins, limit participation by smaller companies and slow new product launches.
Opportunity: Asia-Pacific is emerging as a high-growth region, expected to grow at a CAGR above 10% through 2032. Increasing healthcare expenditure, expanding generics production capabilities, and unmet treatment needs make it an attractive destination for investment.
Trend: Leading manufacturers are focusing on advanced drug delivery technologies and biosimilar development to expand their specialty generics portfolios. Companies like Teva and Sandoz are actively acquiring assets to accelerate market access and broaden therapeutic offerings.
Regional Analysis: North America remains the largest regional market, accounting for over 35% of global revenue in 2022, driven by favorable reimbursement policies and high chronic disease burden. Meanwhile, Latin America and Asia-Pacific are gaining traction due to improving healthcare infrastructure and rising generic drug acceptance.
Type Analysis
Injectables continue to lead the specialty generics market by revenue, accounting for the largest share in 2025. Their clinical advantages—rapid onset of action and improved bioavailability—make them a preferred option for treating complex conditions such as cancer and autoimmune diseases. These attributes contribute to stronger patient adherence, particularly in hospital settings and long-term care.
Looking ahead, the injectables segment is expected to register the highest CAGR through 2032, driven by a surge in regulatory approvals and broader adoption across oncology, neurology, and chronic disease treatments. Increased market penetration in both developed and emerging regions is expanding patient access to affordable alternatives. Major players are accelerating filings for injectable generics as patents on high-cost biologics and specialty drugs expire, further fueling growth.
Application Analysis
Inflammatory conditions represent the most lucrative application segment in the specialty generics landscape. Rising incidence of disorders such as rheumatoid arthritis, ulcerative colitis, and psoriasis has sustained strong demand for biologic and biosimilar treatments. Specialty generics provide cost-effective alternatives to high-priced branded therapies, encouraging healthcare providers and payers to support their uptake.
While inflammatory diseases dominate revenue, oncology is projected to be the fastest-growing application through 2032. Lifestyle risk factors—tobacco use, poor diet, alcohol consumption—and aging demographics have contributed to rising cancer diagnoses globally. As a result, demand for affordable chemotherapy agents and supportive therapies is accelerating. Specialty generics offer a viable pathway to expand cancer treatment access while alleviating pressure on healthcare budgets.
Distribution Channel Analysis
Specialty pharmacies maintain the largest market share in the distribution of specialty generics in 2025. Their infrastructure allows for streamlined handling of complex therapies that often require patient education, temperature control, and strict inventory management. Manufacturers and payers increasingly favor specialty pharmacies due to their cost-efficiency, regulatory compliance, and ability to ensure medication adherence.
The segment is also experiencing consistent growth, supported by partnerships with insurers and pharmacy benefit managers. Lower distribution costs compared to traditional retail outlets, combined with the increasing availability of specialty generics for high-cost therapies, enhance ROI for stakeholders. Specialty pharmacies’ ability to facilitate rapid delivery and provide tailored patient services continues to strengthen their market position.
Regional Analysis
North America remains the dominant regional market for specialty generics, contributing over 35% of global revenue in 2025. Favorable regulatory frameworks, high incidence of chronic diseases, and advanced healthcare infrastructure support broad adoption. The U.S. Food and Drug Administration (FDA) continues to accelerate generic approvals under programs like the Generic Drug User Fee Amendments (GDUFA), encouraging manufacturers to expand product pipelines.
Asia Pacific is the fastest-growing region, projected to expand at a double-digit CAGR through 2032. Rising healthcare spending, an expanding middle class, and ongoing regulatory reforms are key growth drivers. India and China, in particular, are investing in domestic generic production to meet high demand for cost-effective treatments. This shift is creating attractive opportunities for both local and international players to establish or scale operations in the region.
By Type (Injectables, Oral Drugs), By Application (Oncology, Inflammatory Conditions, Hepatitis C, Multiple Sclerosis, Other Applications), By Distribution Channel (Specialty Pharmacy, Retail Pharmacy, Hospital Pharmacy, Other Distribution Channels)
Research Methodology
Primary Research- 100 Interviews of Stakeholders
Secondary Research
Desk Research
Regional scope
North America (United States, Canada, Mexico)
Latin America (Brazil, Argentina, Columbia)
East Asia And Pacific (China, Japan, South Korea, Australia, Cambodia, Fiji, Indonesia)
Sea And South Asia (India, Singapore, Thailand, Taiwan, Malaysia)
Eastern Europe (Poland, Russia, Czech Republic, Romania)
Western Europe (Germany, U.K., France, Spain, Itlay)
Middle East & Africa (GCC Countries, Egypt, Nigeria, South Africa, Israel)
Competitive Landscape
Teva Pharmaceutical Industries Ltd., Viatris Inc., Novartis AG (Sandoz Group AG), Hikma Pharmaceuticals PLC, Mallinckrodt Pharmaceuticals, Bausch Health Companies Inc., Dr. Reddy’s Laboratories Ltd., Sun Pharmaceutical Industries Ltd., Amneal Pharmaceuticals LLC, Apotex Corp., Endo Pharmaceuticals Inc., Fresenius Kabi Brasil Ltda, STADA Arzneimittel AG, Pfizer, Inc.
Customization Scope
Customization for segments, region/country-level will be provided. Moreover, additional customization can be done based on the requirements.
Pricing and Purchase Options
Avail customized purchase options to meet your exact research needs. We have three licenses to opt for: Single User License, Multi-User License (Up to 5 Users), Corporate Use License (Unlimited User and Printable PDF).
TABLE OF CONTENTS
1. EXECUTIVE SUMMARY
1.1. MARKET SNAPSHOT
1.2. KEY FINDINGS & INSIGHTS
1.3. ANALYST RECOMMENDATIONS
1.4. FUTURE OUTLOOK
2. RESEARCH METHODOLOGY
2.1. MARKET DEFINITION & SCOPE
2.2. RESEARCH OBJECTIVES: PRIMARY & SECONDARY DATA SOURCES
2.3. DATA COLLECTION SOURCES
2.3.1. COVERAGE OF 100+ PRIMARY RESEARCH/CONSULTATION CALLS WITH INDUSTRY STAKEHOLDERS
FIGURE 17 NORTH AMERICA DEMOCRATIZATION OF AI CURRENT AND FUTURE TYPE ANALYSIS, 2025–2034, (USD MILLION)
FIGURE 18 NORTH AMERICA DEMOCRATIZATION OF AI CURRENT AND FUTURE END USER ANALYSIS, 2025–2034, (USD MILLION)
FIGURE 19 MARKET SHARE BY COUNTRY
FIGURE 20 LATIN AMERICA DEMOCRATIZATION OF AI CURRENT AND FUTURE TYPE ANALYSIS, 2025–2034, (USD MILLION)
FIGURE 21 LATIN AMERICA DEMOCRATIZATION OF AI CURRENT AND FUTURE END USER ANALYSIS, 2025–2034, (USD MILLION)
FIGURE 22 MARKET SHARE BY COUNTRY
FIGURE 23 EASTERN EUROPE DEMOCRATIZATION OF AI CURRENT AND FUTURE TYPE ANALYSIS, 2025–2034, (USD MILLION)
FIGURE 24 EASTERN EUROPE DEMOCRATIZATION OF AI CURRENT AND FUTURE END USER ANALYSIS, 2025–2034, (USD MILLION)
FIGURE 25 MARKET SHARE BY COUNTRY
FIGURE 26 WESTERN EUROPE DEMOCRATIZATION OF AI CURRENT AND FUTURE TYPE ANALYSIS, 2025–2034, (USD MILLION)
FIGURE 27 WESTERN EUROPE DEMOCRATIZATION OF AI CURRENT AND FUTURE END USER ANALYSIS, 2025–2034, (USD MILLION)
FIGURE 28 MARKET SHARE BY COUNTRY
FIGURE 29 EAST ASIA AND PACIFIC DEMOCRATIZATION OF AI CURRENT AND FUTURE TYPE ANALYSIS, 2025–2034, (USD MILLION)
FIGURE 30 EAST ASIA AND PACIFIC DEMOCRATIZATION OF AI CURRENT AND FUTURE END USER ANALYSIS, 2025–2034, (USD MILLION)
FIGURE 31 MARKET SHARE BY COUNTRY
FIGURE 32 SEA AND SOUTH ASIA DEMOCRATIZATION OF AI CURRENT AND FUTURE TYPE ANALYSIS, 2025–2034, (USD MILLION)
FIGURE 33 SEA AND SOUTH ASIA DEMOCRATIZATION OF AI CURRENT AND FUTURE END USER ANALYSIS, 2025–2034, (USD MILLION)
FIGURE 34 MARKET SHARE BY COUNTRY
FIGURE 35 MIDDLE EAST AND AFRICA DEMOCRATIZATION OF AI CURRENT AND FUTURE TYPE ANALYSIS, 2025–2034, (USD MILLION)
FIGURE 36 MIDDLE EAST AND AFRICA DEMOCRATIZATION OF AI CURRENT AND FUTURE END USER ANALYSIS, 2025–2034, (USD MILLION)
FIGURE 37 NORTH AMERICA DEMOCRATIZATION OF AI CURRENT AND FUTURE MARKET VOLUME SHARE REGIONAL ANALYSIS, 2025–2034, (USD MILLION)
FIGURE 38 U.S. DEMOCRATIZATION OF AI CURRENT AND FUTURE TYPE ANALYSIS, 2025–2034, (USD MILLION)
FIGURE 39 U.S. DEMOCRATIZATION OF AI CURRENT AND FUTURE END USER ANALYSIS, 2025–2034, (USD MILLION)
FIGURE 40 CANADA DEMOCRATIZATION OF AI CURRENT AND FUTURE TYPE ANALYSIS, 2025–2034, (USD MILLION)
FIGURE 41 CANADA DEMOCRATIZATION OF AI CURRENT AND FUTURE END USER ANALYSIS, 2025–2034, (USD MILLION)
FIGURE 42 LATIN AMERICA DEMOCRATIZATION OF AI CURRENT AND FUTURE MARKET VOLUME SHARE REGIONAL ANALYSIS, 2025–2034, (USD MILLION)
FIGURE 43 MEXICO DEMOCRATIZATION OF AI CURRENT AND FUTURE TYPE ANALYSIS, 2025–2034, (USD MILLION)
FIGURE 44 MEXICO DEMOCRATIZATION OF AI CURRENT AND FUTURE END USER ANALYSIS, 2025–2034, (USD MILLION)
FIGURE 45 BRAZIL DEMOCRATIZATION OF AI CURRENT AND FUTURE TYPE ANALYSIS, 2025–2034, (USD MILLION)
FIGURE 46 BRAZIL DEMOCRATIZATION OF AI CURRENT AND FUTURE END USER ANALYSIS, 2025–2034, (USD MILLION)
FIGURE 47 ARGENTINA DEMOCRATIZATION OF AI CURRENT AND FUTURE TYPE ANALYSIS, 2025–2034, (USD MILLION)
FIGURE 48 ARGENTINA DEMOCRATIZATION OF AI CURRENT AND FUTURE END USER ANALYSIS, 2025–2034, (USD MILLION)
FIGURE 49 COLUMBIA DEMOCRATIZATION OF AI CURRENT AND FUTURE TYPE ANALYSIS, 2025–2034, (USD MILLION)
FIGURE 50 COLUMBIA DEMOCRATIZATION OF AI CURRENT AND FUTURE END USER ANALYSIS, 2025–2034, (USD MILLION)
FIGURE 51 REST OF LATIN AMERICA DEMOCRATIZATION OF AI CURRENT AND FUTURE TYPE ANALYSIS, 2025–2034, (USD MILLION)
FIGURE 52 REST OF LATIN AMERICA DEMOCRATIZATION OF AI CURRENT AND FUTURE END USER ANALYSIS, 2025–2034, (USD MILLION)
FIGURE 53 EASTERN EUROPE DEMOCRATIZATION OF AI CURRENT AND FUTURE MARKET VOLUME SHARE REGIONAL ANALYSIS, 2025–2034, (USD MILLION)
FIGURE 54 POLAND DEMOCRATIZATION OF AI CURRENT AND FUTURE TYPE ANALYSIS, 2025–2034, (USD MILLION)
FIGURE 55 POLAND DEMOCRATIZATION OF AI CURRENT AND FUTURE END USER ANALYSIS, 2025–2034, (USD MILLION)
FIGURE 56 RUSSIA DEMOCRATIZATION OF AI CURRENT AND FUTURE TYPE ANALYSIS, 2025–2034, (USD MILLION)
FIGURE 57 RUSSIA DEMOCRATIZATION OF AI CURRENT AND FUTURE END USER ANALYSIS, 2025–2034, (USD MILLION)
FIGURE 58 CZECH REPUBLIC DEMOCRATIZATION OF AI CURRENT AND FUTURE TYPE ANALYSIS, 2025–2034, (USD MILLION)
FIGURE 59 CZECH REPUBLIC DEMOCRATIZATION OF AI CURRENT AND FUTURE END USER ANALYSIS, 2025–2034, (USD MILLION)
FIGURE 60 ROMANIA DEMOCRATIZATION OF AI CURRENT AND FUTURE TYPE ANALYSIS, 2025–2034, (USD MILLION)
FIGURE 61 ROMANIA DEMOCRATIZATION OF AI CURRENT AND FUTURE END USER ANALYSIS, 2025–2034, (USD MILLION)
FIGURE 62 REST OF EASTERN EUROPE DEMOCRATIZATION OF AI CURRENT AND FUTURE TYPE ANALYSIS, 2025–2034, (USD MILLION)
FIGURE 63 REST OF EASTERN EUROPE DEMOCRATIZATION OF AI CURRENT AND FUTURE END USER ANALYSIS, 2025–2034, (USD MILLION)
FIGURE 64 WESTERN EUROPE DEMOCRATIZATION OF AI CURRENT AND FUTURE MARKET VOLUME SHARE REGIONAL ANALYSIS, 2025–2034, (USD MILLION)
FIGURE 65 GERMANY DEMOCRATIZATION OF AI CURRENT AND FUTURE TYPE ANALYSIS, 2025–2034, (USD MILLION)
FIGURE 66 GERMANY DEMOCRATIZATION OF AI CURRENT AND FUTURE END USER ANALYSIS, 2025–2034, (USD MILLION)
FIGURE 67 FRANCE DEMOCRATIZATION OF AI CURRENT AND FUTURE TYPE ANALYSIS, 2025–2034, (USD MILLION)
FIGURE 68 FRANCE DEMOCRATIZATION OF AI CURRENT AND FUTURE END USER ANALYSIS, 2025–2034, (USD MILLION)
FIGURE 69 UK DEMOCRATIZATION OF AI CURRENT AND FUTURE TYPE ANALYSIS, 2025–2034, (USD MILLION)
FIGURE 70 UK DEMOCRATIZATION OF AI CURRENT AND FUTURE END USER ANALYSIS, 2025–2034, (USD MILLION)
FIGURE 71 SPAIN DEMOCRATIZATION OF AI CURRENT AND FUTURE TYPE ANALYSIS, 2025–2034, (USD MILLION)
FIGURE 72 SPAIN DEMOCRATIZATION OF AI CURRENT AND FUTURE END USER ANALYSIS, 2025–2034, (USD MILLION)
FIGURE 73 ITALY DEMOCRATIZATION OF AI CURRENT AND FUTURE TYPE ANALYSIS, 2025–2034, (USD MILLION)
FIGURE 74 ITALY DEMOCRATIZATION OF AI CURRENT AND FUTURE END USER ANALYSIS, 2025–2034, (USD MILLION)
FIGURE 75 REST OF WESTERN EUROPE DEMOCRATIZATION OF AI CURRENT AND FUTURE TYPE ANALYSIS, 2025–2034, (USD MILLION)
FIGURE 76 REST OF WESTERN EUROPE DEMOCRATIZATION OF AI CURRENT AND FUTURE END USER ANALYSIS, 2025–2034, (USD MILLION)
FIGURE 77 EAST ASIA AND PACIFIC DEMOCRATIZATION OF AI CURRENT AND FUTURE MARKET VOLUME SHARE REGIONAL ANALYSIS, 2025–2034, (USD MILLION)
FIGURE 78 CHINA DEMOCRATIZATION OF AI CURRENT AND FUTURE TYPE ANALYSIS, 2025–2034, (USD MILLION)
FIGURE 79 CHINA DEMOCRATIZATION OF AI CURRENT AND FUTURE END USER ANALYSIS, 2025–2034, (USD MILLION)
FIGURE 80 JAPAN DEMOCRATIZATION OF AI CURRENT AND FUTURE TYPE ANALYSIS, 2025–2034, (USD MILLION)
FIGURE 81 JAPAN DEMOCRATIZATION OF AI CURRENT AND FUTURE END USER ANALYSIS, 2025–2034, (USD MILLION)
FIGURE 82 AUSTRALIA DEMOCRATIZATION OF AI CURRENT AND FUTURE TYPE ANALYSIS, 2025–2034, (USD MILLION)
FIGURE 83 AUSTRALIA DEMOCRATIZATION OF AI CURRENT AND FUTURE END USER ANALYSIS, 2025–2034, (USD MILLION)
FIGURE 84 CAMBODIA DEMOCRATIZATION OF AI CURRENT AND FUTURE TYPE ANALYSIS, 2025–2034, (USD MILLION)
FIGURE 85 CAMBODIA DEMOCRATIZATION OF AI CURRENT AND FUTURE END USER ANALYSIS, 2025–2034, (USD MILLION)
FIGURE 86 FIJI DEMOCRATIZATION OF AI CURRENT AND FUTURE TYPE ANALYSIS, 2025–2034, (USD MILLION)
FIGURE 87 FIJI DEMOCRATIZATION OF AI CURRENT AND FUTURE END USER ANALYSIS, 2025–2034, (USD MILLION)
FIGURE 88 INDONESIA DEMOCRATIZATION OF AI CURRENT AND FUTURE TYPE ANALYSIS, 2025–2034, (USD MILLION)
FIGURE 89 INDONESIA DEMOCRATIZATION OF AI CURRENT AND FUTURE END USER ANALYSIS, 2025–2034, (USD MILLION)
FIGURE 90 SOUTH KOREA DEMOCRATIZATION OF AI CURRENT AND FUTURE TYPE ANALYSIS, 2025–2034, (USD MILLION)
FIGURE 91 SOUTH KOREA DEMOCRATIZATION OF AI CURRENT AND FUTURE END USER ANALYSIS, 2025–2034, (USD MILLION)
FIGURE 92 REST OF EAST ASIA AND PACIFIC DEMOCRATIZATION OF AI CURRENT AND FUTURE TYPE ANALYSIS, 2025–2034, (USD MILLION)
FIGURE 93 REST OF EAST ASIA AND PACIFIC DEMOCRATIZATION OF AI CURRENT AND FUTURE END USER ANALYSIS, 2025–2034, (USD MILLION)
FIGURE 94 SEA AND SOUTH ASIA DEMOCRATIZATION OF AI CURRENT AND FUTURE MARKET VOLUME SHARE REGIONAL ANALYSIS, 2025–2034, (USD MILLION)
FIGURE 95 BANGLADESH DEMOCRATIZATION OF AI CURRENT AND FUTURE TYPE ANALYSIS, 2025–2034, (USD MILLION)
FIGURE 96 BANGLADESH DEMOCRATIZATION OF AI CURRENT AND FUTURE END USER ANALYSIS, 2025–2034, (USD MILLION)
FIGURE 97 NEW ZEALAND DEMOCRATIZATION OF AI CURRENT AND FUTURE TYPE ANALYSIS, 2025–2034, (USD MILLION)
FIGURE 98 NEW ZEALAND DEMOCRATIZATION OF AI CURRENT AND FUTURE END USER ANALYSIS, 2025–2034, (USD MILLION)
FIGURE 99 INDIA DEMOCRATIZATION OF AI CURRENT AND FUTURE TYPE ANALYSIS, 2025–2034, (USD MILLION)
FIGURE 100 INDIA DEMOCRATIZATION OF AI CURRENT AND FUTURE END USER ANALYSIS, 2025–2034, (USD MILLION)
FIGURE 101 SINGAPORE DEMOCRATIZATION OF AI CURRENT AND FUTURE TYPE ANALYSIS, 2025–2034, (USD MILLION)
FIGURE 102 SINGAPORE DEMOCRATIZATION OF AI CURRENT AND FUTURE END USER ANALYSIS, 2025–2034, (USD MILLION)
FIGURE 103 THAILAND DEMOCRATIZATION OF AI CURRENT AND FUTURE TYPE ANALYSIS, 2025–2034, (USD MILLION)
FIGURE 104 THAILAND DEMOCRATIZATION OF AI CURRENT AND FUTURE END USER ANALYSIS, 2025–2034, (USD MILLION)
FIGURE 105 TAIWAN DEMOCRATIZATION OF AI CURRENT AND FUTURE TYPE ANALYSIS, 2025–2034, (USD MILLION)
FIGURE 106 TAIWAN DEMOCRATIZATION OF AI CURRENT AND FUTURE END USER ANALYSIS, 2025–2034, (USD MILLION)
FIGURE 107 MALAYSIA DEMOCRATIZATION OF AI CURRENT AND FUTURE TYPE ANALYSIS, 2025–2034, (USD MILLION)
FIGURE 108 MALAYSIA DEMOCRATIZATION OF AI CURRENT AND FUTURE END USER ANALYSIS, 2025–2034, (USD MILLION)
FIGURE 109 REST OF SEA AND SOUTH ASIA DEMOCRATIZATION OF AI CURRENT AND FUTURE TYPE ANALYSIS, 2025–2034, (USD MILLION)
FIGURE 110 REST OF SEA AND SOUTH ASIA DEMOCRATIZATION OF AI CURRENT AND FUTURE END USER ANALYSIS, 2025–2034, (USD MILLION)
FIGURE 111 MIDDLE EAST AND AFRICA DEMOCRATIZATION OF AI CURRENT AND FUTURE MARKET VOLUME SHARE REGIONAL ANALYSIS, 2025–2034, (USD MILLION)
FIGURE 112 GCC COUNTRIES DEMOCRATIZATION OF AI CURRENT AND FUTURE TYPE ANALYSIS, 2025–2034, (USD MILLION)
FIGURE 113 GCC COUNTRIES DEMOCRATIZATION OF AI CURRENT AND FUTURE END USER ANALYSIS, 2025–2034, (USD MILLION)
FIGURE 114 SAUDI ARABIA DEMOCRATIZATION OF AI CURRENT AND FUTURE TYPE ANALYSIS, 2025–2034, (USD MILLION)
FIGURE 115 SAUDI ARABIA DEMOCRATIZATION OF AI CURRENT AND FUTURE END USER ANALYSIS, 2025–2034, (USD MILLION)
FIGURE 116 UAE DEMOCRATIZATION OF AI CURRENT AND FUTURE TYPE ANALYSIS, 2025–2034, (USD MILLION)
FIGURE 117 UAE DEMOCRATIZATION OF AI CURRENT AND FUTURE END USER ANALYSIS, 2025–2034, (USD MILLION)
FIGURE 118 BAHRAIN DEMOCRATIZATION OF AI CURRENT AND FUTURE TYPE ANALYSIS, 2025–2034, (USD MILLION)
FIGURE 119 BAHRAIN DEMOCRATIZATION OF AI CURRENT AND FUTURE END USER ANALYSIS, 2025–2034, (USD MILLION)
FIGURE 120 KUWAIT DEMOCRATIZATION OF AI CURRENT AND FUTURE TYPE ANALYSIS, 2025–2034, (USD MILLION)
FIGURE 121 KUWAIT DEMOCRATIZATION OF AI CURRENT AND FUTURE END USER ANALYSIS, 2025–2034, (USD MILLION)
FIGURE 122 OMAN DEMOCRATIZATION OF AI CURRENT AND FUTURE TYPE ANALYSIS, 2025–2034, (USD MILLION)
FIGURE 123 OMAN DEMOCRATIZATION OF AI CURRENT AND FUTURE END USER ANALYSIS, 2025–2034, (USD MILLION)
FIGURE 124 QATAR DEMOCRATIZATION OF AI CURRENT AND FUTURE TYPE ANALYSIS, 2025–2034, (USD MILLION)
FIGURE 125 QATAR DEMOCRATIZATION OF AI CURRENT AND FUTURE END USER ANALYSIS, 2025–2034, (USD MILLION)
FIGURE 126 EGYPT DEMOCRATIZATION OF AI CURRENT AND FUTURE TYPE ANALYSIS, 2025–2034, (USD MILLION)
FIGURE 127 EGYPT DEMOCRATIZATION OF AI CURRENT AND FUTURE END USER ANALYSIS, 2025–2034, (USD MILLION)
FIGURE 128 NIGERIA DEMOCRATIZATION OF AI CURRENT AND FUTURE TYPE ANALYSIS, 2025–2034, (USD MILLION)
FIGURE 129 NIGERIA DEMOCRATIZATION OF AI CURRENT AND FUTURE END USER ANALYSIS, 2025–2034, (USD MILLION)
FIGURE 130 SOUTH AFRICA DEMOCRATIZATION OF AI CURRENT AND FUTURE TYPE ANALYSIS, 2025–2034, (USD MILLION)
FIGURE 131 SOUTH AFRICA DEMOCRATIZATION OF AI CURRENT AND FUTURE END USER ANALYSIS, 2025–2034, (USD MILLION)
FIGURE 132 ISRAEL DEMOCRATIZATION OF AI CURRENT AND FUTURE TYPE ANALYSIS, 2025–2034, (USD MILLION)
FIGURE 133 ISRAEL DEMOCRATIZATION OF AI CURRENT AND FUTURE END USER ANALYSIS, 2025–2034, (USD MILLION)
FIGURE 134 REST OF MEA DEMOCRATIZATION OF AI CURRENT AND FUTURE TYPE ANALYSIS, 2025–2034, (USD MILLION)
FIGURE 135 REST OF MEA DEMOCRATIZATION OF AI CURRENT AND FUTURE END USER ANALYSIS, 2025–2034, (USD MILLION)
FIGURE 136 U. S. MARKET SHARE ANALYSIS BY TYPE (2024)
FIGURE 137 U. S. MARKET SHARE ANALYSIS BY END USER (2024)
FIGURE 138 CANADA MARKET SHARE ANALYSIS BY TYPE (2024)
FIGURE 139 CANADA MARKET SHARE ANALYSIS BY END USER (2024)
FIGURE 140 MEXICO MARKET SHARE ANALYSIS BY TYPE (2024)
FIGURE 141 MEXICO MARKET SHARE ANALYSIS BY END USER (2024)
FIGURE 142 CHINA MARKET SHARE ANALYSIS BY TYPE (2024)
FIGURE 143 CHINA MARKET SHARE ANALYSIS BY END USER (2024)
FIGURE 144 JAPAN MARKET SHARE ANALYSIS BY TYPE (2024)
FIGURE 145 JAPAN MARKET SHARE ANALYSIS BY END USER (2024)
FIGURE 146 INDIA MARKET SHARE ANALYSIS BY TYPE (2024)
FIGURE 147 INDIA MARKET SHARE ANALYSIS BY END USER (2024)
FIGURE 148 SOUTH KOREA MARKET SHARE ANALYSIS BY TYPE (2024)
FIGURE 149 SOUTH KOREA MARKET SHARE ANALYSIS BY END USER (2024)
FIGURE 150 SAUDI ARABIA MARKET SHARE ANALYSIS BY TYPE (2024)
FIGURE 151 SAUDI ARABIA MARKET SHARE ANALYSIS BY END USER (2024)
FIGURE 152 UAE MARKET SHARE ANALYSIS BY TYPE (2024)
FIGURE 153 UAE MARKET SHARE ANALYSIS BY END USER (2024)
FIGURE 154 EGYPT MARKET SHARE ANALYSIS BY TYPE (2024)
FIGURE 155 EGYPT MARKET SHARE ANALYSIS BY END USER (2024)
FIGURE 156 NIGERIA MARKET SHARE ANALYSIS BY TYPE (2024)
FIGURE 157 NIGERIA MARKET SHARE ANALYSIS BY END USER (2024)
FIGURE 158 SOUTH AFRICA MARKET SHARE ANALYSIS BY TYPE (2024)
FIGURE 159 SOUTH AFRICA MARKET SHARE ANALYSIS BY END USER (2024)
FIGURE 160 GERMANY MARKET SHARE ANALYSIS BY TYPE (2024)
FIGURE 161 GERMANY MARKET SHARE ANALYSIS BY END USER (2024)
FIGURE 162 FRANCE MARKET SHARE ANALYSIS BY TYPE (2024)
FIGURE 163 FRANCE MARKET SHARE ANALYSIS BY END USER (2024)
FIGURE 164 UK MARKET SHARE ANALYSIS BY TYPE (2024)
FIGURE 165 UK MARKET SHARE ANALYSIS BY END USER (2024)
FIGURE 166 SPAIN MARKET SHARE ANALYSIS BY TYPE (2024)
FIGURE 167 SPAIN MARKET SHARE ANALYSIS BY END USER (2024)
FIGURE 168 ITALY MARKET SHARE ANALYSIS BY TYPE (2024)
FIGURE 169 ITALY MARKET SHARE ANALYSIS BY END USER (2024)
FIGURE 170 BRAZIL MARKET SHARE ANALYSIS BY TYPE (2024)
FIGURE 171 BRAZIL MARKET SHARE ANALYSIS BY END USER (2024)
FIGURE 172 ARGENTINA MARKET SHARE ANALYSIS BY TYPE (2024)
FIGURE 173 ARGENTINA MARKET SHARE ANALYSIS BY END USER (2024)
FIGURE 174 COLUMBIA MARKET SHARE ANALYSIS BY TYPE (2024)
FIGURE 175 COLUMBIA MARKET SHARE ANALYSIS BY END USER (2024)
FIGURE 176 GLOBAL DEMOCRATIZATION OF AI CURRENT AND FUTURE MARKET KEY COUNTRY LEVEL ANALYSIS, 2024–2034, (USD MILLION)
FIGURE 177 FINANCIAL OVERVIEW:
Key Player Analysis
Teva Pharmaceutical Industries Ltd.: Teva remains a global leader in the specialty generics market, holding one of the most extensive portfolios of complex generics and biosimilars. As of 2025, the company generates over 50% of its total revenue from generics, with specialty generics contributing significantly in therapeutic areas such as oncology, neurology, and respiratory care. Teva’s position is reinforced by its vertical integration strategy and extensive global manufacturing footprint, which spans more than 30 countries. The company continues to invest heavily in R&D, allocating over USD 1.7 billion in 2024, primarily focused on high-barrier generics including long-acting injectables and complex APIs. Its recent partnership with Alvotech to co-develop biosimilars has strengthened its oncology pipeline and enhanced its competitive advantage in the U.S. and EU markets.
Viatris Inc.: Viatris operates as a strong challenger in the specialty generics space, leveraging its legacy from the Mylan-Upjohn merger. The company’s portfolio includes over 1,400 products, with a growing share of revenue derived from complex generics and biosimilars. In 2025, Viatris is expanding its presence in oncology and endocrinology through targeted launches in Europe and emerging markets. The firm is prioritizing portfolio rationalization and cost optimization, resulting in improved margins in its generics segment. Viatris is also advancing digital integration in its supply chain to improve delivery times and reduce inventory risk. Its focus on affordability and scale gives it a competitive edge, particularly in Latin America and Asia, where healthcare systems increasingly favor high-volume, low-cost therapies.
Novartis AG (Sandoz Division): Following its spinoff from Novartis, Sandoz has repositioned itself as a focused market leader in biosimilars and complex generics. By 2025, Sandoz controls a sizeable portion of the European specialty generics market, with leading positions in anti-infectives, oncology, and immunology. Its commercial success is underpinned by strong regulatory capabilities, with over 300 marketing authorizations granted across global markets in the past two years. Sandoz is actively investing in digital manufacturing and AI-driven process optimization to reduce production costs and improve quality assurance. The company’s strategic shift toward higher-margin biosimilars and sterile injectables is designed to reduce reliance on commoditized oral generics and sustain long-term growth.
Hikma Pharmaceuticals PLC: Hikma has solidified its role as a key regional player and rising competitor in the global specialty generics market, with strongholds in the U.S. and Middle East. The company’s injectable segment, which accounted for nearly 40% of its total revenue in 2024, continues to drive growth. Hikma’s specialty generics portfolio focuses on critical care, oncology, and pain management, with recent approvals of sterile injectable generics for hospital use boosting its U.S. footprint. The firm’s acquisition of Custopharm and expansion of its FDA-approved facilities are enabling it to scale complex drug manufacturing. Hikma differentiates through its agility in navigating regulatory environments and its strategic focus on underserved therapeutic areas, positioning it for further expansion in both developed and emerging markets.
Market Key Players
Teva Pharmaceutical Industries Ltd.
Viatris Inc.
Novartis AG (Sandoz Group AG)
Hikma Pharmaceuticals PLC
Mallinckrodt Pharmaceuticals
Bausch Health Companies Inc.
Dr. Reddy’s Laboratories Ltd.
Sun Pharmaceutical Industries Ltd.
Amneal Pharmaceuticals LLC
Apotex Corp.
Endo Pharmaceuticals Inc.
Fresenius Kabi Brasil Ltda
STADA Arzneimittel AG
Pfizer, Inc.
Driver:
Rising Chronic Disease Burden Driving Demand for Specialty Generics
The global rise in chronic and complex diseases continues to be a primary driver for the specialty generics market in 2025. Conditions such as cancer, rheumatoid arthritis, hepatitis C, and multiple sclerosis are increasing in prevalence due to aging populations, urban lifestyles, and metabolic risk factors. According to the WHO, chronic diseases now account for over 70% of global deaths. These conditions require long-term treatment with specialized medications, many of which are now reaching the end of their patent life. Specialty generics offer lower-cost alternatives to branded therapies without compromising efficacy. For healthcare systems under budget pressure, this makes specialty generics a key solution to expanding treatment access while managing expenditure.
Restraint:
High Development Costs and Regulatory Complexity Limiting Market Entry
High development costs and complex regulatory pathways are major barriers limiting broader market participation. Specialty generics often require advanced formulations, sterile production environments, and strict bioequivalence studies, which push R&D and compliance costs significantly above those for conventional generics. A typical development cycle can exceed USD 10 million per product. In addition, abbreviated approval pathways still demand intensive clinical data for complex molecules. These challenges discourage smaller players and prolong time to market. Limited market exclusivity further compresses return on investment, as competing products can quickly enter once exclusivity expires, triggering price erosion and reducing margins.
Opportunity:
Expanding Need for Cost-Effective Specialty Therapies in Global Markets
Rising demand for cost-effective specialty therapies, especially in oncology, immunology, and rare diseases, presents a substantial growth opportunity. As of 2025, over 40% of global pharmaceutical spending is allocated to specialty drugs. Specialty generics offer up to 60% cost savings compared to branded versions, making them increasingly favored by payers and providers. Markets in Asia Pacific and Latin America, where out-of-pocket spending remains high, are particularly receptive. Combined with supportive regulatory changes in countries like Brazil and India, the global specialty generics market is well-positioned to surpass USD 160 billion by 2032, growing at a CAGR of over 8%.
Trend:
Shift Toward Advanced Formulations and Platform-Based Manufacturing
In 2025, manufacturers are shifting focus toward platform-based drug delivery technologies and advanced manufacturing to gain differentiation in a crowded market. There's growing investment in complex generics and biosimilars that require novel formulations, such as liposomal drugs and long-acting injectables. Companies like Sandoz and Teva are expanding pipelines using partnerships to accelerate development. At the same time, emerging markets are becoming key production hubs. For instance, Indian firms now supply over 25% of the world’s generics, including complex therapies. This trend signals a shift from volume-based competition to value-based innovation within the specialty generics segment.
Recent Developments
Dec 2024 – Viatris Inc.: Viatris entered into a USD 430 million agreement to acquire a portfolio of complex injectables from a European generics manufacturer. The acquisition includes 12 marketed products and 5 pipeline assets across oncology and critical care. This strengthens Viatris’ position in high-margin hospital-based specialty generics in Western Europe.
Feb 2025 – Hikma Pharmaceuticals PLC: Hikma expanded its U.S. sterile injectables facility in New Jersey, increasing annual production capacity by 35%. The company also announced three FDA-approved launches for oncology and pain management generics. This expansion enhances Hikma’s supply chain resilience and positions it to meet growing U.S. hospital demand.
Apr 2025 – Teva Pharmaceutical Industries Ltd.: Teva launched a biosimilar version of a leading autoimmune therapy in Germany, priced 45% below the branded equivalent. The product is expected to capture 20% market share within the first year. This reinforces Teva’s cost-competitive positioning in the European specialty generics segment.
Jul 2025 – Sandoz (Novartis AG): Sandoz signed a strategic partnership with a digital therapeutics startup to integrate AI-driven adherence tools with its specialty generics in chronic care. The platform will be rolled out across key EU markets by Q4 2025. The move supports Sandoz’s shift toward value-based care models and enhances patient retention.
Sep 2025 – Aurobindo Pharma: Aurobindo received regulatory clearance for its new manufacturing site in Andhra Pradesh, India, with a projected annual output of over 1 billion injectable units. The USD 280 million investment targets growth across APAC and African hospital markets. This improves the company’s cost base and export capabilities in complex generics.