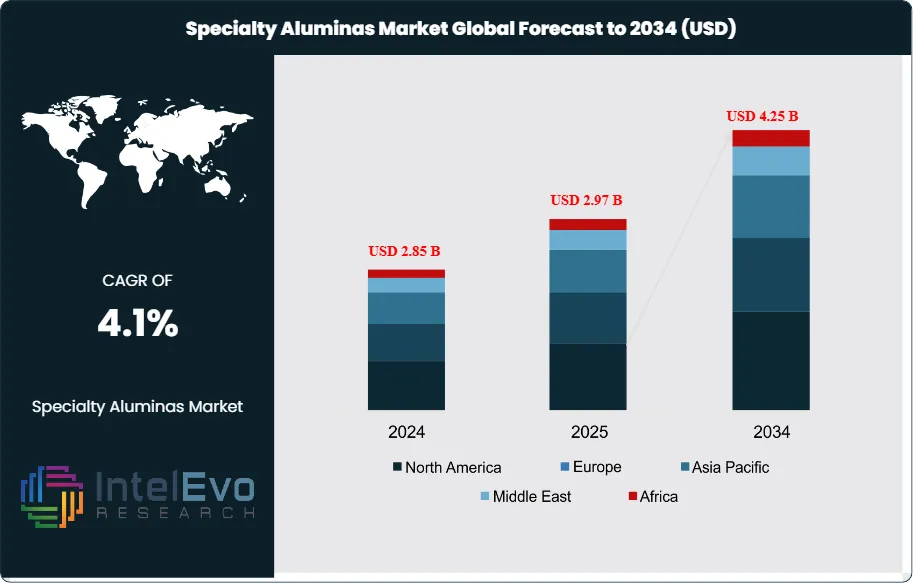
The global specialty aluminas market is set for significant growth. Its value is expected to increase from USD 2.85 billion in 2024 to about USD 4.25 billion by 2034. This growth, with a steady CAGR of 4.1%, is mainly driven by rising demand for high-performance materials in the automotive, electronics, and renewable energy sectors. As industries focus more on lightweight components and sustainable manufacturing, specialty aluminas—including aluminum trihydroxide (ATH), calcined, and activated types—are becoming essential due to their excellent thermal stability, hardness, and chemical resistance.
The market is also seeing benefits from a shift toward eco-friendly and high-purity materials in advanced engineering. These aluminas are key components for refractories, catalysts, and high-tech ceramics, significantly impacting the fields of aerospace and electronics. With an increased focus on specialized uses like polishing agents and abrasives, the specialty alumina sector is poised to remain a vital part of the advanced materials landscape, connecting raw resource processing with next-generation technology.
North America currently leads the specialty aluminas market, attributed to its advanced industrial base, significant investments in research and development, and stringent environmental regulations promoting the use of high-performance materials. The region's focus on technological innovation and sustainability further propels market growth. Asia-Pacific follows closely, with countries like China, India, and Japan experiencing rapid industrialization and infrastructure development, leading to increased demand for specialty aluminas in various applications. The region's expanding electronics and automotive sectors also contribute to market expansion.
The COVID-19 pandemic initially disrupted the specialty aluminas market due to supply chain interruptions and reduced industrial activities. However, the market demonstrated resilience, with a rebound driven by the resumption of industrial operations and increased demand in sectors like healthcare and electronics, where specialty aluminas play a critical role. The pandemic also underscored the importance of supply chain diversification and the need for localized production, influencing strategic decisions in the industry.
Key Takeaways:
Market Growth: The Specialty Aluminas Market is expected to reach USD 4.25 Billion by 2034, growing at a robust CAGR of 4.1% from 2024, owing to surge in industrial activities, particularly in emerging economies, coupled with technological innovations in manufacturing processes.
Type Dominance: Calcined alumina leads the market by type, while low soda alumina is the fastest-growing segment, reflecting the material's critical role in high-temperature industrial processes and advanced applications.
Application Dominance: Refractory materials dominate the application segment, with catalysts emerging as the fastest-growing application, driven by the increasing demand for specialty aluminas in chemical processing and environmental applications.
Driver: The specialty aluminas market is driven by rising demand in refractory and ceramic applications due to rapid industrialization and infrastructure growth. Additionally, the expansion of high-tech industries such as EVs, electronics, and energy storage is boosting the need for advanced, high-performance aluminas.
Restraint: High production costs and complex processing requirements limit the profitability and scalability of specialty aluminas. Environmental regulations and sustainability pressures further challenge manufacturers by increasing compliance and operational costs.
Opportunity: There is a strong opportunity in developing flame-retardant and eco-friendly materials using aluminas like ATH, driven by safety and sustainability trends. Emerging applications in electronics, catalysts, and battery technologies also present significant growth avenues.
Trend: Technological advancements are pushing the demand for high-purity aluminas in precision and electronic components. At the same time, a growing focus on circular economy and greener production practices is shaping the market’s future direction.
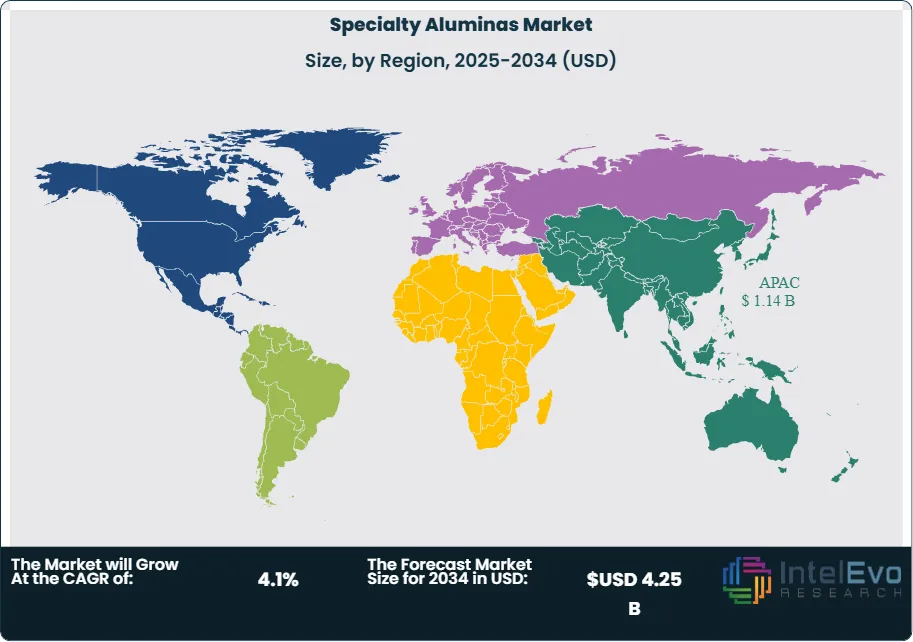
Regional Analysis: Asia-Pacific leads the global specialty aluminas market, driven by strong industrial activity, rapid urbanization, and growing demand for high-performance materials in countries like China, India, and Japan. North America and Europe also hold significant market shares, owing to technological advancements and established manufacturing bases. Meanwhile, Latin America and the Middle East & Africa are witnessing gradual growth, supported by infrastructure development and increasing investments in industrial processing.
Type Analysis:
Calcined alumina holds the dominant position in the specialty aluminas market due to its high thermal stability, hardness, and chemical resistance. It is widely used in refractory products, ceramics, and abrasives, making it essential for industries that require high-performance materials under extreme conditions. Its versatility and favorable cost-performance ratio further solidify its market leadership.
On the other hand, low soda alumina is the fastest-growing sub-segment, primarily due to its high purity and minimal sodium content, which is crucial in advanced applications such as electronic ceramics, LED substrates, and high-grade refractories. The growing demand from industries prioritizing precision, purity, and performance—particularly in energy storage, semiconductors, and aerospace—has fueled the adoption of low soda variants. As manufacturing technologies evolve, the need for high-specification aluminas is expected to increase, driving further growth in this segment.
Application Analysis:
Refractory Leads With the Market Share with over 35% in Specialty Aluminas Market. Refractory materials dominate the application landscape for specialty aluminas, largely due to their integral role in lining furnaces, kilns, and reactors across industries like steel, glass, and cement. Specialty aluminas such as calcined and reactive alumina provide excellent thermal insulation, corrosion resistance, and structural strength, making them indispensable in high-temperature industrial operations. The rising demand for durable refractory linings in energy-intensive sectors has sustained the strong market share of this application segment.
Meanwhile, catalysts represent the fastest-growing application segment. Activated alumina and boehmite are extensively used as catalyst supports in petroleum refining, gas processing, and emission control technologies. As global regulations on emissions and environmental sustainability tighten, industries are increasingly turning to alumina-based catalysts for efficient pollutant control and chemical conversion. The growth in green technologies and demand for cleaner industrial processes is accelerating the adoption of aluminas in catalytic applications, positioning this segment for significant future expansion.
Region Analysis:
Asia-Pacific Leads With the Market Share with over 40% in Specialty Aluminas Market. The Asia-Pacific region dominates the specialty aluminas market and is expected to maintain its leading position over the forecast period. This dominance is primarily fueled by extensive industrialization, rising construction activity, and the expanding electronics, automotive, and ceramics sectors. China, in particular, is a key consumer due to its large-scale manufacturing infrastructure and government-backed initiatives for energy efficiency and high-performance materials. India and Japan are also contributing significantly through rising demand in refractories, ceramics, and catalyst applications.
North America and Europe follow closely, benefiting from well-established industrial frameworks, environmental regulations driving demand for alumina-based catalysts, and growing investments in advanced ceramics and electronics. The presence of major players and research institutions further supports market development in these regions.
Latin America and Middle East & Africa, while currently smaller markets, are projected to see steady growth due to urban expansion, industrial upgrades, and a gradual shift toward high-temperature materials in key sectors.
Customization for segments, region/country-level will be provided. Moreover, additional customization can be done based on the requirements.
Pricing and Purchase Options
Avail customized purchase options to meet your exact research needs. We have three licenses to opt for: Single User License, Multi-User License (Up to 5 Users), Corporate Use License (Unlimited User and Printable PDF).
TABLE OF CONTENTS
1. EXECUTIVE SUMMARY
1.1. MARKET SNAPSHOT
1.2. KEY FINDINGS & INSIGHTS
1.3. ANALYST RECOMMENDATIONS
1.4. FUTURE OUTLOOK
2. RESEARCH METHODOLOGY
2.1. MARKET DEFINITION & SCOPE
2.2. RESEARCH OBJECTIVES: PRIMARY & SECONDARY DATA SOURCES
2.3. DATA COLLECTION SOURCES
2.3.1. COVERAGE OF 100+ PRIMARY RESEARCH/CONSULTATION CALLS WITH INDUSTRY STAKEHOLDERS
FIGURE 17 NORTH AMERICA SPECIALTY ALUMINAS CURRENT AND FUTURE TYPE ANALYSIS, 2025–2034, (USD MILLION)
FIGURE 18 NORTH AMERICA SPECIALTY ALUMINAS CURRENT AND FUTURE END USER ANALYSIS, 2025–2034, (USD MILLION)
FIGURE 19 MARKET SHARE BY COUNTRY
FIGURE 20 LATIN AMERICA SPECIALTY ALUMINAS CURRENT AND FUTURE TYPE ANALYSIS, 2025–2034, (USD MILLION)
FIGURE 21 LATIN AMERICA SPECIALTY ALUMINAS CURRENT AND FUTURE END USER ANALYSIS, 2025–2034, (USD MILLION)
FIGURE 22 MARKET SHARE BY COUNTRY
FIGURE 23 EASTERN EUROPE SPECIALTY ALUMINAS CURRENT AND FUTURE TYPE ANALYSIS, 2025–2034, (USD MILLION)
FIGURE 24 EASTERN EUROPE SPECIALTY ALUMINAS CURRENT AND FUTURE END USER ANALYSIS, 2025–2034, (USD MILLION)
FIGURE 25 MARKET SHARE BY COUNTRY
FIGURE 26 WESTERN EUROPE SPECIALTY ALUMINAS CURRENT AND FUTURE TYPE ANALYSIS, 2025–2034, (USD MILLION)
FIGURE 27 WESTERN EUROPE SPECIALTY ALUMINAS CURRENT AND FUTURE END USER ANALYSIS, 2025–2034, (USD MILLION)
FIGURE 28 MARKET SHARE BY COUNTRY
FIGURE 29 EAST ASIA AND PACIFIC SPECIALTY ALUMINAS CURRENT AND FUTURE TYPE ANALYSIS, 2025–2034, (USD MILLION)
FIGURE 30 EAST ASIA AND PACIFIC SPECIALTY ALUMINAS CURRENT AND FUTURE END USER ANALYSIS, 2025–2034, (USD MILLION)
FIGURE 31 MARKET SHARE BY COUNTRY
FIGURE 32 SEA AND SOUTH ASIA SPECIALTY ALUMINAS CURRENT AND FUTURE TYPE ANALYSIS, 2025–2034, (USD MILLION)
FIGURE 33 SEA AND SOUTH ASIA SPECIALTY ALUMINAS CURRENT AND FUTURE END USER ANALYSIS, 2025–2034, (USD MILLION)
FIGURE 34 MARKET SHARE BY COUNTRY
FIGURE 35 MIDDLE EAST AND AFRICA SPECIALTY ALUMINAS CURRENT AND FUTURE TYPE ANALYSIS, 2025–2034, (USD MILLION)
FIGURE 36 MIDDLE EAST AND AFRICA SPECIALTY ALUMINAS CURRENT AND FUTURE END USER ANALYSIS, 2025–2034, (USD MILLION)
FIGURE 37 NORTH AMERICA SPECIALTY ALUMINAS CURRENT AND FUTURE MARKET VOLUME SHARE REGIONAL ANALYSIS, 2025–2034, (USD MILLION)
FIGURE 38 U.S. SPECIALTY ALUMINAS CURRENT AND FUTURE TYPE ANALYSIS, 2025–2034, (USD MILLION)
FIGURE 39 U.S. SPECIALTY ALUMINAS CURRENT AND FUTURE END USER ANALYSIS, 2025–2034, (USD MILLION)
FIGURE 40 CANADA SPECIALTY ALUMINAS CURRENT AND FUTURE TYPE ANALYSIS, 2025–2034, (USD MILLION)
FIGURE 41 CANADA SPECIALTY ALUMINAS CURRENT AND FUTURE END USER ANALYSIS, 2025–2034, (USD MILLION)
FIGURE 42 LATIN AMERICA SPECIALTY ALUMINAS CURRENT AND FUTURE MARKET VOLUME SHARE REGIONAL ANALYSIS, 2025–2034, (USD MILLION)
FIGURE 43 MEXICO SPECIALTY ALUMINAS CURRENT AND FUTURE TYPE ANALYSIS, 2025–2034, (USD MILLION)
FIGURE 44 MEXICO SPECIALTY ALUMINAS CURRENT AND FUTURE END USER ANALYSIS, 2025–2034, (USD MILLION)
FIGURE 45 BRAZIL SPECIALTY ALUMINAS CURRENT AND FUTURE TYPE ANALYSIS, 2025–2034, (USD MILLION)
FIGURE 46 BRAZIL SPECIALTY ALUMINAS CURRENT AND FUTURE END USER ANALYSIS, 2025–2034, (USD MILLION)
FIGURE 47 ARGENTINA SPECIALTY ALUMINAS CURRENT AND FUTURE TYPE ANALYSIS, 2025–2034, (USD MILLION)
FIGURE 48 ARGENTINA SPECIALTY ALUMINAS CURRENT AND FUTURE END USER ANALYSIS, 2025–2034, (USD MILLION)
FIGURE 49 COLUMBIA SPECIALTY ALUMINAS CURRENT AND FUTURE TYPE ANALYSIS, 2025–2034, (USD MILLION)
FIGURE 50 COLUMBIA SPECIALTY ALUMINAS CURRENT AND FUTURE END USER ANALYSIS, 2025–2034, (USD MILLION)
FIGURE 51 REST OF LATIN AMERICA SPECIALTY ALUMINAS CURRENT AND FUTURE TYPE ANALYSIS, 2025–2034, (USD MILLION)
FIGURE 52 REST OF LATIN AMERICA SPECIALTY ALUMINAS CURRENT AND FUTURE END USER ANALYSIS, 2025–2034, (USD MILLION)
FIGURE 53 EASTERN EUROPE SPECIALTY ALUMINAS CURRENT AND FUTURE MARKET VOLUME SHARE REGIONAL ANALYSIS, 2025–2034, (USD MILLION)
FIGURE 54 POLAND SPECIALTY ALUMINAS CURRENT AND FUTURE TYPE ANALYSIS, 2025–2034, (USD MILLION)
FIGURE 55 POLAND SPECIALTY ALUMINAS CURRENT AND FUTURE END USER ANALYSIS, 2025–2034, (USD MILLION)
FIGURE 56 RUSSIA SPECIALTY ALUMINAS CURRENT AND FUTURE TYPE ANALYSIS, 2025–2034, (USD MILLION)
FIGURE 57 RUSSIA SPECIALTY ALUMINAS CURRENT AND FUTURE END USER ANALYSIS, 2025–2034, (USD MILLION)
FIGURE 58 CZECH REPUBLIC SPECIALTY ALUMINAS CURRENT AND FUTURE TYPE ANALYSIS, 2025–2034, (USD MILLION)
FIGURE 59 CZECH REPUBLIC SPECIALTY ALUMINAS CURRENT AND FUTURE END USER ANALYSIS, 2025–2034, (USD MILLION)
FIGURE 60 ROMANIA SPECIALTY ALUMINAS CURRENT AND FUTURE TYPE ANALYSIS, 2025–2034, (USD MILLION)
FIGURE 61 ROMANIA SPECIALTY ALUMINAS CURRENT AND FUTURE END USER ANALYSIS, 2025–2034, (USD MILLION)
FIGURE 62 REST OF EASTERN EUROPE SPECIALTY ALUMINAS CURRENT AND FUTURE TYPE ANALYSIS, 2025–2034, (USD MILLION)
FIGURE 63 REST OF EASTERN EUROPE SPECIALTY ALUMINAS CURRENT AND FUTURE END USER ANALYSIS, 2025–2034, (USD MILLION)
FIGURE 64 WESTERN EUROPE SPECIALTY ALUMINAS CURRENT AND FUTURE MARKET VOLUME SHARE REGIONAL ANALYSIS, 2025–2034, (USD MILLION)
FIGURE 65 GERMANY SPECIALTY ALUMINAS CURRENT AND FUTURE TYPE ANALYSIS, 2025–2034, (USD MILLION)
FIGURE 66 GERMANY SPECIALTY ALUMINAS CURRENT AND FUTURE END USER ANALYSIS, 2025–2034, (USD MILLION)
FIGURE 67 FRANCE SPECIALTY ALUMINAS CURRENT AND FUTURE TYPE ANALYSIS, 2025–2034, (USD MILLION)
FIGURE 68 FRANCE SPECIALTY ALUMINAS CURRENT AND FUTURE END USER ANALYSIS, 2025–2034, (USD MILLION)
FIGURE 69 UK SPECIALTY ALUMINAS CURRENT AND FUTURE TYPE ANALYSIS, 2025–2034, (USD MILLION)
FIGURE 70 UK SPECIALTY ALUMINAS CURRENT AND FUTURE END USER ANALYSIS, 2025–2034, (USD MILLION)
FIGURE 71 SPAIN SPECIALTY ALUMINAS CURRENT AND FUTURE TYPE ANALYSIS, 2025–2034, (USD MILLION)
FIGURE 72 SPAIN SPECIALTY ALUMINAS CURRENT AND FUTURE END USER ANALYSIS, 2025–2034, (USD MILLION)
FIGURE 73 ITALY SPECIALTY ALUMINAS CURRENT AND FUTURE TYPE ANALYSIS, 2025–2034, (USD MILLION)
FIGURE 74 ITALY SPECIALTY ALUMINAS CURRENT AND FUTURE END USER ANALYSIS, 2025–2034, (USD MILLION)
FIGURE 75 REST OF WESTERN EUROPE SPECIALTY ALUMINAS CURRENT AND FUTURE TYPE ANALYSIS, 2025–2034, (USD MILLION)
FIGURE 76 REST OF WESTERN EUROPE SPECIALTY ALUMINAS CURRENT AND FUTURE END USER ANALYSIS, 2025–2034, (USD MILLION)
FIGURE 77 EAST ASIA AND PACIFIC SPECIALTY ALUMINAS CURRENT AND FUTURE MARKET VOLUME SHARE REGIONAL ANALYSIS, 2025–2034, (USD MILLION)
FIGURE 78 CHINA SPECIALTY ALUMINAS CURRENT AND FUTURE TYPE ANALYSIS, 2025–2034, (USD MILLION)
FIGURE 79 CHINA SPECIALTY ALUMINAS CURRENT AND FUTURE END USER ANALYSIS, 2025–2034, (USD MILLION)
FIGURE 80 JAPAN SPECIALTY ALUMINAS CURRENT AND FUTURE TYPE ANALYSIS, 2025–2034, (USD MILLION)
FIGURE 81 JAPAN SPECIALTY ALUMINAS CURRENT AND FUTURE END USER ANALYSIS, 2025–2034, (USD MILLION)
FIGURE 82 AUSTRALIA SPECIALTY ALUMINAS CURRENT AND FUTURE TYPE ANALYSIS, 2025–2034, (USD MILLION)
FIGURE 83 AUSTRALIA SPECIALTY ALUMINAS CURRENT AND FUTURE END USER ANALYSIS, 2025–2034, (USD MILLION)
FIGURE 84 CAMBODIA SPECIALTY ALUMINAS CURRENT AND FUTURE TYPE ANALYSIS, 2025–2034, (USD MILLION)
FIGURE 85 CAMBODIA SPECIALTY ALUMINAS CURRENT AND FUTURE END USER ANALYSIS, 2025–2034, (USD MILLION)
FIGURE 86 FIJI SPECIALTY ALUMINAS CURRENT AND FUTURE TYPE ANALYSIS, 2025–2034, (USD MILLION)
FIGURE 87 FIJI SPECIALTY ALUMINAS CURRENT AND FUTURE END USER ANALYSIS, 2025–2034, (USD MILLION)
FIGURE 88 INDONESIA SPECIALTY ALUMINAS CURRENT AND FUTURE TYPE ANALYSIS, 2025–2034, (USD MILLION)
FIGURE 89 INDONESIA SPECIALTY ALUMINAS CURRENT AND FUTURE END USER ANALYSIS, 2025–2034, (USD MILLION)
FIGURE 90 SOUTH KOREA SPECIALTY ALUMINAS CURRENT AND FUTURE TYPE ANALYSIS, 2025–2034, (USD MILLION)
FIGURE 91 SOUTH KOREA SPECIALTY ALUMINAS CURRENT AND FUTURE END USER ANALYSIS, 2025–2034, (USD MILLION)
FIGURE 92 REST OF EAST ASIA AND PACIFIC SPECIALTY ALUMINAS CURRENT AND FUTURE TYPE ANALYSIS, 2025–2034, (USD MILLION)
FIGURE 93 REST OF EAST ASIA AND PACIFIC SPECIALTY ALUMINAS CURRENT AND FUTURE END USER ANALYSIS, 2025–2034, (USD MILLION)
FIGURE 94 SEA AND SOUTH ASIA SPECIALTY ALUMINAS CURRENT AND FUTURE MARKET VOLUME SHARE REGIONAL ANALYSIS, 2025–2034, (USD MILLION)
FIGURE 95 BANGLADESH SPECIALTY ALUMINAS CURRENT AND FUTURE TYPE ANALYSIS, 2025–2034, (USD MILLION)
FIGURE 96 BANGLADESH SPECIALTY ALUMINAS CURRENT AND FUTURE END USER ANALYSIS, 2025–2034, (USD MILLION)
FIGURE 97 NEW ZEALAND SPECIALTY ALUMINAS CURRENT AND FUTURE TYPE ANALYSIS, 2025–2034, (USD MILLION)
FIGURE 98 NEW ZEALAND SPECIALTY ALUMINAS CURRENT AND FUTURE END USER ANALYSIS, 2025–2034, (USD MILLION)
FIGURE 99 INDIA SPECIALTY ALUMINAS CURRENT AND FUTURE TYPE ANALYSIS, 2025–2034, (USD MILLION)
FIGURE 100 INDIA SPECIALTY ALUMINAS CURRENT AND FUTURE END USER ANALYSIS, 2025–2034, (USD MILLION)
FIGURE 101 SINGAPORE SPECIALTY ALUMINAS CURRENT AND FUTURE TYPE ANALYSIS, 2025–2034, (USD MILLION)
FIGURE 102 SINGAPORE SPECIALTY ALUMINAS CURRENT AND FUTURE END USER ANALYSIS, 2025–2034, (USD MILLION)
FIGURE 103 THAILAND SPECIALTY ALUMINAS CURRENT AND FUTURE TYPE ANALYSIS, 2025–2034, (USD MILLION)
FIGURE 104 THAILAND SPECIALTY ALUMINAS CURRENT AND FUTURE END USER ANALYSIS, 2025–2034, (USD MILLION)
FIGURE 105 TAIWAN SPECIALTY ALUMINAS CURRENT AND FUTURE TYPE ANALYSIS, 2025–2034, (USD MILLION)
FIGURE 106 TAIWAN SPECIALTY ALUMINAS CURRENT AND FUTURE END USER ANALYSIS, 2025–2034, (USD MILLION)
FIGURE 107 MALAYSIA SPECIALTY ALUMINAS CURRENT AND FUTURE TYPE ANALYSIS, 2025–2034, (USD MILLION)
FIGURE 108 MALAYSIA SPECIALTY ALUMINAS CURRENT AND FUTURE END USER ANALYSIS, 2025–2034, (USD MILLION)
FIGURE 109 REST OF SEA AND SOUTH ASIA SPECIALTY ALUMINAS CURRENT AND FUTURE TYPE ANALYSIS, 2025–2034, (USD MILLION)
FIGURE 110 REST OF SEA AND SOUTH ASIA SPECIALTY ALUMINAS CURRENT AND FUTURE END USER ANALYSIS, 2025–2034, (USD MILLION)
FIGURE 111 MIDDLE EAST AND AFRICA SPECIALTY ALUMINAS CURRENT AND FUTURE MARKET VOLUME SHARE REGIONAL ANALYSIS, 2025–2034, (USD MILLION)
FIGURE 112 GCC COUNTRIES SPECIALTY ALUMINAS CURRENT AND FUTURE TYPE ANALYSIS, 2025–2034, (USD MILLION)
FIGURE 113 GCC COUNTRIES SPECIALTY ALUMINAS CURRENT AND FUTURE END USER ANALYSIS, 2025–2034, (USD MILLION)
FIGURE 114 SAUDI ARABIA SPECIALTY ALUMINAS CURRENT AND FUTURE TYPE ANALYSIS, 2025–2034, (USD MILLION)
FIGURE 115 SAUDI ARABIA SPECIALTY ALUMINAS CURRENT AND FUTURE END USER ANALYSIS, 2025–2034, (USD MILLION)
FIGURE 116 UAE SPECIALTY ALUMINAS CURRENT AND FUTURE TYPE ANALYSIS, 2025–2034, (USD MILLION)
FIGURE 117 UAE SPECIALTY ALUMINAS CURRENT AND FUTURE END USER ANALYSIS, 2025–2034, (USD MILLION)
FIGURE 118 BAHRAIN SPECIALTY ALUMINAS CURRENT AND FUTURE TYPE ANALYSIS, 2025–2034, (USD MILLION)
FIGURE 119 BAHRAIN SPECIALTY ALUMINAS CURRENT AND FUTURE END USER ANALYSIS, 2025–2034, (USD MILLION)
FIGURE 120 KUWAIT SPECIALTY ALUMINAS CURRENT AND FUTURE TYPE ANALYSIS, 2025–2034, (USD MILLION)
FIGURE 121 KUWAIT SPECIALTY ALUMINAS CURRENT AND FUTURE END USER ANALYSIS, 2025–2034, (USD MILLION)
FIGURE 122 OMAN SPECIALTY ALUMINAS CURRENT AND FUTURE TYPE ANALYSIS, 2025–2034, (USD MILLION)
FIGURE 123 OMAN SPECIALTY ALUMINAS CURRENT AND FUTURE END USER ANALYSIS, 2025–2034, (USD MILLION)
FIGURE 124 QATAR SPECIALTY ALUMINAS CURRENT AND FUTURE TYPE ANALYSIS, 2025–2034, (USD MILLION)
FIGURE 125 QATAR SPECIALTY ALUMINAS CURRENT AND FUTURE END USER ANALYSIS, 2025–2034, (USD MILLION)
FIGURE 126 EGYPT SPECIALTY ALUMINAS CURRENT AND FUTURE TYPE ANALYSIS, 2025–2034, (USD MILLION)
FIGURE 127 EGYPT SPECIALTY ALUMINAS CURRENT AND FUTURE END USER ANALYSIS, 2025–2034, (USD MILLION)
FIGURE 128 NIGERIA SPECIALTY ALUMINAS CURRENT AND FUTURE TYPE ANALYSIS, 2025–2034, (USD MILLION)
FIGURE 129 NIGERIA SPECIALTY ALUMINAS CURRENT AND FUTURE END USER ANALYSIS, 2025–2034, (USD MILLION)
FIGURE 130 SOUTH AFRICA SPECIALTY ALUMINAS CURRENT AND FUTURE TYPE ANALYSIS, 2025–2034, (USD MILLION)
FIGURE 131 SOUTH AFRICA SPECIALTY ALUMINAS CURRENT AND FUTURE END USER ANALYSIS, 2025–2034, (USD MILLION)
FIGURE 132 ISRAEL SPECIALTY ALUMINAS CURRENT AND FUTURE TYPE ANALYSIS, 2025–2034, (USD MILLION)
FIGURE 133 ISRAEL SPECIALTY ALUMINAS CURRENT AND FUTURE END USER ANALYSIS, 2025–2034, (USD MILLION)
FIGURE 134 REST OF MEA SPECIALTY ALUMINAS CURRENT AND FUTURE TYPE ANALYSIS, 2025–2034, (USD MILLION)
FIGURE 135 REST OF MEA SPECIALTY ALUMINAS CURRENT AND FUTURE END USER ANALYSIS, 2025–2034, (USD MILLION)
FIGURE 136 U. S. MARKET SHARE ANALYSIS BY TYPE (2024)
FIGURE 137 U. S. MARKET SHARE ANALYSIS BY END USER (2024)
FIGURE 138 CANADA MARKET SHARE ANALYSIS BY TYPE (2024)
FIGURE 139 CANADA MARKET SHARE ANALYSIS BY END USER (2024)
FIGURE 140 MEXICO MARKET SHARE ANALYSIS BY TYPE (2024)
FIGURE 141 MEXICO MARKET SHARE ANALYSIS BY END USER (2024)
FIGURE 142 CHINA MARKET SHARE ANALYSIS BY TYPE (2024)
FIGURE 143 CHINA MARKET SHARE ANALYSIS BY END USER (2024)
FIGURE 144 JAPAN MARKET SHARE ANALYSIS BY TYPE (2024)
FIGURE 145 JAPAN MARKET SHARE ANALYSIS BY END USER (2024)
FIGURE 146 INDIA MARKET SHARE ANALYSIS BY TYPE (2024)
FIGURE 147 INDIA MARKET SHARE ANALYSIS BY END USER (2024)
FIGURE 148 SOUTH KOREA MARKET SHARE ANALYSIS BY TYPE (2024)
FIGURE 149 SOUTH KOREA MARKET SHARE ANALYSIS BY END USER (2024)
FIGURE 150 SAUDI ARABIA MARKET SHARE ANALYSIS BY TYPE (2024)
FIGURE 151 SAUDI ARABIA MARKET SHARE ANALYSIS BY END USER (2024)
FIGURE 152 UAE MARKET SHARE ANALYSIS BY TYPE (2024)
FIGURE 153 UAE MARKET SHARE ANALYSIS BY END USER (2024)
FIGURE 154 EGYPT MARKET SHARE ANALYSIS BY TYPE (2024)
FIGURE 155 EGYPT MARKET SHARE ANALYSIS BY END USER (2024)
FIGURE 156 NIGERIA MARKET SHARE ANALYSIS BY TYPE (2024)
FIGURE 157 NIGERIA MARKET SHARE ANALYSIS BY END USER (2024)
FIGURE 158 SOUTH AFRICA MARKET SHARE ANALYSIS BY TYPE (2024)
FIGURE 159 SOUTH AFRICA MARKET SHARE ANALYSIS BY END USER (2024)
FIGURE 160 GERMANY MARKET SHARE ANALYSIS BY TYPE (2024)
FIGURE 161 GERMANY MARKET SHARE ANALYSIS BY END USER (2024)
FIGURE 162 FRANCE MARKET SHARE ANALYSIS BY TYPE (2024)
FIGURE 163 FRANCE MARKET SHARE ANALYSIS BY END USER (2024)
FIGURE 164 UK MARKET SHARE ANALYSIS BY TYPE (2024)
FIGURE 165 UK MARKET SHARE ANALYSIS BY END USER (2024)
FIGURE 166 SPAIN MARKET SHARE ANALYSIS BY TYPE (2024)
FIGURE 167 SPAIN MARKET SHARE ANALYSIS BY END USER (2024)
FIGURE 168 ITALY MARKET SHARE ANALYSIS BY TYPE (2024)
FIGURE 169 ITALY MARKET SHARE ANALYSIS BY END USER (2024)
FIGURE 170 BRAZIL MARKET SHARE ANALYSIS BY TYPE (2024)
FIGURE 171 BRAZIL MARKET SHARE ANALYSIS BY END USER (2024)
FIGURE 172 ARGENTINA MARKET SHARE ANALYSIS BY TYPE (2024)
FIGURE 173 ARGENTINA MARKET SHARE ANALYSIS BY END USER (2024)
FIGURE 174 COLUMBIA MARKET SHARE ANALYSIS BY TYPE (2024)
FIGURE 175 COLUMBIA MARKET SHARE ANALYSIS BY END USER (2024)
FIGURE 176 GLOBAL SPECIALTY ALUMINAS CURRENT AND FUTURE MARKET KEY COUNTRY LEVEL ANALYSIS, 2024–2034, (USD MILLION)
FIGURE 177 FINANCIAL OVERVIEW:
Key Players Analysis:
Almatis: Almatis is a global leader in the specialty aluminas market, offering a comprehensive range of high-performance products including calcined, reactive, and tabular aluminas. With production facilities across North America, Europe, and Asia, Almatis serves critical sectors like refractories, ceramics, and polishing. Its longstanding expertise, advanced R&D, and customer-focused solutions have solidified its position as a dominant player in high-value alumina solutions, making it one of the most influential names in this industry.
Hindalco (Aditya Birla Group): Hindalco is a major player in the aluminum industry, with a strong presence in the specialty aluminas market through its subsidiary, Aditya Birla Chemicals. It produces a variety of grades including reactive, calcined, and high-purity aluminas, primarily for ceramics, refractories, and polishing. Its integrated value chain, large-scale production, and focus on innovation help position Hindalco as a significant global supplier in specialty aluminas, especially across Asian and Middle Eastern markets.
Alteo Alumina: Alteo is a leading European producer focused exclusively on specialty aluminas. Headquartered in France, the company offers a wide array of high-purity and functional aluminas tailored for ceramics, catalysts, and refractories. Alteo is recognized for its innovation in eco-friendly production and sustainable practices, setting industry benchmarks in purity and performance. Its specialization and commitment to technical excellence position it as a global giant in high-end specialty alumina segments.
Huber Engineered Materials: Huber Engineered Materials is a prominent North American producer, especially dominant in the aluminum trihydroxide (ATH) segment used in flame retardants and engineered thermoplastics. The company’s strength lies in its broad product range, reliable supply, and R&D-driven development of non-halogenated solutions. With operations tailored to both industrial and consumer markets, Huber plays a crucial role in the specialty aluminas market, making it a top-tier supplier in functional filler applications.
Market Key Players
Almatis
AluChem
Hindalco
Alteo Alumina
Traxys S.à.r.l.
Axens Group
Huber Engineered Materials
Carborundum Universal Limited
Imerys Fused Minerals Villach GmbH
Nabaltec AG
Silkem d.o.o.
NICHE Fused Alumina
MOTIM Electrocorundum Ltd.
Sasol Germany GmbH
Resonac
Driver:
Rising Demand from Refractory and Ceramic Industries
The global increase in steel and glass production, especially in emerging economies, has led to a significant rise in demand for refractory materials. Specialty aluminas, due to their high thermal stability and resistance to chemical wear, are extensively used in refractory applications, making them essential in high-temperature industrial processes. This directly fuels market growth, as industries prioritize reliable, high-performance materials to boost manufacturing efficiency and reduce maintenance downtime.
Expansion of High-Tech Applications
Specialty aluminas are gaining traction in advanced ceramics, electronics, and lithium-ion battery separators. The growth of electric vehicles, renewable energy systems, and digital infrastructure has increased the need for high-purity aluminas due to their electrical insulation, thermal conductivity, and chemical stability. These attributes are pushing manufacturers to invest more in innovative formulations and ultra-pure grades, accelerating the overall market expansion
Restrain:
High Production and Processing Costs
The production of specialty aluminas involves complex refining and calcination processes, which require high energy consumption and precision control. This increases operational costs significantly, especially for high-purity or custom-grade aluminas. The need for expensive infrastructure, skilled labor, and compliance with environmental standards further adds to the financial burden, limiting accessibility for smaller manufacturers and impacting profit margins.
Environmental and Regulatory Challenges
Stringent environmental regulations concerning emissions and waste management during alumina production present a major challenge. The alumina refining process produces red mud and greenhouse gases, drawing scrutiny from environmental agencies. Companies must invest in sustainable technologies and pollution control mechanisms, which increases costs and compliance efforts. These regulatory pressures may delay expansion plans or discourage new entrants from investing in the market.
Opportunities:
Shift Toward Flame Retardant and Eco-Friendly Materials
Growing awareness of fire safety and sustainability is increasing demand for non-halogenated flame retardants, particularly aluminum trihydroxide (ATH). Specialty aluminas offer an ideal eco-friendly solution across applications such as electronics, building materials, and automotive interiors. This trend is opening up substantial opportunities for manufacturers to develop safer, environmentally compliant materials that meet evolving consumer and regulatory expectations.
Emerging Applications in Energy and Electronics
The evolution of renewable energy technologies and advanced electronics—like 5G, EVs, and semiconductors—creates new avenues for specialty aluminas. Boehmite and activated aluminas are increasingly used in battery components, catalyst supports, and electronic substrates. As these sectors continue to grow, the demand for functional materials with superior thermal, dielectric, and chemical properties will boost the specialty aluminas market significantly.
Trends:
Technological Innovation in High-Purity Aluminas
Manufacturers are increasingly investing in R&D to create ultra-high-purity aluminas for use in semiconductors, LED phosphors, and precision ceramics. The miniaturization of electronic components and growing performance requirements drive the need for materials with superior particle size control, purity, and consistency. This trend is steering the market toward value-added, niche applications, offering higher profitability and competitive differentiation.
Circular Economy and Sustainability Focus
There is a rising trend toward sustainable production and recycling in alumina processing. Companies are adopting greener technologies like low-carbon calcination, red mud recycling, and renewable energy integration in manufacturing. This shift is not only helping firms meet ESG goals and regulatory benchmarks but also attracting environmentally conscious customers, shaping future investment strategies and product development across the industry.
Recent Development:
In 2024 - Hindalco introduced FUSALOX™, its White Fused Alumina. The product was prominently showcased at IREFCON 2024 (International Refractories Conference), held in November 2024. FUSALOX™ is developed through a high-temperature fusion process and is targeted at advanced refractory and abrasive applications. At the event, Hindalco highlighted FUSALOX™ as its latest innovation in the specialty alumina portfolio, emphasizing its role in sustainable and high-performance refractory solutions.
In August 2024 - Vibrantz Technologies announced the acquisition of Micro Abrasives Corporation, a specialty alumina manufacturer based in Westfield, Massachusetts. Micro Abrasives is recognized as a leading U.S. producer of calcined alumina, which is widely used in automotive refinishing, optics polishing, and industrial lapping markets. Their products play a crucial role in the formulation of liquid abrasives for automotive polishes, precision powders and slurries for the optics and photonics industries, and wafers for semiconductor manufacturing. The company operates two facilities in Westfield, Massachusetts, and Alexandria, Louisiana, employing around 50 people. This acquisition strengthens Vibrantz’s advanced materials portfolio and broadens its reach in high-growth sectors such as semiconductors, automotive, and optics.