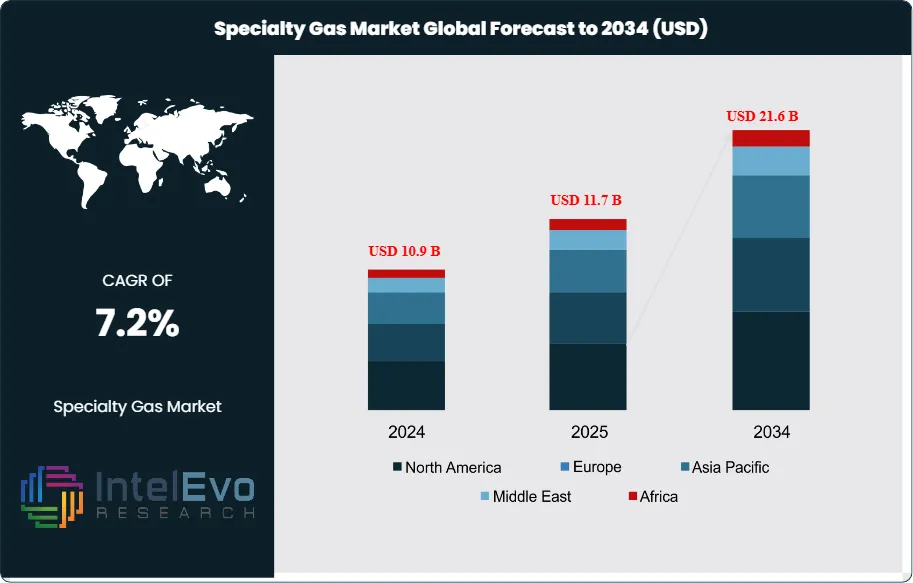
The Specialty Gas Market size is projected to reach USD 21.6 billion by 2034, up from USD 10.9 billion in 2024, growing at a CAGR of 7.2% during the forecast period from 2025 to 2034. Driven by rising demand across semiconductors, healthcare, renewable energy, and manufacturing industries, the market is witnessing strong expansion worldwide. Continuous advancements in gas purification and handling technologies are also propelling market innovation. As industries prioritize high-purity and eco-efficient gases, the specialty gas market is set to play a crucial role in shaping next-generation industrial ecosystems.
Specialty gas refers to a category of gases that are produced with high levels of purity and are often tailored for specific applications requiring precise composition and consistency. Unlike bulk industrial gases, specialty gases are typically used in smaller quantities and are essential in industries such as healthcare, electronics, environmental monitoring, and scientific research. These gases may be either pure (like high-purity helium or nitrogen) or custom gas mixtures designed to meet exact specifications for tasks like instrument calibration, semiconductor manufacturing, or medical diagnostics. Due to their critical role in highly sensitive processes, specialty gases must adhere to stringent quality and regulatory standards, ensuring reliability and accuracy in their respective applications.
The specialty gas market is witnessing strong and sustained growth, driven by technological advancements, industrial expansion, and the rising demand for high-purity gases across multiple sectors. Specialty gases, which include rare gases, high-purity gases, and gas mixtures, are critical in applications that require precision, safety, and purity, such as electronics, healthcare, energy, and environmental monitoring.
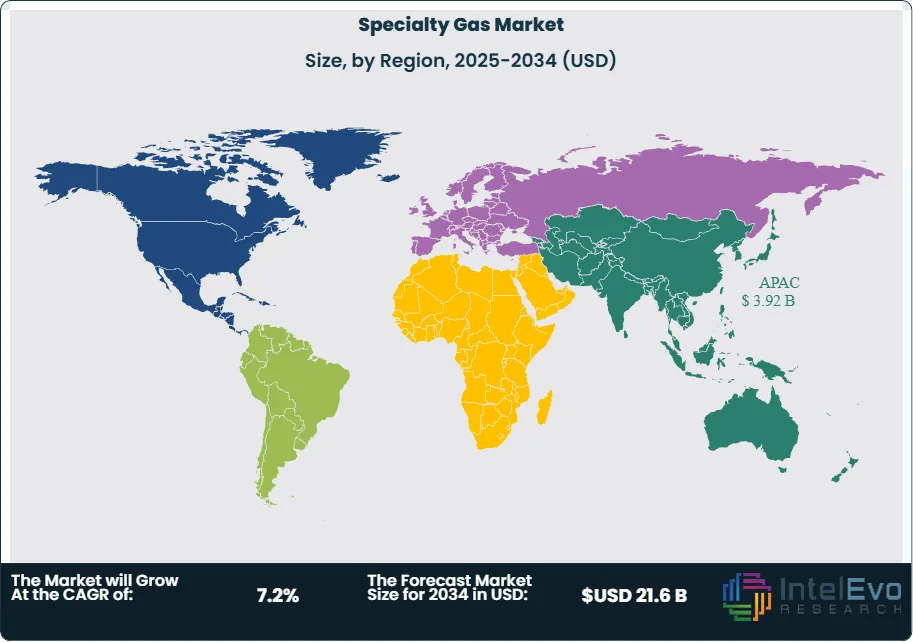
Asia Pacific's specialty gas market is growing rapidly, led by strong demand from electronics, healthcare, and industrial sectors. Countries like China and South Korea use specialty gases extensively in semiconductor and display manufacturing. Additionally, India's expanding healthcare infrastructure and Japan's focus on clean energy and environmental monitoring contribute to increased usage. Government support, technological advancements, and rising industrialization make Asia Pacific the largest and fastest-growing regional market for specialty gases.
The COVID-19 pandemic had a mixed impact on the specialty gas market. Initially, global lockdowns disrupted supply chains and reduced industrial demand, particularly in automotive and manufacturing sectors. However, the healthcare segment saw a surge in demand for medical-grade gases like oxygen and nitrous oxide, used in ventilators and critical care. Additionally, the pharmaceutical industry ramped up production and research activities, boosting the use of high-purity gases. As economies recovered, the demand rebounded across sectors, driving growth in electronics, healthcare, and environmental monitoring, solidifying the role of specialty gases in essential applications.
Key Takeaways:
Market Growth: The specialty gas market is expected to reach USD 21.6 billion by 2034, growing at a robust CAGR of 7.2%, indicating strong market expansion.
Product Segment Dominance: The product segment is dominated by ultra-high purity gases, accounting for over 27% of the market share. Specialty gases are crucial in industries like semiconductors and pharmaceuticals, where ultra-high purity is essential. In semiconductor manufacturing, these gases are used for processes like etching, deposition, and wafer cleaning, ensuring electronic components remain free from contamination. In pharmaceuticals, they maintain sterile environments during drug production, ensuring the quality and efficacy of medicines. The demand for these high-purity gases is driven by the need for contamination-free environments to uphold the highest standards of quality, safety, and efficiency in both industries.
End-user Segment Insights: Electronics and semiconductors is anticipated to hold the largest market share. The semiconductor sector relies on ultra-high purity specialty gases for key processes such as etching, deposition, and lithography. These processes require precise control to ensure the production of high-quality, reliable electronic components. The need for contamination-free gases highlights the critical importance of specialty gases in achieving the required standards for semiconductor manufacturing.
Driver: Rising demand from the electronics and semiconductor industry is driving the specialty gas market, as these gases are vital for chip manufacturing and advanced electronic applications.
Restraint: The specialty gas market faces restraints due to high production and handling costs, stringent regulatory compliance for storage and transportation, and a lack of skilled professionals to handle specialized gas systems. These factors contribute to increased costs and operational challenges, limiting market growth, especially in emerging regions.
Opportunity: The specialty gas market is poised for growth, particularly in the healthcare sector. With an aging population and improved healthcare services globally, the demand for medical gases like oxygen, nitrous oxide, and carbon dioxide is increasing. These gases are vital for patient care, anesthesia, and sterilization, driving growth due to more surgical procedures, emergency care, and home healthcare services.
Trend: A key trend in the specialty gas market is the growing integration of digital technologies into gas management and distribution. With industries aiming for higher efficiency and precision, the use of advanced digital solutions is increasing. The adoption of Internet of Things (IoT) technology in specialty gas cylinders allows for real-time tracking of gas levels, usage, and location. This technology enhances operational efficiency and safety by providing accurate data on gas conditions, detecting irregularities such as leaks, and alerting managers to potential issues.
Regional Analysis: Asia Pacific dominates the specialty gas market due to rapid industrial growth, especially in electronics, healthcare, and manufacturing. Countries like China, Japan, South Korea, and India lead in demand, driven by semiconductor production, medical advancements, and environmental monitoring. Rising investments, stringent regulations, and expanding industrial applications continue to propel market growth across the region.
Product Analysis:
The product segment is divided into noble gases, halogen gases, ultra-high purity gases, carbon gases, and others. The ultra-high purity gases segment dominated the market, with a market share of around 27% accounting for 2.8 billion 2024. Specialty gases are indispensable in industries like semiconductors and pharmaceuticals, where ultra-high purity is paramount. In semiconductor manufacturing, these gases are used in processes such as etching, deposition, and cleaning of silicon wafers. Even the smallest contamination can significantly impact the performance and reliability of electronic components. Similarly, in the pharmaceutical sector, these gases are employed in the production of drugs, ensuring that the environment remains sterile and free from any contaminants that could affect the quality and efficacy of medicines. The demand for these high-purity gases is driven by the need for contamination-free environments that are crucial to both industries. The precision required in manufacturing and drug formulation makes the use of these gases essential in maintaining the highest standards of quality, safety, and efficiency.
End-user Analysis:
The end-user segment is divided into healthcare, manufacturing, chemicals, electronics and semiconductors, automotive, food and beverage, and others. The electronics and semiconductors segment dominated the market, with a market share of around 20% accounting for 2.0 billion 2024. The semiconductor industry depends heavily on ultra-high purity (UHP) gases to ensure precision and quality in the manufacturing of integrated circuits and electronic components. These gases are crucial in processes such as etching, deposition, and lithography, which require extremely high purity to prevent contamination and maintain the integrity of the semiconductor wafers. In etching, gases like chlorine and hydrogen chloride are used to carve intricate patterns on the wafer, and any impurities can compromise the process. Similarly, in deposition, gases like silane are used to deposit thin layers of materials onto the wafer, where purity is essential to avoid defects. Lithography, which involves printing circuit patterns on the water's surface, also relies on ultra-pure gases like ozone and nitrogen to maintain optimal conditions. Even the smallest impurity can result in defects, affecting the quality and functionality of the final product. As semiconductor technologies advance, requiring smaller chips and more complex circuits, the demand for even higher purity gases has increased. With growing applications in fields like artificial intelligence, 5G, and autonomous vehicles, the need for precision and high-performance semiconductors continues to drive the requirement for ultra-pure specialty gases in the industry.
Region Analysis:
Asia-Pacific Leads With 36% Market Share in the Specialty Gas Market, Asia Pacific holds a dominant position in the global specialty gas market, driven by rapid industrialization, robust electronics manufacturing, and expanding healthcare infrastructure. Countries like China, Japan, South Korea, and India are at the forefront of this growth due to their strong presence in semiconductor production, pharmaceutical research, and environmental monitoring. China is the largest consumer and producer of specialty gases in the region, fueled by its massive electronics and automotive industries. Similarly, Japan and South Korea are key players in advanced technology and semiconductor manufacturing, both of which rely heavily on high-purity gases for processes like etching and deposition. India’s growing industrial base and investment in healthcare facilities have also increased the demand for medical and industrial specialty gases. Moreover, the region is witnessing rising awareness and regulatory pressure related to emissions and environmental safety, prompting greater adoption of calibration and specialty gases for monitoring and compliance.
By Type (High-Purity Gases, Noble Gases (Helium, Argon, Neon, Krypton, Xenon), Carbon Gases (Carbon Dioxide, Carbon Monoxide), Halogen Gases (Chlorine, Fluorine), Specialty Acetylene and Hydrogen, Other Specialty Gases), By End User (Manufacturing Industries, Laboratories & Research Institutions, Hospitals & Healthcare Facilities, Energy Companies, Electronics Manufacturers), By Distribution Channel (Direct Sales, Distributors and Dealers, Online Platforms), By Application (Electronics & Semiconductors, Healthcare & Biotechnology, Chemicals & Petrochemicals, Automotive & Aerospace, Food & Beverages, Energy & Power, Others (Metallurgy, Environmental Testing))
Research Methodology
Primary Research- 100 Interviews of Stakeholders
Secondary Research
Desk Research
Regional scope
North America (United States, Canada, Mexico)
Latin America (Brazil, Argentina, Columbia)
East Asia And Pacific (China, Japan, South Korea, Australia, Cambodia, Fiji, Indonesia)
Sea And South Asia (India, Singapore, Thailand, Taiwan, Malaysia)
Eastern Europe (Poland, Russia, Czech Republic, Romania)
Western Europe (Germany, U.K., France, Spain, Itlay)
Middle East & Africa (GCC Countries, Egypt, Nigeria, South Africa, Israel)
Competitive Landscape
Air Products and Chemicals Inc., ILMO Products Company, Linde plc, Messer Group GmbH, Norco Inc., Taiyo Nippon Sanso Corporation, YUEYANG KAIMEITE ELECTRONIC AND SPECIALTY RARE GASES CO., Air Liquide, Coregas, Iwatani Corporation of America, MESA Specialty Gases & Equipment, Mitsui Chemicals Inc., Showa Denko K.K., Weldstar, Airgas Inc.
Customization Scope
Customization for segments, region/country-level will be provided. Moreover, additional customization can be done based on the requirements.
Pricing and Purchase Options
Avail customized purchase options to meet your exact research needs. We have three licenses to opt for: Single User License, Multi-User License (Up to 5 Users), Corporate Use License (Unlimited User and Printable PDF).
TABLE OF CONTENTS
1. EXECUTIVE SUMMARY
1.1. MARKET SNAPSHOT
1.2. KEY FINDINGS & INSIGHTS
1.3. ANALYST RECOMMENDATIONS
1.4. FUTURE OUTLOOK
2. RESEARCH METHODOLOGY
2.1. MARKET DEFINITION & SCOPE
2.2. RESEARCH OBJECTIVES: PRIMARY & SECONDARY DATA SOURCES
2.3. DATA COLLECTION SOURCES
2.3.1. COVERAGE OF 100+ PRIMARY RESEARCH/CONSULTATION CALLS WITH INDUSTRY STAKEHOLDERS
FIGURE 17 NORTH AMERICA SPECIALTY GAS CURRENT AND FUTURE TYPE ANALYSIS, 2025–2034, (USD MILLION)
FIGURE 18 NORTH AMERICA SPECIALTY GAS CURRENT AND FUTURE END USER ANALYSIS, 2025–2034, (USD MILLION)
FIGURE 19 MARKET SHARE BY COUNTRY
FIGURE 20 LATIN AMERICA SPECIALTY GAS CURRENT AND FUTURE TYPE ANALYSIS, 2025–2034, (USD MILLION)
FIGURE 21 LATIN AMERICA SPECIALTY GAS CURRENT AND FUTURE END USER ANALYSIS, 2025–2034, (USD MILLION)
FIGURE 22 MARKET SHARE BY COUNTRY
FIGURE 23 EASTERN EUROPE SPECIALTY GAS CURRENT AND FUTURE TYPE ANALYSIS, 2025–2034, (USD MILLION)
FIGURE 24 EASTERN EUROPE SPECIALTY GAS CURRENT AND FUTURE END USER ANALYSIS, 2025–2034, (USD MILLION)
FIGURE 25 MARKET SHARE BY COUNTRY
FIGURE 26 WESTERN EUROPE SPECIALTY GAS CURRENT AND FUTURE TYPE ANALYSIS, 2025–2034, (USD MILLION)
FIGURE 27 WESTERN EUROPE SPECIALTY GAS CURRENT AND FUTURE END USER ANALYSIS, 2025–2034, (USD MILLION)
FIGURE 28 MARKET SHARE BY COUNTRY
FIGURE 29 EAST ASIA AND PACIFIC SPECIALTY GAS CURRENT AND FUTURE TYPE ANALYSIS, 2025–2034, (USD MILLION)
FIGURE 30 EAST ASIA AND PACIFIC SPECIALTY GAS CURRENT AND FUTURE END USER ANALYSIS, 2025–2034, (USD MILLION)
FIGURE 31 MARKET SHARE BY COUNTRY
FIGURE 32 SEA AND SOUTH ASIA SPECIALTY GAS CURRENT AND FUTURE TYPE ANALYSIS, 2025–2034, (USD MILLION)
FIGURE 33 SEA AND SOUTH ASIA SPECIALTY GAS CURRENT AND FUTURE END USER ANALYSIS, 2025–2034, (USD MILLION)
FIGURE 34 MARKET SHARE BY COUNTRY
FIGURE 35 MIDDLE EAST AND AFRICA SPECIALTY GAS CURRENT AND FUTURE TYPE ANALYSIS, 2025–2034, (USD MILLION)
FIGURE 36 MIDDLE EAST AND AFRICA SPECIALTY GAS CURRENT AND FUTURE END USER ANALYSIS, 2025–2034, (USD MILLION)
FIGURE 37 NORTH AMERICA SPECIALTY GAS CURRENT AND FUTURE MARKET VOLUME SHARE REGIONAL ANALYSIS, 2025–2034, (USD MILLION)
FIGURE 38 U.S. SPECIALTY GAS CURRENT AND FUTURE TYPE ANALYSIS, 2025–2034, (USD MILLION)
FIGURE 39 U.S. SPECIALTY GAS CURRENT AND FUTURE END USER ANALYSIS, 2025–2034, (USD MILLION)
FIGURE 40 CANADA SPECIALTY GAS CURRENT AND FUTURE TYPE ANALYSIS, 2025–2034, (USD MILLION)
FIGURE 41 CANADA SPECIALTY GAS CURRENT AND FUTURE END USER ANALYSIS, 2025–2034, (USD MILLION)
FIGURE 42 LATIN AMERICA SPECIALTY GAS CURRENT AND FUTURE MARKET VOLUME SHARE REGIONAL ANALYSIS, 2025–2034, (USD MILLION)
FIGURE 43 MEXICO SPECIALTY GAS CURRENT AND FUTURE TYPE ANALYSIS, 2025–2034, (USD MILLION)
FIGURE 44 MEXICO SPECIALTY GAS CURRENT AND FUTURE END USER ANALYSIS, 2025–2034, (USD MILLION)
FIGURE 45 BRAZIL SPECIALTY GAS CURRENT AND FUTURE TYPE ANALYSIS, 2025–2034, (USD MILLION)
FIGURE 46 BRAZIL SPECIALTY GAS CURRENT AND FUTURE END USER ANALYSIS, 2025–2034, (USD MILLION)
FIGURE 47 ARGENTINA SPECIALTY GAS CURRENT AND FUTURE TYPE ANALYSIS, 2025–2034, (USD MILLION)
FIGURE 48 ARGENTINA SPECIALTY GAS CURRENT AND FUTURE END USER ANALYSIS, 2025–2034, (USD MILLION)
FIGURE 49 COLUMBIA SPECIALTY GAS CURRENT AND FUTURE TYPE ANALYSIS, 2025–2034, (USD MILLION)
FIGURE 50 COLUMBIA SPECIALTY GAS CURRENT AND FUTURE END USER ANALYSIS, 2025–2034, (USD MILLION)
FIGURE 51 REST OF LATIN AMERICA SPECIALTY GAS CURRENT AND FUTURE TYPE ANALYSIS, 2025–2034, (USD MILLION)
FIGURE 52 REST OF LATIN AMERICA SPECIALTY GAS CURRENT AND FUTURE END USER ANALYSIS, 2025–2034, (USD MILLION)
FIGURE 53 EASTERN EUROPE SPECIALTY GAS CURRENT AND FUTURE MARKET VOLUME SHARE REGIONAL ANALYSIS, 2025–2034, (USD MILLION)
FIGURE 54 POLAND SPECIALTY GAS CURRENT AND FUTURE TYPE ANALYSIS, 2025–2034, (USD MILLION)
FIGURE 55 POLAND SPECIALTY GAS CURRENT AND FUTURE END USER ANALYSIS, 2025–2034, (USD MILLION)
FIGURE 56 RUSSIA SPECIALTY GAS CURRENT AND FUTURE TYPE ANALYSIS, 2025–2034, (USD MILLION)
FIGURE 57 RUSSIA SPECIALTY GAS CURRENT AND FUTURE END USER ANALYSIS, 2025–2034, (USD MILLION)
FIGURE 58 CZECH REPUBLIC SPECIALTY GAS CURRENT AND FUTURE TYPE ANALYSIS, 2025–2034, (USD MILLION)
FIGURE 59 CZECH REPUBLIC SPECIALTY GAS CURRENT AND FUTURE END USER ANALYSIS, 2025–2034, (USD MILLION)
FIGURE 60 ROMANIA SPECIALTY GAS CURRENT AND FUTURE TYPE ANALYSIS, 2025–2034, (USD MILLION)
FIGURE 61 ROMANIA SPECIALTY GAS CURRENT AND FUTURE END USER ANALYSIS, 2025–2034, (USD MILLION)
FIGURE 62 REST OF EASTERN EUROPE SPECIALTY GAS CURRENT AND FUTURE TYPE ANALYSIS, 2025–2034, (USD MILLION)
FIGURE 63 REST OF EASTERN EUROPE SPECIALTY GAS CURRENT AND FUTURE END USER ANALYSIS, 2025–2034, (USD MILLION)
FIGURE 64 WESTERN EUROPE SPECIALTY GAS CURRENT AND FUTURE MARKET VOLUME SHARE REGIONAL ANALYSIS, 2025–2034, (USD MILLION)
FIGURE 65 GERMANY SPECIALTY GAS CURRENT AND FUTURE TYPE ANALYSIS, 2025–2034, (USD MILLION)
FIGURE 66 GERMANY SPECIALTY GAS CURRENT AND FUTURE END USER ANALYSIS, 2025–2034, (USD MILLION)
FIGURE 67 FRANCE SPECIALTY GAS CURRENT AND FUTURE TYPE ANALYSIS, 2025–2034, (USD MILLION)
FIGURE 68 FRANCE SPECIALTY GAS CURRENT AND FUTURE END USER ANALYSIS, 2025–2034, (USD MILLION)
FIGURE 69 UK SPECIALTY GAS CURRENT AND FUTURE TYPE ANALYSIS, 2025–2034, (USD MILLION)
FIGURE 70 UK SPECIALTY GAS CURRENT AND FUTURE END USER ANALYSIS, 2025–2034, (USD MILLION)
FIGURE 71 SPAIN SPECIALTY GAS CURRENT AND FUTURE TYPE ANALYSIS, 2025–2034, (USD MILLION)
FIGURE 72 SPAIN SPECIALTY GAS CURRENT AND FUTURE END USER ANALYSIS, 2025–2034, (USD MILLION)
FIGURE 73 ITALY SPECIALTY GAS CURRENT AND FUTURE TYPE ANALYSIS, 2025–2034, (USD MILLION)
FIGURE 74 ITALY SPECIALTY GAS CURRENT AND FUTURE END USER ANALYSIS, 2025–2034, (USD MILLION)
FIGURE 75 REST OF WESTERN EUROPE SPECIALTY GAS CURRENT AND FUTURE TYPE ANALYSIS, 2025–2034, (USD MILLION)
FIGURE 76 REST OF WESTERN EUROPE SPECIALTY GAS CURRENT AND FUTURE END USER ANALYSIS, 2025–2034, (USD MILLION)
FIGURE 77 EAST ASIA AND PACIFIC SPECIALTY GAS CURRENT AND FUTURE MARKET VOLUME SHARE REGIONAL ANALYSIS, 2025–2034, (USD MILLION)
FIGURE 78 CHINA SPECIALTY GAS CURRENT AND FUTURE TYPE ANALYSIS, 2025–2034, (USD MILLION)
FIGURE 79 CHINA SPECIALTY GAS CURRENT AND FUTURE END USER ANALYSIS, 2025–2034, (USD MILLION)
FIGURE 80 JAPAN SPECIALTY GAS CURRENT AND FUTURE TYPE ANALYSIS, 2025–2034, (USD MILLION)
FIGURE 81 JAPAN SPECIALTY GAS CURRENT AND FUTURE END USER ANALYSIS, 2025–2034, (USD MILLION)
FIGURE 82 AUSTRALIA SPECIALTY GAS CURRENT AND FUTURE TYPE ANALYSIS, 2025–2034, (USD MILLION)
FIGURE 83 AUSTRALIA SPECIALTY GAS CURRENT AND FUTURE END USER ANALYSIS, 2025–2034, (USD MILLION)
FIGURE 84 CAMBODIA SPECIALTY GAS CURRENT AND FUTURE TYPE ANALYSIS, 2025–2034, (USD MILLION)
FIGURE 85 CAMBODIA SPECIALTY GAS CURRENT AND FUTURE END USER ANALYSIS, 2025–2034, (USD MILLION)
FIGURE 86 FIJI SPECIALTY GAS CURRENT AND FUTURE TYPE ANALYSIS, 2025–2034, (USD MILLION)
FIGURE 87 FIJI SPECIALTY GAS CURRENT AND FUTURE END USER ANALYSIS, 2025–2034, (USD MILLION)
FIGURE 88 INDONESIA SPECIALTY GAS CURRENT AND FUTURE TYPE ANALYSIS, 2025–2034, (USD MILLION)
FIGURE 89 INDONESIA SPECIALTY GAS CURRENT AND FUTURE END USER ANALYSIS, 2025–2034, (USD MILLION)
FIGURE 90 SOUTH KOREA SPECIALTY GAS CURRENT AND FUTURE TYPE ANALYSIS, 2025–2034, (USD MILLION)
FIGURE 91 SOUTH KOREA SPECIALTY GAS CURRENT AND FUTURE END USER ANALYSIS, 2025–2034, (USD MILLION)
FIGURE 92 REST OF EAST ASIA AND PACIFIC SPECIALTY GAS CURRENT AND FUTURE TYPE ANALYSIS, 2025–2034, (USD MILLION)
FIGURE 93 REST OF EAST ASIA AND PACIFIC SPECIALTY GAS CURRENT AND FUTURE END USER ANALYSIS, 2025–2034, (USD MILLION)
FIGURE 94 SEA AND SOUTH ASIA SPECIALTY GAS CURRENT AND FUTURE MARKET VOLUME SHARE REGIONAL ANALYSIS, 2025–2034, (USD MILLION)
FIGURE 95 BANGLADESH SPECIALTY GAS CURRENT AND FUTURE TYPE ANALYSIS, 2025–2034, (USD MILLION)
FIGURE 96 BANGLADESH SPECIALTY GAS CURRENT AND FUTURE END USER ANALYSIS, 2025–2034, (USD MILLION)
FIGURE 97 NEW ZEALAND SPECIALTY GAS CURRENT AND FUTURE TYPE ANALYSIS, 2025–2034, (USD MILLION)
FIGURE 98 NEW ZEALAND SPECIALTY GAS CURRENT AND FUTURE END USER ANALYSIS, 2025–2034, (USD MILLION)
FIGURE 99 INDIA SPECIALTY GAS CURRENT AND FUTURE TYPE ANALYSIS, 2025–2034, (USD MILLION)
FIGURE 100 INDIA SPECIALTY GAS CURRENT AND FUTURE END USER ANALYSIS, 2025–2034, (USD MILLION)
FIGURE 101 SINGAPORE SPECIALTY GAS CURRENT AND FUTURE TYPE ANALYSIS, 2025–2034, (USD MILLION)
FIGURE 102 SINGAPORE SPECIALTY GAS CURRENT AND FUTURE END USER ANALYSIS, 2025–2034, (USD MILLION)
FIGURE 103 THAILAND SPECIALTY GAS CURRENT AND FUTURE TYPE ANALYSIS, 2025–2034, (USD MILLION)
FIGURE 104 THAILAND SPECIALTY GAS CURRENT AND FUTURE END USER ANALYSIS, 2025–2034, (USD MILLION)
FIGURE 105 TAIWAN SPECIALTY GAS CURRENT AND FUTURE TYPE ANALYSIS, 2025–2034, (USD MILLION)
FIGURE 106 TAIWAN SPECIALTY GAS CURRENT AND FUTURE END USER ANALYSIS, 2025–2034, (USD MILLION)
FIGURE 107 MALAYSIA SPECIALTY GAS CURRENT AND FUTURE TYPE ANALYSIS, 2025–2034, (USD MILLION)
FIGURE 108 MALAYSIA SPECIALTY GAS CURRENT AND FUTURE END USER ANALYSIS, 2025–2034, (USD MILLION)
FIGURE 109 REST OF SEA AND SOUTH ASIA SPECIALTY GAS CURRENT AND FUTURE TYPE ANALYSIS, 2025–2034, (USD MILLION)
FIGURE 110 REST OF SEA AND SOUTH ASIA SPECIALTY GAS CURRENT AND FUTURE END USER ANALYSIS, 2025–2034, (USD MILLION)
FIGURE 111 MIDDLE EAST AND AFRICA SPECIALTY GAS CURRENT AND FUTURE MARKET VOLUME SHARE REGIONAL ANALYSIS, 2025–2034, (USD MILLION)
FIGURE 112 GCC COUNTRIES SPECIALTY GAS CURRENT AND FUTURE TYPE ANALYSIS, 2025–2034, (USD MILLION)
FIGURE 113 GCC COUNTRIES SPECIALTY GAS CURRENT AND FUTURE END USER ANALYSIS, 2025–2034, (USD MILLION)
FIGURE 114 SAUDI ARABIA SPECIALTY GAS CURRENT AND FUTURE TYPE ANALYSIS, 2025–2034, (USD MILLION)
FIGURE 115 SAUDI ARABIA SPECIALTY GAS CURRENT AND FUTURE END USER ANALYSIS, 2025–2034, (USD MILLION)
FIGURE 116 UAE SPECIALTY GAS CURRENT AND FUTURE TYPE ANALYSIS, 2025–2034, (USD MILLION)
FIGURE 117 UAE SPECIALTY GAS CURRENT AND FUTURE END USER ANALYSIS, 2025–2034, (USD MILLION)
FIGURE 118 BAHRAIN SPECIALTY GAS CURRENT AND FUTURE TYPE ANALYSIS, 2025–2034, (USD MILLION)
FIGURE 119 BAHRAIN SPECIALTY GAS CURRENT AND FUTURE END USER ANALYSIS, 2025–2034, (USD MILLION)
FIGURE 120 KUWAIT SPECIALTY GAS CURRENT AND FUTURE TYPE ANALYSIS, 2025–2034, (USD MILLION)
FIGURE 121 KUWAIT SPECIALTY GAS CURRENT AND FUTURE END USER ANALYSIS, 2025–2034, (USD MILLION)
FIGURE 122 OMAN SPECIALTY GAS CURRENT AND FUTURE TYPE ANALYSIS, 2025–2034, (USD MILLION)
FIGURE 123 OMAN SPECIALTY GAS CURRENT AND FUTURE END USER ANALYSIS, 2025–2034, (USD MILLION)
FIGURE 124 QATAR SPECIALTY GAS CURRENT AND FUTURE TYPE ANALYSIS, 2025–2034, (USD MILLION)
FIGURE 125 QATAR SPECIALTY GAS CURRENT AND FUTURE END USER ANALYSIS, 2025–2034, (USD MILLION)
FIGURE 126 EGYPT SPECIALTY GAS CURRENT AND FUTURE TYPE ANALYSIS, 2025–2034, (USD MILLION)
FIGURE 127 EGYPT SPECIALTY GAS CURRENT AND FUTURE END USER ANALYSIS, 2025–2034, (USD MILLION)
FIGURE 128 NIGERIA SPECIALTY GAS CURRENT AND FUTURE TYPE ANALYSIS, 2025–2034, (USD MILLION)
FIGURE 129 NIGERIA SPECIALTY GAS CURRENT AND FUTURE END USER ANALYSIS, 2025–2034, (USD MILLION)
FIGURE 130 SOUTH AFRICA SPECIALTY GAS CURRENT AND FUTURE TYPE ANALYSIS, 2025–2034, (USD MILLION)
FIGURE 131 SOUTH AFRICA SPECIALTY GAS CURRENT AND FUTURE END USER ANALYSIS, 2025–2034, (USD MILLION)
FIGURE 132 ISRAEL SPECIALTY GAS CURRENT AND FUTURE TYPE ANALYSIS, 2025–2034, (USD MILLION)
FIGURE 133 ISRAEL SPECIALTY GAS CURRENT AND FUTURE END USER ANALYSIS, 2025–2034, (USD MILLION)
FIGURE 134 REST OF MEA SPECIALTY GAS CURRENT AND FUTURE TYPE ANALYSIS, 2025–2034, (USD MILLION)
FIGURE 135 REST OF MEA SPECIALTY GAS CURRENT AND FUTURE END USER ANALYSIS, 2025–2034, (USD MILLION)
FIGURE 136 U. S. MARKET SHARE ANALYSIS BY TYPE (2024)
FIGURE 137 U. S. MARKET SHARE ANALYSIS BY END USER (2024)
FIGURE 138 CANADA MARKET SHARE ANALYSIS BY TYPE (2024)
FIGURE 139 CANADA MARKET SHARE ANALYSIS BY END USER (2024)
FIGURE 140 MEXICO MARKET SHARE ANALYSIS BY TYPE (2024)
FIGURE 141 MEXICO MARKET SHARE ANALYSIS BY END USER (2024)
FIGURE 142 CHINA MARKET SHARE ANALYSIS BY TYPE (2024)
FIGURE 143 CHINA MARKET SHARE ANALYSIS BY END USER (2024)
FIGURE 144 JAPAN MARKET SHARE ANALYSIS BY TYPE (2024)
FIGURE 145 JAPAN MARKET SHARE ANALYSIS BY END USER (2024)
FIGURE 146 INDIA MARKET SHARE ANALYSIS BY TYPE (2024)
FIGURE 147 INDIA MARKET SHARE ANALYSIS BY END USER (2024)
FIGURE 148 SOUTH KOREA MARKET SHARE ANALYSIS BY TYPE (2024)
FIGURE 149 SOUTH KOREA MARKET SHARE ANALYSIS BY END USER (2024)
FIGURE 150 SAUDI ARABIA MARKET SHARE ANALYSIS BY TYPE (2024)
FIGURE 151 SAUDI ARABIA MARKET SHARE ANALYSIS BY END USER (2024)
FIGURE 152 UAE MARKET SHARE ANALYSIS BY TYPE (2024)
FIGURE 153 UAE MARKET SHARE ANALYSIS BY END USER (2024)
FIGURE 154 EGYPT MARKET SHARE ANALYSIS BY TYPE (2024)
FIGURE 155 EGYPT MARKET SHARE ANALYSIS BY END USER (2024)
FIGURE 156 NIGERIA MARKET SHARE ANALYSIS BY TYPE (2024)
FIGURE 157 NIGERIA MARKET SHARE ANALYSIS BY END USER (2024)
FIGURE 158 SOUTH AFRICA MARKET SHARE ANALYSIS BY TYPE (2024)
FIGURE 159 SOUTH AFRICA MARKET SHARE ANALYSIS BY END USER (2024)
FIGURE 160 GERMANY MARKET SHARE ANALYSIS BY TYPE (2024)
FIGURE 161 GERMANY MARKET SHARE ANALYSIS BY END USER (2024)
FIGURE 162 FRANCE MARKET SHARE ANALYSIS BY TYPE (2024)
FIGURE 163 FRANCE MARKET SHARE ANALYSIS BY END USER (2024)
FIGURE 164 UK MARKET SHARE ANALYSIS BY TYPE (2024)
FIGURE 165 UK MARKET SHARE ANALYSIS BY END USER (2024)
FIGURE 166 SPAIN MARKET SHARE ANALYSIS BY TYPE (2024)
FIGURE 167 SPAIN MARKET SHARE ANALYSIS BY END USER (2024)
FIGURE 168 ITALY MARKET SHARE ANALYSIS BY TYPE (2024)
FIGURE 169 ITALY MARKET SHARE ANALYSIS BY END USER (2024)
FIGURE 170 BRAZIL MARKET SHARE ANALYSIS BY TYPE (2024)
FIGURE 171 BRAZIL MARKET SHARE ANALYSIS BY END USER (2024)
FIGURE 172 ARGENTINA MARKET SHARE ANALYSIS BY TYPE (2024)
FIGURE 173 ARGENTINA MARKET SHARE ANALYSIS BY END USER (2024)
FIGURE 174 COLUMBIA MARKET SHARE ANALYSIS BY TYPE (2024)
FIGURE 175 COLUMBIA MARKET SHARE ANALYSIS BY END USER (2024)
FIGURE 176 GLOBAL SPECIALTY GAS CURRENT AND FUTURE MARKET KEY COUNTRY LEVEL ANALYSIS, 2024–2034, (USD MILLION)
FIGURE 177 FINANCIAL OVERVIEW:
Key Players Analysis:
Messer Group GmbH: Messer Group GmbH, headquartered in Bad Soden, Germany, is the world's largest privately held specialist for industrial, medical, and specialty gases. With operations spanning Europe, Asia, and the Americas, Messer has established itself as a key player in the specialty gases sector.
Linde plc: Linde's specialty gases encompass high-purity gases and precise gas mixtures, essential for applications demanding exacting standards. Their ProSpec line delivers ultra-high purity gases and mixtures produced to rigorous environmental standards, complemented by an extensive range of gas handling and delivery equipment, as well as a broad array of services.
Air Products and Chemicals, Inc.: Air Products and Chemicals, Inc. is a leading global provider of specialty gases, offering a comprehensive portfolio of ultra-high purity gases, calibration mixtures, and gas-handling equipment. These products are essential for applications in industries such as electronics, pharmaceuticals, petrochemicals, and environmental monitoring.
Market Key Players
Air Products and Chemicals, Inc.
ILMO Products Company
Linde plc
Messer Group GmbH
Norco Inc.
Taiyo Nippon Sanso Corporation
YUEYANG KAIMEITE ELECTRONIC AND SPECIALTY RARE GASES CO.
Air Liquide
Coregas
Iwatani Corporation of America
MESA Specialty Gases & Equipment
Mitsui Chemicals, Inc.
Showa Denko K.K.
Weldstar
Airgas, Inc.
Driver:
Rising demand from the electronics and semiconductor industry
One of the primary drivers of the specialty gas market is the rising demand from the electronics and semiconductor industry. Specialty gases are essential in the manufacturing of semiconductors, displays, and photovoltaic cells, where high purity and precise chemical properties are critical. As the demand for smartphones, laptops, electric vehicles, and advanced electronics continues to grow, so does the need for specialty gases used in etching, doping, and cleaning processes during chip fabrication. This trend is further fueled by technological advancements like 5G, AI, and IoT, all of which rely heavily on semiconductor components, thus pushing the specialty gas market forward.
Restrain:
High production and handling cost
One of the primary restraints in the specialty gas market is the high production and handling cost associated with maintaining gas purity and safety standards. Specialty gases often require sophisticated purification processes and tightly controlled environments to achieve the necessary purity levels. These requirements increase operational costs, making the final product more expensive than industrial gases.
Stringent regulatory compliance
Stringent regulatory compliance for transportation, storage, and usage of specialty gases adds complexity and cost for suppliers and end-users. Regulations related to environmental impact, health hazards, and safety protocols can slow down the adoption and distribution, especially in emerging markets where infrastructure may not support high-standard compliance.
Opportunities:
Expansion in the healthcare sector
The healthcare sector presents a significant growth opportunity for the specialty gas market. As the global population ages and healthcare services improve worldwide, there is an increasing demand for medical gases in a variety of applications. These gases, including oxygen, nitrous oxide, and carbon dioxide, are essential in hospitals for patient care, anesthesia, respiratory therapies, and sterilization processes. The rising number of surgical procedures, the growing need for emergency care, and the shift towards home healthcare contribute to the growing demand for medical gases. This trend is expected to drive substantial growth in the specialty gas industry, as healthcare providers seek to meet the rising need for these critical gases across diverse medical settings.
Trends:
Integration of digital technologies in specialty gas management
The integration of digital technologies, especially the Internet of Things (IoT), is revolutionizing the specialty gas market by enabling real-time monitoring and management of gases. IoT-enabled sensors are being installed in gas cylinders and containers to continuously track various parameters such as gas levels, pressure, temperature, and location. This real-time data allows businesses to optimize their gas usage, reduce waste, and improve operational efficiency. Additionally, IoT technology enhances safety by providing early warnings of potential problems. For example, changes in pressure or temperature that deviate from normal could indicate a leak or malfunction, and sensors can send alerts to operators to address these issues before they become critical.
Recent Development:
In December 2022, Air Products and Chemicals, Inc., in collaboration with AES Corporation, announced a substantial $4 billion investment to establish the first large-scale green hydrogen production facility in Texas, USA. This initiative aimed to address the increasing demand for zero-carbon fuels in sectors such as transportation and heavy industry. The proposed plant was designed to integrate over 1 gigawatt of renewable energy from wind and solar sources to power electrolyzers capable of generating more than 200 metric tons of green hydrogen daily. The project represented a major step forward in the U.S. clean energy transition by promoting the adoption of hydrogen as a sustainable fuel alternative.
In January 2031, Taiyo Nippon Sanso Corporation (TNSC) established a new business and logistics site for specialty gases in Kikuyo-machi, Kikuchi-gun, Kumamoto Prefecture, Japan. This initiative aims to strengthen the company's logistics capabilities for specialty gases in the Kyushu region, particularly in response to the growing demand from semiconductor-related industries.