Global Specialty Insurance Market Size, Share, Forecast& Analysis Report by Type (Marine, Aviation and Transport (MAT) Insurance, Professional Liability Insurance, Property Insurance, Cyber Liability Insurance, Directors and Officers (D&O) Insurance, Entertainment Insurance, Art Insurance, Others), Distribution Channel (Brokers, Non-Brokers (Direct Sales)), End User(Business, Individuals) Region and Key Players - Industry Segment Overview, Market Dynamics, Competitive Strategies, Trends and Forecast 2025-2034
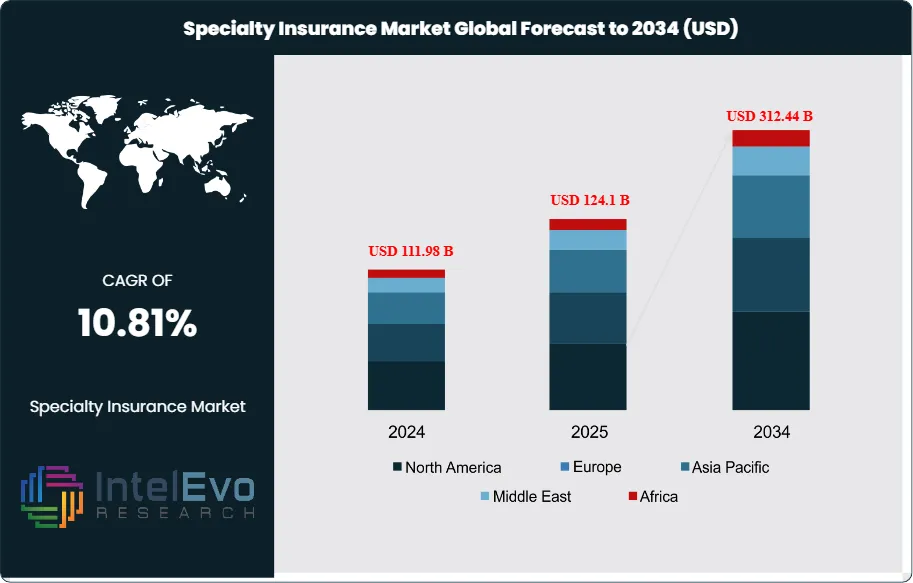
The Specialty Insurance Market size is expected to be worth around USD 312.44 billion by 2034, rising from USD 111.98 billion in 2024, and expanding at a CAGR of 10.81% during the forecast period from 2024 to 2034. This strong growth is driven by increasing demand for customized risk coverage across sectors such as cyber liability, marine, aviation, energy, and professional indemnity. Rising business complexity, heightened regulatory scrutiny, and growing exposure to climate-related and digital risks are further accelerating adoption, positioning specialty insurance as a critical component of modern enterprise risk management strategies worldwide.
The Specialty Insurance Market encompasses insurance products designed to address unique, exceptional, or atypical risks that fall outside standard insurance policies. Unlike traditional coverage, specialty insurance provides customized solutions for specific industries, high-value assets, and complex risk scenarios including marine operations, aviation, cyber threats, professional liability, fine arts, and entertainment ventures.
The specialty insurance market is experiencing robust expansion driven by increasing complexity of business operations, emerging cyber threats, climate-related risks, and growing wealth concentrations requiring specialized asset protection. Digital transformation initiatives, regulatory changes, and globalization of trade are creating new risk categories that demand tailored insurance solutions beyond conventional coverage limitations.
North America leads the specialty insurance market with strong regulatory frameworks, mature financial markets, and advanced risk assessment capabilities. The U.S. drives growth through surplus lines infrastructure, data-driven underwriting, and innovative insurance-linked securities. Europe excels in ESG-focused and sustainability-driven products, supported by London’s Lloyd’s market. Asia-Pacific is the fastest-growing region, with China and India expanding opportunities through economic growth, infrastructure investment, and relaxed reinsurer participation, fueling demand for specialized coverage.
The pandemic accelerated demand for specialty insurance products, particularly cyber liability coverage as remote work expanded attack surfaces, and business interruption policies gained prominence. Supply chain disruptions highlighted the need for specialized trade credit and political risk insurance, while healthcare-related specialty coverages experienced significant growth.
Geopolitical tensions and trade uncertainties have intensified demand for political risk insurance, trade credit coverage, and specialized international business protection. Supply chain volatilities and sanctions regimes have created new specialty insurance categories while driving premium increases across marine, aviation, and transport coverage segments.
Key Takeaways
Market Growth: The Specialty Insurance Market is expected to reach USD 312.44 Billion by 2034, fueled by complex business operations, cyber threats, climate risks, and rising wealth requiring tailored protection.
Type Dominance: Marine, Aviation and Transport (MAT) Insurance leads the specialty insurance market, driven by global trade expansion and complex transportation risk management needs. This segment includes marine cargo, aviation liability, and transport logistics coverage. Among these, MAT dominates due to high-value international trade requirements and regulatory compliance needs.
Distribution Channel Dominance: Brokers dominate the specialty insurance distribution landscape, powered by their specialized expertise and risk assessment capabilities. The segment comprises direct brokers and wholesale intermediaries, with brokers gaining prominence due to their ability to navigate complex specialty risk scenarios and connect clients with appropriate coverage solutions.
End User Dominance: Business segment holds the largest share in the specialty insurance market, owing to diverse operational risk exposures and regulatory compliance requirements. Key sub-segments include large enterprises, SMEs, and specialized industries. Business users excel due to complex risk profiles requiring tailored coverage solutions beyond standard commercial policies.
Market Drivers: Key drivers accelerating growth include digital transformation creating cyber risk exposures and climate change intensifying environmental liability needs, which boost market expansion through new specialty product development and coverage innovations.
Market Restraints: Growth is hindered by limited market size constraints and high specialization costs, which create challenges such as reduced scalability and elevated underwriting expenses for niche risk categories.
Market Opportunities: The market is poised for expansion due to opportunities like agricultural sector risk evolution and emerging technology adoption, which enable specialized coverage development for precision farming, drone operations, and sustainable agriculture practices.
Market Trends: Emerging trends including artificial intelligence integration and ESG consideration mainstreaming are reshaping the market by enhancing risk assessment capabilities and creating new specialty coverage categories for environmental and social governance risks.
Regional Leader: North America leads the global specialty insurance market through established regulatory frameworks, mature financial infrastructure, and strong corporate awareness of specialized risk management needs.
Type Analysis:
The specialty insurance type segmentation reveals Marine, Aviation and Transport (MAT) Insurance as the dominant category, commanding 25% market share through its essential role in global commerce protection. This segment encompasses cargo insurance, hull coverage, aviation liability, and logistics protection services. The leadership position stems from increasing international trade volumes, complex regulatory requirements across jurisdictions, and the high-value nature of transported goods requiring specialized underwriting expertise. Professional liability and property insurance follow as significant contributors, addressing growing business complexity and asset protection needs. The diversification within this segment reflects the expanding risk landscape facing modern enterprises and individuals seeking protection beyond traditional coverage boundaries.
Distribution Channel Analysis:
Brokers Leads With over 70% Market Share In Specialty Insurance Market: The distribution channel segmentation demonstrates brokers' commanding 60% market share dominance through their specialized knowledge and intermediary value proposition. Brokers excel in the specialty insurance market due to their deep understanding of complex risk scenarios, established relationships with specialized underwriters, and ability to navigate intricate policy structures that individual buyers find challenging. Their expertise in risk assessment and coverage customization creates significant value for clients seeking non-standard protection. The non-broker segment, while smaller, shows growth potential through direct insurer relationships and digital distribution innovations that reduce intermediary costs while maintaining coverage quality and accessibility.
End User Analysis:
Business end users maintain 59% market share leadership driven by their exposure to diverse operational risks requiring specialized coverage solutions. This dominance reflects the complex risk profiles of modern enterprises facing cyber threats, professional liability exposures, supply chain vulnerabilities, and regulatory compliance requirements that standard commercial policies cannot adequately address. Individual consumers represent a growing segment as high-net-worth individuals, collectors, and specialty lifestyle participants seek customized protection for unique assets and activities. The business segment's leadership position is reinforced by increasing regulatory requirements, technological adoption creating new risk categories, and globalization expanding enterprise risk exposures across multiple jurisdictions and operational areas.
Regional Analysis
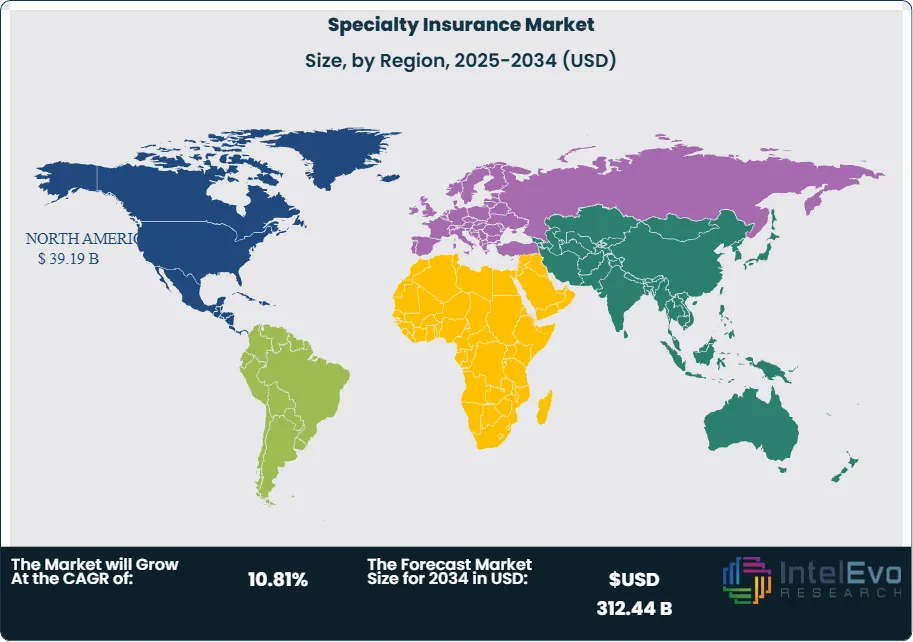
North America Leads With more than 35% Market Share In Specialty Insurance Market: North America's specialty insurance leadership stems from its comprehensive regulatory environment that has fostered the development and widespread adoption of specialized insurance products across multiple industry verticals. The region benefits from mature financial markets and established institutional knowledge that enables sophisticated risk assessment and product development capabilities. Corporate awareness regarding operational risks has significantly elevated demand for customized insurance solutions that address unique business challenges not covered by standard policies. The United States serves as the primary driver within the North American market, leveraging its well-developed surplus lines infrastructure and regulatory stability to maintain competitive advantages in specialty coverage areas. The region's strength lies in its abundant capacity for complex risks, supported by developed loss-data pools and innovative insurance-linked securities that provide comprehensive coverage options. Advanced analytics capabilities and established broking networks enable efficient distribution and pricing of specialized products across diverse market segments.
Europe demonstrates strong performance in specialty insurance through stringent regulatory standards and emphasis on corporate governance, particularly excelling in ESG-linked innovation and sustainability-focused coverage solutions. The region benefits from London's position as a global specialty hub and Lloyd's syndicated capacity, despite Brexit-related operational complexities.
Asia-Pacific represents the fastest-growing specialty insurance region, driven by rapid economic development, infrastructure investments, and supply-chain diversification initiatives that create demand for specialized coverage. Countries like China and India are progressively relaxing foreign reinsurer participation, expanding product offerings and competitive choices.
Type (Marine, Aviation and Transport (MAT) Insurance, Professional Liability Insurance, Property Insurance, Cyber Liability Insurance, Directors and Officers (D&O) Insurance, Entertainment Insurance, Art Insurance, Others), Distribution Channel (Brokers, Non-Brokers (Direct Sales)), End User (Business, Individuals)
Research Methodology
Primary Research- 100 Interviews of Stakeholders
Secondary Research
Desk Research
Regional scope
North America (United States, Canada, Mexico)
Latin America (Brazil, Argentina, Columbia)
East Asia And Pacific (China, Japan, South Korea, Australia, Cambodia, Fiji, Indonesia)
Sea And South Asia (India, Singapore, Thailand, Taiwan, Malaysia)
Eastern Europe (Poland, Russia, Czech Republic, Romania)
Western Europe (Germany, U.K., France, Spain, Itlay)
Middle East & Africa (GCC Countries, Egypt, Nigeria, South Africa, Israel)
Competitive Landscape
American International Group (AIG), Chubb Limited, Allianz SE, Kinsale Capital Group, Beazley, Hiscox Ltd, Munich Re, Tokio Marine Holdings, QBE Insurance Group
Customization Scope
Customization for segments, region/country-level will be provided. Moreover, additional customization can be done based on the requirements.
Pricing and Purchase Options
Avail customized purchase options to meet your exact research needs. We have three licenses to opt for: Single User License, Multi-User License (Up to 5 Users), Corporate Use License (Unlimited User and Printable PDF).
TABLE OF CONTENTS
1. EXECUTIVE SUMMARY
1.1. MARKET SNAPSHOT
1.2. KEY FINDINGS & INSIGHTS
1.3. ANALYST RECOMMENDATIONS
1.4. FUTURE OUTLOOK
2. RESEARCH METHODOLOGY
2.1. MARKET DEFINITION & SCOPE
2.2. RESEARCH OBJECTIVES: PRIMARY & SECONDARY DATA SOURCES
2.3. DATA COLLECTION SOURCES
2.3.1. COVERAGE OF 100+ PRIMARY RESEARCH/CONSULTATION CALLS WITH INDUSTRY STAKEHOLDERS
FIGURE 17 NORTH AMERICA SPECIALTY INSURANCE CURRENT AND FUTURE TYPE ANALYSIS, 2025–2034, (USD MILLION)
FIGURE 18 NORTH AMERICA SPECIALTY INSURANCE CURRENT AND FUTURE END USER ANALYSIS, 2025–2034, (USD MILLION)
FIGURE 19 MARKET SHARE BY COUNTRY
FIGURE 20 LATIN AMERICA SPECIALTY INSURANCE CURRENT AND FUTURE TYPE ANALYSIS, 2025–2034, (USD MILLION)
FIGURE 21 LATIN AMERICA SPECIALTY INSURANCE CURRENT AND FUTURE END USER ANALYSIS, 2025–2034, (USD MILLION)
FIGURE 22 MARKET SHARE BY COUNTRY
FIGURE 23 EASTERN EUROPE SPECIALTY INSURANCE CURRENT AND FUTURE TYPE ANALYSIS, 2025–2034, (USD MILLION)
FIGURE 24 EASTERN EUROPE SPECIALTY INSURANCE CURRENT AND FUTURE END USER ANALYSIS, 2025–2034, (USD MILLION)
FIGURE 25 MARKET SHARE BY COUNTRY
FIGURE 26 WESTERN EUROPE SPECIALTY INSURANCE CURRENT AND FUTURE TYPE ANALYSIS, 2025–2034, (USD MILLION)
FIGURE 27 WESTERN EUROPE SPECIALTY INSURANCE CURRENT AND FUTURE END USER ANALYSIS, 2025–2034, (USD MILLION)
FIGURE 28 MARKET SHARE BY COUNTRY
FIGURE 29 EAST ASIA AND PACIFIC SPECIALTY INSURANCE CURRENT AND FUTURE TYPE ANALYSIS, 2025–2034, (USD MILLION)
FIGURE 30 EAST ASIA AND PACIFIC SPECIALTY INSURANCE CURRENT AND FUTURE END USER ANALYSIS, 2025–2034, (USD MILLION)
FIGURE 31 MARKET SHARE BY COUNTRY
FIGURE 32 SEA AND SOUTH ASIA SPECIALTY INSURANCE CURRENT AND FUTURE TYPE ANALYSIS, 2025–2034, (USD MILLION)
FIGURE 33 SEA AND SOUTH ASIA SPECIALTY INSURANCE CURRENT AND FUTURE END USER ANALYSIS, 2025–2034, (USD MILLION)
FIGURE 34 MARKET SHARE BY COUNTRY
FIGURE 35 MIDDLE EAST AND AFRICA SPECIALTY INSURANCE CURRENT AND FUTURE TYPE ANALYSIS, 2025–2034, (USD MILLION)
FIGURE 36 MIDDLE EAST AND AFRICA SPECIALTY INSURANCE CURRENT AND FUTURE END USER ANALYSIS, 2025–2034, (USD MILLION)
FIGURE 37 NORTH AMERICA SPECIALTY INSURANCE CURRENT AND FUTURE MARKET VOLUME SHARE REGIONAL ANALYSIS, 2025–2034, (USD MILLION)
FIGURE 38 U.S. SPECIALTY INSURANCE CURRENT AND FUTURE TYPE ANALYSIS, 2025–2034, (USD MILLION)
FIGURE 39 U.S. SPECIALTY INSURANCE CURRENT AND FUTURE END USER ANALYSIS, 2025–2034, (USD MILLION)
FIGURE 40 CANADA SPECIALTY INSURANCE CURRENT AND FUTURE TYPE ANALYSIS, 2025–2034, (USD MILLION)
FIGURE 41 CANADA SPECIALTY INSURANCE CURRENT AND FUTURE END USER ANALYSIS, 2025–2034, (USD MILLION)
FIGURE 42 LATIN AMERICA SPECIALTY INSURANCE CURRENT AND FUTURE MARKET VOLUME SHARE REGIONAL ANALYSIS, 2025–2034, (USD MILLION)
FIGURE 43 MEXICO SPECIALTY INSURANCE CURRENT AND FUTURE TYPE ANALYSIS, 2025–2034, (USD MILLION)
FIGURE 44 MEXICO SPECIALTY INSURANCE CURRENT AND FUTURE END USER ANALYSIS, 2025–2034, (USD MILLION)
FIGURE 45 BRAZIL SPECIALTY INSURANCE CURRENT AND FUTURE TYPE ANALYSIS, 2025–2034, (USD MILLION)
FIGURE 46 BRAZIL SPECIALTY INSURANCE CURRENT AND FUTURE END USER ANALYSIS, 2025–2034, (USD MILLION)
FIGURE 47 ARGENTINA SPECIALTY INSURANCE CURRENT AND FUTURE TYPE ANALYSIS, 2025–2034, (USD MILLION)
FIGURE 48 ARGENTINA SPECIALTY INSURANCE CURRENT AND FUTURE END USER ANALYSIS, 2025–2034, (USD MILLION)
FIGURE 49 COLUMBIA SPECIALTY INSURANCE CURRENT AND FUTURE TYPE ANALYSIS, 2025–2034, (USD MILLION)
FIGURE 50 COLUMBIA SPECIALTY INSURANCE CURRENT AND FUTURE END USER ANALYSIS, 2025–2034, (USD MILLION)
FIGURE 51 REST OF LATIN AMERICA SPECIALTY INSURANCE CURRENT AND FUTURE TYPE ANALYSIS, 2025–2034, (USD MILLION)
FIGURE 52 REST OF LATIN AMERICA SPECIALTY INSURANCE CURRENT AND FUTURE END USER ANALYSIS, 2025–2034, (USD MILLION)
FIGURE 53 EASTERN EUROPE SPECIALTY INSURANCE CURRENT AND FUTURE MARKET VOLUME SHARE REGIONAL ANALYSIS, 2025–2034, (USD MILLION)
FIGURE 54 POLAND SPECIALTY INSURANCE CURRENT AND FUTURE TYPE ANALYSIS, 2025–2034, (USD MILLION)
FIGURE 55 POLAND SPECIALTY INSURANCE CURRENT AND FUTURE END USER ANALYSIS, 2025–2034, (USD MILLION)
FIGURE 56 RUSSIA SPECIALTY INSURANCE CURRENT AND FUTURE TYPE ANALYSIS, 2025–2034, (USD MILLION)
FIGURE 57 RUSSIA SPECIALTY INSURANCE CURRENT AND FUTURE END USER ANALYSIS, 2025–2034, (USD MILLION)
FIGURE 58 CZECH REPUBLIC SPECIALTY INSURANCE CURRENT AND FUTURE TYPE ANALYSIS, 2025–2034, (USD MILLION)
FIGURE 59 CZECH REPUBLIC SPECIALTY INSURANCE CURRENT AND FUTURE END USER ANALYSIS, 2025–2034, (USD MILLION)
FIGURE 60 ROMANIA SPECIALTY INSURANCE CURRENT AND FUTURE TYPE ANALYSIS, 2025–2034, (USD MILLION)
FIGURE 61 ROMANIA SPECIALTY INSURANCE CURRENT AND FUTURE END USER ANALYSIS, 2025–2034, (USD MILLION)
FIGURE 62 REST OF EASTERN EUROPE SPECIALTY INSURANCE CURRENT AND FUTURE TYPE ANALYSIS, 2025–2034, (USD MILLION)
FIGURE 63 REST OF EASTERN EUROPE SPECIALTY INSURANCE CURRENT AND FUTURE END USER ANALYSIS, 2025–2034, (USD MILLION)
FIGURE 64 WESTERN EUROPE SPECIALTY INSURANCE CURRENT AND FUTURE MARKET VOLUME SHARE REGIONAL ANALYSIS, 2025–2034, (USD MILLION)
FIGURE 65 GERMANY SPECIALTY INSURANCE CURRENT AND FUTURE TYPE ANALYSIS, 2025–2034, (USD MILLION)
FIGURE 66 GERMANY SPECIALTY INSURANCE CURRENT AND FUTURE END USER ANALYSIS, 2025–2034, (USD MILLION)
FIGURE 67 FRANCE SPECIALTY INSURANCE CURRENT AND FUTURE TYPE ANALYSIS, 2025–2034, (USD MILLION)
FIGURE 68 FRANCE SPECIALTY INSURANCE CURRENT AND FUTURE END USER ANALYSIS, 2025–2034, (USD MILLION)
FIGURE 69 UK SPECIALTY INSURANCE CURRENT AND FUTURE TYPE ANALYSIS, 2025–2034, (USD MILLION)
FIGURE 70 UK SPECIALTY INSURANCE CURRENT AND FUTURE END USER ANALYSIS, 2025–2034, (USD MILLION)
FIGURE 71 SPAIN SPECIALTY INSURANCE CURRENT AND FUTURE TYPE ANALYSIS, 2025–2034, (USD MILLION)
FIGURE 72 SPAIN SPECIALTY INSURANCE CURRENT AND FUTURE END USER ANALYSIS, 2025–2034, (USD MILLION)
FIGURE 73 ITALY SPECIALTY INSURANCE CURRENT AND FUTURE TYPE ANALYSIS, 2025–2034, (USD MILLION)
FIGURE 74 ITALY SPECIALTY INSURANCE CURRENT AND FUTURE END USER ANALYSIS, 2025–2034, (USD MILLION)
FIGURE 75 REST OF WESTERN EUROPE SPECIALTY INSURANCE CURRENT AND FUTURE TYPE ANALYSIS, 2025–2034, (USD MILLION)
FIGURE 76 REST OF WESTERN EUROPE SPECIALTY INSURANCE CURRENT AND FUTURE END USER ANALYSIS, 2025–2034, (USD MILLION)
FIGURE 77 EAST ASIA AND PACIFIC SPECIALTY INSURANCE CURRENT AND FUTURE MARKET VOLUME SHARE REGIONAL ANALYSIS, 2025–2034, (USD MILLION)
FIGURE 78 CHINA SPECIALTY INSURANCE CURRENT AND FUTURE TYPE ANALYSIS, 2025–2034, (USD MILLION)
FIGURE 79 CHINA SPECIALTY INSURANCE CURRENT AND FUTURE END USER ANALYSIS, 2025–2034, (USD MILLION)
FIGURE 80 JAPAN SPECIALTY INSURANCE CURRENT AND FUTURE TYPE ANALYSIS, 2025–2034, (USD MILLION)
FIGURE 81 JAPAN SPECIALTY INSURANCE CURRENT AND FUTURE END USER ANALYSIS, 2025–2034, (USD MILLION)
FIGURE 82 AUSTRALIA SPECIALTY INSURANCE CURRENT AND FUTURE TYPE ANALYSIS, 2025–2034, (USD MILLION)
FIGURE 83 AUSTRALIA SPECIALTY INSURANCE CURRENT AND FUTURE END USER ANALYSIS, 2025–2034, (USD MILLION)
FIGURE 84 CAMBODIA SPECIALTY INSURANCE CURRENT AND FUTURE TYPE ANALYSIS, 2025–2034, (USD MILLION)
FIGURE 85 CAMBODIA SPECIALTY INSURANCE CURRENT AND FUTURE END USER ANALYSIS, 2025–2034, (USD MILLION)
FIGURE 86 FIJI SPECIALTY INSURANCE CURRENT AND FUTURE TYPE ANALYSIS, 2025–2034, (USD MILLION)
FIGURE 87 FIJI SPECIALTY INSURANCE CURRENT AND FUTURE END USER ANALYSIS, 2025–2034, (USD MILLION)
FIGURE 88 INDONESIA SPECIALTY INSURANCE CURRENT AND FUTURE TYPE ANALYSIS, 2025–2034, (USD MILLION)
FIGURE 89 INDONESIA SPECIALTY INSURANCE CURRENT AND FUTURE END USER ANALYSIS, 2025–2034, (USD MILLION)
FIGURE 90 SOUTH KOREA SPECIALTY INSURANCE CURRENT AND FUTURE TYPE ANALYSIS, 2025–2034, (USD MILLION)
FIGURE 91 SOUTH KOREA SPECIALTY INSURANCE CURRENT AND FUTURE END USER ANALYSIS, 2025–2034, (USD MILLION)
FIGURE 92 REST OF EAST ASIA AND PACIFIC SPECIALTY INSURANCE CURRENT AND FUTURE TYPE ANALYSIS, 2025–2034, (USD MILLION)
FIGURE 93 REST OF EAST ASIA AND PACIFIC SPECIALTY INSURANCE CURRENT AND FUTURE END USER ANALYSIS, 2025–2034, (USD MILLION)
FIGURE 94 SEA AND SOUTH ASIA SPECIALTY INSURANCE CURRENT AND FUTURE MARKET VOLUME SHARE REGIONAL ANALYSIS, 2025–2034, (USD MILLION)
FIGURE 95 BANGLADESH SPECIALTY INSURANCE CURRENT AND FUTURE TYPE ANALYSIS, 2025–2034, (USD MILLION)
FIGURE 96 BANGLADESH SPECIALTY INSURANCE CURRENT AND FUTURE END USER ANALYSIS, 2025–2034, (USD MILLION)
FIGURE 97 NEW ZEALAND SPECIALTY INSURANCE CURRENT AND FUTURE TYPE ANALYSIS, 2025–2034, (USD MILLION)
FIGURE 98 NEW ZEALAND SPECIALTY INSURANCE CURRENT AND FUTURE END USER ANALYSIS, 2025–2034, (USD MILLION)
FIGURE 99 INDIA SPECIALTY INSURANCE CURRENT AND FUTURE TYPE ANALYSIS, 2025–2034, (USD MILLION)
FIGURE 100 INDIA SPECIALTY INSURANCE CURRENT AND FUTURE END USER ANALYSIS, 2025–2034, (USD MILLION)
FIGURE 101 SINGAPORE SPECIALTY INSURANCE CURRENT AND FUTURE TYPE ANALYSIS, 2025–2034, (USD MILLION)
FIGURE 102 SINGAPORE SPECIALTY INSURANCE CURRENT AND FUTURE END USER ANALYSIS, 2025–2034, (USD MILLION)
FIGURE 103 THAILAND SPECIALTY INSURANCE CURRENT AND FUTURE TYPE ANALYSIS, 2025–2034, (USD MILLION)
FIGURE 104 THAILAND SPECIALTY INSURANCE CURRENT AND FUTURE END USER ANALYSIS, 2025–2034, (USD MILLION)
FIGURE 105 TAIWAN SPECIALTY INSURANCE CURRENT AND FUTURE TYPE ANALYSIS, 2025–2034, (USD MILLION)
FIGURE 106 TAIWAN SPECIALTY INSURANCE CURRENT AND FUTURE END USER ANALYSIS, 2025–2034, (USD MILLION)
FIGURE 107 MALAYSIA SPECIALTY INSURANCE CURRENT AND FUTURE TYPE ANALYSIS, 2025–2034, (USD MILLION)
FIGURE 108 MALAYSIA SPECIALTY INSURANCE CURRENT AND FUTURE END USER ANALYSIS, 2025–2034, (USD MILLION)
FIGURE 109 REST OF SEA AND SOUTH ASIA SPECIALTY INSURANCE CURRENT AND FUTURE TYPE ANALYSIS, 2025–2034, (USD MILLION)
FIGURE 110 REST OF SEA AND SOUTH ASIA SPECIALTY INSURANCE CURRENT AND FUTURE END USER ANALYSIS, 2025–2034, (USD MILLION)
FIGURE 111 MIDDLE EAST AND AFRICA SPECIALTY INSURANCE CURRENT AND FUTURE MARKET VOLUME SHARE REGIONAL ANALYSIS, 2025–2034, (USD MILLION)
FIGURE 112 GCC COUNTRIES SPECIALTY INSURANCE CURRENT AND FUTURE TYPE ANALYSIS, 2025–2034, (USD MILLION)
FIGURE 113 GCC COUNTRIES SPECIALTY INSURANCE CURRENT AND FUTURE END USER ANALYSIS, 2025–2034, (USD MILLION)
FIGURE 114 SAUDI ARABIA SPECIALTY INSURANCE CURRENT AND FUTURE TYPE ANALYSIS, 2025–2034, (USD MILLION)
FIGURE 115 SAUDI ARABIA SPECIALTY INSURANCE CURRENT AND FUTURE END USER ANALYSIS, 2025–2034, (USD MILLION)
FIGURE 116 UAE SPECIALTY INSURANCE CURRENT AND FUTURE TYPE ANALYSIS, 2025–2034, (USD MILLION)
FIGURE 117 UAE SPECIALTY INSURANCE CURRENT AND FUTURE END USER ANALYSIS, 2025–2034, (USD MILLION)
FIGURE 118 BAHRAIN SPECIALTY INSURANCE CURRENT AND FUTURE TYPE ANALYSIS, 2025–2034, (USD MILLION)
FIGURE 119 BAHRAIN SPECIALTY INSURANCE CURRENT AND FUTURE END USER ANALYSIS, 2025–2034, (USD MILLION)
FIGURE 120 KUWAIT SPECIALTY INSURANCE CURRENT AND FUTURE TYPE ANALYSIS, 2025–2034, (USD MILLION)
FIGURE 121 KUWAIT SPECIALTY INSURANCE CURRENT AND FUTURE END USER ANALYSIS, 2025–2034, (USD MILLION)
FIGURE 122 OMAN SPECIALTY INSURANCE CURRENT AND FUTURE TYPE ANALYSIS, 2025–2034, (USD MILLION)
FIGURE 123 OMAN SPECIALTY INSURANCE CURRENT AND FUTURE END USER ANALYSIS, 2025–2034, (USD MILLION)
FIGURE 124 QATAR SPECIALTY INSURANCE CURRENT AND FUTURE TYPE ANALYSIS, 2025–2034, (USD MILLION)
FIGURE 125 QATAR SPECIALTY INSURANCE CURRENT AND FUTURE END USER ANALYSIS, 2025–2034, (USD MILLION)
FIGURE 126 EGYPT SPECIALTY INSURANCE CURRENT AND FUTURE TYPE ANALYSIS, 2025–2034, (USD MILLION)
FIGURE 127 EGYPT SPECIALTY INSURANCE CURRENT AND FUTURE END USER ANALYSIS, 2025–2034, (USD MILLION)
FIGURE 128 NIGERIA SPECIALTY INSURANCE CURRENT AND FUTURE TYPE ANALYSIS, 2025–2034, (USD MILLION)
FIGURE 129 NIGERIA SPECIALTY INSURANCE CURRENT AND FUTURE END USER ANALYSIS, 2025–2034, (USD MILLION)
FIGURE 130 SOUTH AFRICA SPECIALTY INSURANCE CURRENT AND FUTURE TYPE ANALYSIS, 2025–2034, (USD MILLION)
FIGURE 131 SOUTH AFRICA SPECIALTY INSURANCE CURRENT AND FUTURE END USER ANALYSIS, 2025–2034, (USD MILLION)
FIGURE 132 ISRAEL SPECIALTY INSURANCE CURRENT AND FUTURE TYPE ANALYSIS, 2025–2034, (USD MILLION)
FIGURE 133 ISRAEL SPECIALTY INSURANCE CURRENT AND FUTURE END USER ANALYSIS, 2025–2034, (USD MILLION)
FIGURE 134 REST OF MEA SPECIALTY INSURANCE CURRENT AND FUTURE TYPE ANALYSIS, 2025–2034, (USD MILLION)
FIGURE 135 REST OF MEA SPECIALTY INSURANCE CURRENT AND FUTURE END USER ANALYSIS, 2025–2034, (USD MILLION)
FIGURE 136 U. S. MARKET SHARE ANALYSIS BY TYPE (2024)
FIGURE 137 U. S. MARKET SHARE ANALYSIS BY END USER (2024)
FIGURE 138 CANADA MARKET SHARE ANALYSIS BY TYPE (2024)
FIGURE 139 CANADA MARKET SHARE ANALYSIS BY END USER (2024)
FIGURE 140 MEXICO MARKET SHARE ANALYSIS BY TYPE (2024)
FIGURE 141 MEXICO MARKET SHARE ANALYSIS BY END USER (2024)
FIGURE 142 CHINA MARKET SHARE ANALYSIS BY TYPE (2024)
FIGURE 143 CHINA MARKET SHARE ANALYSIS BY END USER (2024)
FIGURE 144 JAPAN MARKET SHARE ANALYSIS BY TYPE (2024)
FIGURE 145 JAPAN MARKET SHARE ANALYSIS BY END USER (2024)
FIGURE 146 INDIA MARKET SHARE ANALYSIS BY TYPE (2024)
FIGURE 147 INDIA MARKET SHARE ANALYSIS BY END USER (2024)
FIGURE 148 SOUTH KOREA MARKET SHARE ANALYSIS BY TYPE (2024)
FIGURE 149 SOUTH KOREA MARKET SHARE ANALYSIS BY END USER (2024)
FIGURE 150 SAUDI ARABIA MARKET SHARE ANALYSIS BY TYPE (2024)
FIGURE 151 SAUDI ARABIA MARKET SHARE ANALYSIS BY END USER (2024)
FIGURE 152 UAE MARKET SHARE ANALYSIS BY TYPE (2024)
FIGURE 153 UAE MARKET SHARE ANALYSIS BY END USER (2024)
FIGURE 154 EGYPT MARKET SHARE ANALYSIS BY TYPE (2024)
FIGURE 155 EGYPT MARKET SHARE ANALYSIS BY END USER (2024)
FIGURE 156 NIGERIA MARKET SHARE ANALYSIS BY TYPE (2024)
FIGURE 157 NIGERIA MARKET SHARE ANALYSIS BY END USER (2024)
FIGURE 158 SOUTH AFRICA MARKET SHARE ANALYSIS BY TYPE (2024)
FIGURE 159 SOUTH AFRICA MARKET SHARE ANALYSIS BY END USER (2024)
FIGURE 160 GERMANY MARKET SHARE ANALYSIS BY TYPE (2024)
FIGURE 161 GERMANY MARKET SHARE ANALYSIS BY END USER (2024)
FIGURE 162 FRANCE MARKET SHARE ANALYSIS BY TYPE (2024)
FIGURE 163 FRANCE MARKET SHARE ANALYSIS BY END USER (2024)
FIGURE 164 UK MARKET SHARE ANALYSIS BY TYPE (2024)
FIGURE 165 UK MARKET SHARE ANALYSIS BY END USER (2024)
FIGURE 166 SPAIN MARKET SHARE ANALYSIS BY TYPE (2024)
FIGURE 167 SPAIN MARKET SHARE ANALYSIS BY END USER (2024)
FIGURE 168 ITALY MARKET SHARE ANALYSIS BY TYPE (2024)
FIGURE 169 ITALY MARKET SHARE ANALYSIS BY END USER (2024)
FIGURE 170 BRAZIL MARKET SHARE ANALYSIS BY TYPE (2024)
FIGURE 171 BRAZIL MARKET SHARE ANALYSIS BY END USER (2024)
FIGURE 172 ARGENTINA MARKET SHARE ANALYSIS BY TYPE (2024)
FIGURE 173 ARGENTINA MARKET SHARE ANALYSIS BY END USER (2024)
FIGURE 174 COLUMBIA MARKET SHARE ANALYSIS BY TYPE (2024)
FIGURE 175 COLUMBIA MARKET SHARE ANALYSIS BY END USER (2024)
FIGURE 176 GLOBAL SPECIALTY INSURANCE CURRENT AND FUTURE MARKET KEY COUNTRY LEVEL ANALYSIS, 2024–2034, (USD MILLION)
FIGURE 177 FINANCIAL OVERVIEW:
Key Players Analysis
American International Group (AIG): AIG operates as a major player in the specialty insurance market with comprehensive global presence and diversified specialty product portfolio. The company leverages its extensive international network and deep underwriting expertise to serve complex commercial risks across multiple specialty lines including cyber liability, professional indemnity, and international coverage. AIG's competitive strategy focuses on leveraging technology for enhanced risk assessment, expanding digital distribution capabilities, and developing innovative specialty products addressing emerging risk categories while maintaining strong financial stability and global service capabilities that position it as a preferred partner for multinational corporations and specialized industry sectors.
Chubb Limited: Chubb Limited maintains financial stability with a strong profitability track record and offers a comprehensive range of specialty insurance products with robust global presence. The company's competitive differentiators include premium market positioning, sophisticated risk assessment capabilities, and specialized underwriting expertise across high-value commercial and personal lines. Chubb's expansion strategy emphasizes organic growth in emerging markets, strategic acquisitions enhancing specialty capabilities, and technology investments improving operational efficiency while developing innovative coverage solutions for affluent individuals and complex commercial risks requiring tailored protection beyond standard market offerings.
Allianz SE: Allianz SE commands significant specialty insurance market share through its global diversification strategy and technological innovation focus addressing complex commercial and industrial risks. The company's competitive advantages include extensive European market presence, strong reinsurance capabilities, and integrated risk management services supporting specialty coverage development. Allianz's strategic approach emphasizes digital transformation initiatives, sustainable insurance product development, and expansion in high-growth specialty segments while leveraging its broad financial services platform to provide comprehensive risk solutions for corporate clients requiring specialized coverage across multiple jurisdictions and business lines.
Market Key Players
American International Group (AIG)
Chubb Limited
Allianz SE
Kinsale Capital Group
Beazley
Hiscox Ltd
Munich Re
Tokio Marine Holdings
QBE Insurance Group
Drivers
Digital Transformation and Cyber Risk Evolution:
The accelerating digital transformation across industries has created unprecedented cyber risk exposures that traditional insurance policies cannot adequately address. Organizations adopting cloud computing, IoT devices, and digital payment systems face sophisticated cyber threats including data breaches, ransomware attacks, and system disruptions requiring specialized coverage. This driver operates through multiple mechanisms including regulatory compliance requirements like GDPR creating liability exposures, remote work adoption expanding attack surfaces, and increasing digitization of business processes creating new vulnerability categories. The specialty insurance market responds by developing comprehensive cyber liability products covering data protection costs, business interruption losses, and regulatory fines while providing risk management services that traditional insurers cannot offer.
Climate Change and Environmental Risk Intensification:
Climate change manifestations including extreme weather events, environmental liability exposures, and sustainability regulatory requirements are driving specialty insurance demand across multiple sectors. This driver influences market growth through increasing frequency and severity of natural disasters requiring specialized catastrophe coverage, emerging environmental liability regulations creating compliance-driven insurance needs, and corporate sustainability initiatives demanding ESG-focused risk management solutions. The timeline spans immediate regulatory compliance needs and long-term climate adaptation strategies, influencing specialty insurers to develop innovative products addressing carbon liability, renewable energy project risks, and environmental restoration costs while providing strategic risk consulting services that position them as essential partners in organizational climate resilience planning.
Restraints
Limited Market Size and Scalability Challenges:
The specialty insurance market faces inherent growth limitations due to its focus on niche risk categories with relatively small addressable customer bases compared to standard insurance products. This constraint creates challenges through reduced economies of scale leading to higher operational costs, difficulty achieving significant market penetration within specialized segments, and limited ability to spread underwriting risks across large customer pools. The impact manifests in higher premium costs for specialty coverage, reduced profitability margins for insurers, and barriers to entry for new market participants requiring specialized expertise and capital investments. Mitigation strategies include portfolio diversification across multiple specialty lines, technology adoption to reduce operational costs, and strategic partnerships enabling shared expertise and risk distribution while maintaining specialized market focus.
Regulatory Complexity and Compliance Costs:
The specialty insurance market operates within complex regulatory frameworks that vary significantly across jurisdictions and specialty lines, creating substantial compliance costs and operational complexities. This restraint impacts market growth through increased regulatory capital requirements for specialized coverage, lengthy approval processes for new product development, and varying regulatory standards across international markets limiting scalability. Historical impacts include market consolidation as smaller players exit due to compliance costs, while cross-regional impacts create barriers to international expansion and product standardization. The regulatory burden particularly affects emerging specialty lines where regulatory frameworks are still developing, creating uncertainty for insurers and limiting innovation in coverage development while increasing time-to-market for new specialty insurance products.
Opportunities
Agricultural Sector Risk Evolution and Technology Integration:
The agricultural sector presents significant expansion opportunities for specialty insurance through emerging risks from climate change, technology adoption, and evolving farming practices requiring specialized coverage solutions. This opportunity encompasses crop insurance innovations addressing extreme weather patterns, livestock coverage for disease outbreaks, and technology-related risks from precision farming equipment and drone operations. The growth potential spans sustainable agriculture practices requiring ESG-compliant coverage, organic farming operations needing specialized liability protection, and agtech startups seeking comprehensive risk management solutions. Success enablers include developing expertise in agricultural risk assessment, establishing relationships with farming cooperatives and agtech companies, and creating flexible coverage options addressing seasonal risk variations while providing value-added services including risk prevention consulting and loss mitigation support.
Emerging Technology and Space Commerce Insurance:
The expanding space economy and emerging technology sectors offer substantial growth opportunities for specialty insurers willing to develop expertise in novel risk categories. This opportunity includes satellite insurance for commercial space ventures, coverage for space tourism operations, and protection for emerging technologies like quantum computing and advanced AI systems. Growth potential extends to autonomous vehicle liability coverage, drone operation insurance, and biotechnology research protection requiring specialized underwriting approaches. Success factors include early market entry establishing competitive advantages, partnerships with technology companies providing risk assessment data, and flexible product development capabilities adapting to rapidly evolving risk landscapes while maintaining underwriting discipline and developing specialized claims handling expertise for complex technology-related losses.
Trends
Artificial Intelligence Integration in Risk Assessment and Claims Processing:
The specialty insurance market is experiencing transformation through AI integration enhancing underwriting accuracy, claims processing efficiency, and fraud detection capabilities across specialized coverage lines. This trend focuses on machine learning algorithms analyzing complex risk data from multiple sources, natural language processing automating policy documentation and claims analysis, and predictive analytics improving risk pricing for specialized coverage categories. The transformation enables faster underwriting decisions for complex specialty risks, improved claims handling through automated damage assessment and settlement processing, and enhanced fraud detection through pattern recognition across specialized claims types. This technological evolution positions specialty insurers to handle increasingly complex risks while reducing operational costs and improving customer experience through streamlined processes and more accurate risk pricing.
ESG Integration and Sustainable Risk Management Focus:
Environmental, Social, and Governance (ESG) considerations are increasingly influencing specialty insurance through regulatory requirements, investor expectations, and corporate sustainability initiatives creating new coverage categories and risk assessment criteria. This behavioral and regulatory shift manifests through demand for ESG-compliant coverage options, integration of climate risk factors in underwriting processes, and development of insurance products supporting sustainable business practices. The trend influences specialty insurers to develop carbon liability coverage, renewable energy project insurance, and social impact bonds protection while incorporating ESG metrics into risk assessment frameworks. This evolution creates opportunities for specialty insurers to differentiate through sustainable insurance products, attract ESG-focused clients, and position themselves as partners in corporate sustainability initiatives while developing expertise in emerging ESG-related risk categories.
Recent Development
In June 2025: Ryan Specialty Group Holdings, Inc., a prominent international specialty insurance firm, has announced the execution of a definitive agreement to acquire J.M. Wilson Corporation ("JM Wilson"), a Michigan-based specialty insurance operation. This strategic acquisition will integrate JM Wilson's business operations into RT Binding Authority, Ryan Specialty's dedicated binding authority division, further expanding the company's specialty insurance capabilities and market presence.
In May 2025: Starwind Specialty Insurance Services, operating as a subsidiary of CRC Group, has significantly strengthened its market position through the strategic introduction of four comprehensive insurance programs designed to address emerging and specialized risk categories in today's evolving business landscape. This expansion represents a calculated move to diversify the company's underwriting capabilities while responding to increasing market demand for tailored coverage solutions across high-growth and niche industry sectors.
Frequently Asked Questions
How big is the Specialty Insurance Market?
Specialty Insurance Market
Who are the major players in the Specialty Insurance Market?
American International Group (AIG), Chubb Limited, Allianz SE, Kinsale Capital Group, Beazley, Hiscox Ltd, Munich Re, Tokio Marine Holdings, QBE Insurance Group
Which segments covered the Specialty Insurance Market?
Type (Marine, Aviation and Transport (MAT) Insurance, Professional Liability Insurance, Property Insurance, Cyber Liability Insurance, Directors and Officers (D&O) Insurance, Entertainment Insurance, Art Insurance, Others), Distribution Channel (Brokers, Non-Brokers (Direct Sales)), End User (Business, Individuals)
How can this market research report help my business make strategic decisions?
Our market research reports provide actionable intelligence, including verified market size data, CAGR projections, competitive benchmarking, and segment-level opportunity analysis. These insights support strategic planning, investment decisions, product development, and market entry strategies for enterprises and startups alike.
How frequently is the data updated?
We continuously monitor industry developments and update our reports to reflect regulatory changes, technological advancements, and macroeconomic shifts. Updated editions ensure you receive the latest market intelligence.