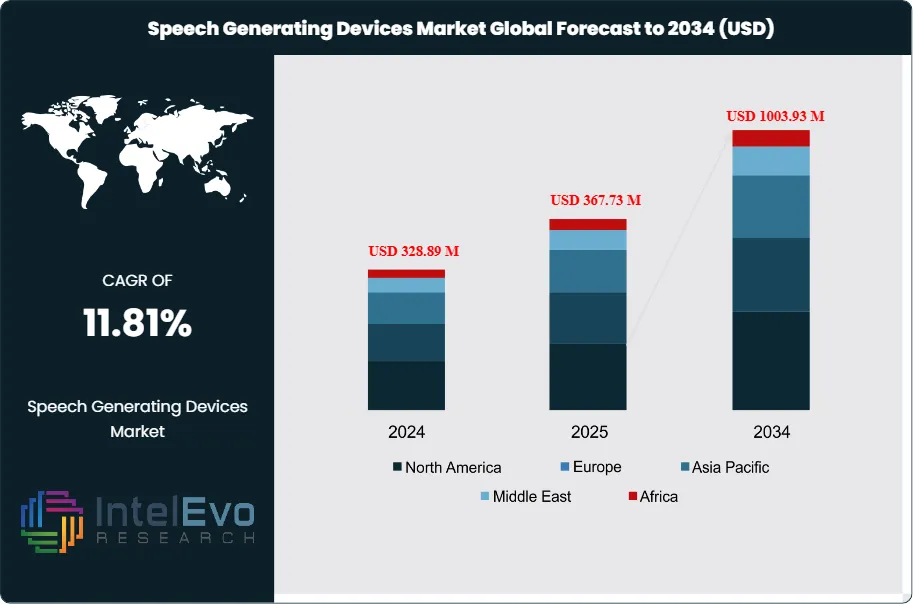
The Speech Generating Devices Market size is expected to be worth around USD 1003.93 Million by 2034, from USD 328.89 Million in 2024, growing at a CAGR of 11.81% during the forecast period from 2024 to 2034. The Speech Generating Devices (SGD) market encompasses electronic devices that enable users with speech impairments to communicate by generating voice output. The market size was valued between USD 282.7-291.09 million in 2024, with projections reaching USD 583.35 million to USD 1,013.9 million by 2033-2034, depending on various growth scenarios and technological adoption rates. These devices serve as vital communication aids for individuals with conditions such as autism spectrum disorder, cerebral palsy, amyotrophic lateral sclerosis (ALS), and acquired brain injuries.
The SGD market is experiencing robust growth driven by increasing awareness of assistive technologies and rising incidence of neurological disorders. Technological advancements are leading to the development of innovative speech generating devices, with portable and user-friendly devices gaining significant traction. The integration of artificial intelligence and machine learning capabilities has enhanced the functionality and user experience of modern SGDs, making them more accessible to diverse user populations.
North America leads the SGD market in 2024, driven by significant healthcare investments, strong demand for dedicated speech generation devices, and a well-established distribution network. East Asia is estimated to capture significant share of the global speech generating device market share in 2024, representing a significant growth opportunity driven by increasing healthcare awareness and technological adoption.
The COVID-19 pandemic initially disrupted manufacturing and supply chains but ultimately accelerated the adoption of digital health solutions. Remote therapy sessions and telehealth services increased demand for portable and user-friendly SGDs that could be effectively used in home settings, leading to innovation in cloud-based and mobile-compatible devices.
Global supply chain disruptions have affected component availability and manufacturing costs, particularly impacting the production of advanced electronic components essential for SGD functionality. However, this has also encouraged regional manufacturing initiatives and diversification of supply chains, potentially benefiting local markets in the long term.
Key Takeaways
Market Growth: The Speech Generating Devices Market is expected to reach USD 1003.93 Million by 2034, propelled by increasing awareness of communication disorders, rising prevalence of autism and neurological conditions, and technological advancements in AI-powered speech synthesis.
ProductTypeDominance: Speech Generating Text-to-Speech Devices lead due to advanced AI integration and customization capabilities.
DeviceTypeDominance: Fixed Display Devices dominate, driven by cost-effectiveness and user familiarity.
DistributionChannelDominance: Online Stores hold a leading position, owing to convenience and accessibility.
EndUserDominance: Hospitals dominate the SGD end-user market due to high patient volumes and established clinical expertise in device selection and implementation.
Driver: Rising autism prevalence awareness and technological advancements in AI-powered speech synthesis are accelerating market growth through improved accessibility and communication outcomes.
Restraint: High device costs and limited insurance coverage create barriers, particularly for individuals and families without comprehensive healthcare benefits.
Opportunity: Emerging markets expansion and integration of AI/machine learning technologies offer significant growth potential through improved affordability and enhanced communication capabilities.
Trend: Personalization through AI and cloud-based solutions are transforming the market by enabling customized communication experiences and remote therapy delivery.
RegionalAnalysis: North America leads owing to advanced healthcare infrastructure and strong reimbursement policies. Asia-Pacific regions show high promise due to increasing healthcare awareness and growing elderly population.
Product Type Analysis:
Speech Generating Text-to-Speech Devices dominate the market through their sophisticated artificial intelligence integration that delivers highly natural communication experiences for users with speech impairments. These advanced systems leverage machine learning algorithms to provide personalized voice synthesis that closely mimics natural speech patterns, enabling more authentic social interactions and improved quality of life for users. The customizable voice options allow individuals to select or even preserve their own voice characteristics through voice banking technology, maintaining personal identity in communication. AI-powered features include contextual understanding, predictive text capabilities, and adaptive learning that improves communication efficiency over time.
Device Type Analysis:
Fixed display devices maintain market leadership through their established reliability and cost-effectiveness, providing users with consistent, predictable interface experiences that have proven successful over time. Their dominance reflects the comfort level that existing users, caregivers, and clinicians have developed with familiar interface designs that require minimal learning curves and offer dependable performance. However, dynamic display devices are experiencing significant growth momentum as they deliver enhanced flexibility and adaptability for diverse communication needs. These advanced systems can modify their interface layouts, vocabulary sets, and communication options based on specific contexts, user preferences, and evolving requirements.
Distribution Channel Analysis:
Distribution channel analysis reveals a transformative shift in SGD accessibility through evolving purchasing pathways that reflect changing consumer behaviors and technological adoption. Online platforms have emerged as significant distribution channels, offering enhanced convenience through comprehensive product comparison tools, detailed specifications, and competitive pricing structures that appeal to cost-conscious consumers and caregivers. These digital channels provide accessibility advantages for users in remote locations and enable informed decision-making through user reviews and educational resources. Traditional medical supply stores continue to play crucial roles, particularly in institutional procurement processes where professional consultation and hands-on evaluation are essential. These established channels offer specialized expertise, device trials, insurance navigation support, and ongoing technical assistance that remain valuable for complex device selection decisions.
End User Analysis:
Hospitals dominate as primary end-users due to their comprehensive patient volumes, well-established procurement frameworks, and clinical specialists who possess the expertise necessary for appropriate device selection and implementation strategies. These facilities benefit from dedicated speech-language pathology departments and multidisciplinary teams that can effectively assess patient needs and coordinate device integration into treatment plans. Clinics serve as essential secondary markets, functioning as primary contact points for ongoing therapeutic support, device training, and long-term user education. Academic and research institutions represent a vital market segment focused on advancing SGD technology through research initiatives, device development programs, and professional training that prepares future clinicians and researchers in assistive technology implementation and innovation.
Region Analysis:
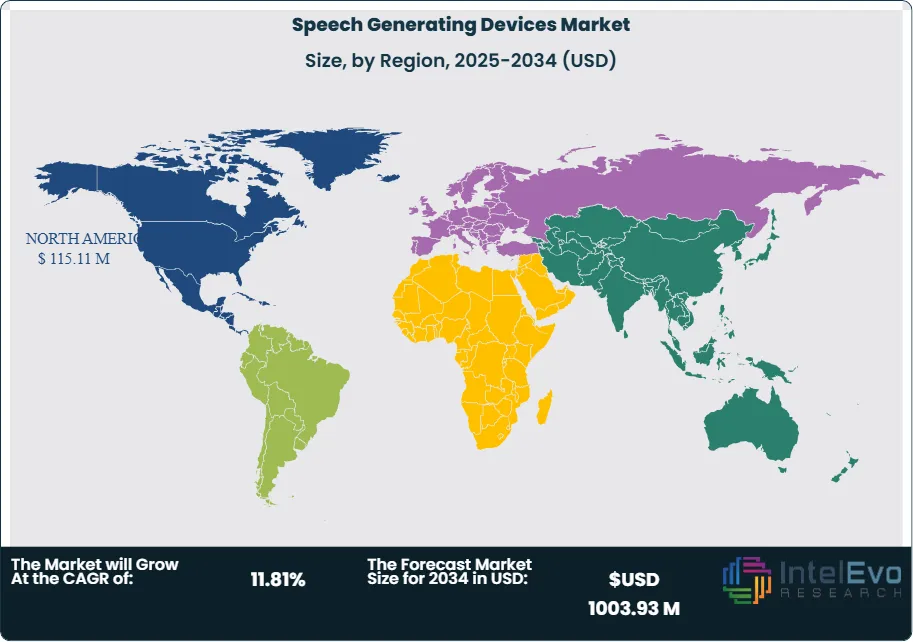
North America Leads With 35% Market Share In Speech Generating Devices Market. North America leads the SGD market, driven by significant healthcare investments, strong demand for dedicated speech generation devices, and a well-established distribution network. The United States specifically represents the largest single-country market, benefiting from comprehensive healthcare infrastructure, favorable reimbursement policies, and high awareness of assistive technologies among healthcare providers and families.
Asia-Pacific represents a significant growth opportunity, fueled by rapidly aging populations, increasing healthcare expenditure, and growing awareness of assistive technologies. Countries like Japan and South Korea are leading adoption due to advanced technology infrastructure and government support for accessibility initiatives.
Europe maintains a substantial market presence, particularly in countries with strong social healthcare systems that provide coverage for assistive devices. The region's focus on inclusive education and workplace accessibility drives consistent demand.
Emerging markets in Latin America, Middle East & Africa show promising growth potential, though adoption rates remain limited by economic factors and healthcare infrastructure development. These regions are expected to experience accelerated growth as economic conditions improve and awareness of SGD benefits increases among healthcare professionals and communities.
Product Type (Speech Generating Synthesized Speech Devices, Speech Generating Text-to-Speech Devices, Speech Generating Picture Communicators); Device Type (Fixed Display Devices, Dynamic Display Devices); Distribution Channel (Medical Supply Stores, Online Stores, Other Channels); End User (Hospitals, Clinics, Academic and Research Institutes)
Research Methodology
Primary Research- 100 Interviews of Stakeholders
Secondary Research
Desk Research
Regional scope
North America (United States, Canada, Mexico)
Latin America (Brazil, Argentina, Columbia)
East Asia And Pacific (China, Japan, South Korea, Australia, Cambodia, Fiji, Indonesia)
Sea And South Asia (India, Singapore, Thailand, Taiwan, Malaysia)
Eastern Europe (Poland, Russia, Czech Republic, Romania)
Western Europe (Germany, U.K., France, Spain, Itlay)
Middle East & Africa (GCC Countries, Egypt, Nigeria, South Africa, Israel)
Customization for segments, region/country-level will be provided. Moreover, additional customization can be done based on the requirements.
Pricing and Purchase Options
Avail customized purchase options to meet your exact research needs. We have three licenses to opt for: Single User License, Multi-User License (Up to 5 Users), Corporate Use License (Unlimited User and Printable PDF).
TABLE OF CONTENTS
1. EXECUTIVE SUMMARY
1.1. MARKET SNAPSHOT
1.2. KEY FINDINGS & INSIGHTS
1.3. ANALYST RECOMMENDATIONS
1.4. FUTURE OUTLOOK
2. RESEARCH METHODOLOGY
2.1. MARKET DEFINITION & SCOPE
2.2. RESEARCH OBJECTIVES: PRIMARY & SECONDARY DATA SOURCES
2.3. DATA COLLECTION SOURCES
2.3.1. COVERAGE OF 100+ PRIMARY RESEARCH/CONSULTATION CALLS WITH INDUSTRY STAKEHOLDERS
FIGURE 17 NORTH AMERICA SPEECH GENERATING DEVICES CURRENT AND FUTURE TYPE ANALYSIS, 2025–2034, (USD MILLION)
FIGURE 18 NORTH AMERICA SPEECH GENERATING DEVICES CURRENT AND FUTURE END USER ANALYSIS, 2025–2034, (USD MILLION)
FIGURE 19 MARKET SHARE BY COUNTRY
FIGURE 20 LATIN AMERICA SPEECH GENERATING DEVICES CURRENT AND FUTURE TYPE ANALYSIS, 2025–2034, (USD MILLION)
FIGURE 21 LATIN AMERICA SPEECH GENERATING DEVICES CURRENT AND FUTURE END USER ANALYSIS, 2025–2034, (USD MILLION)
FIGURE 22 MARKET SHARE BY COUNTRY
FIGURE 23 EASTERN EUROPE SPEECH GENERATING DEVICES CURRENT AND FUTURE TYPE ANALYSIS, 2025–2034, (USD MILLION)
FIGURE 24 EASTERN EUROPE SPEECH GENERATING DEVICES CURRENT AND FUTURE END USER ANALYSIS, 2025–2034, (USD MILLION)
FIGURE 25 MARKET SHARE BY COUNTRY
FIGURE 26 WESTERN EUROPE SPEECH GENERATING DEVICES CURRENT AND FUTURE TYPE ANALYSIS, 2025–2034, (USD MILLION)
FIGURE 27 WESTERN EUROPE SPEECH GENERATING DEVICES CURRENT AND FUTURE END USER ANALYSIS, 2025–2034, (USD MILLION)
FIGURE 28 MARKET SHARE BY COUNTRY
FIGURE 29 EAST ASIA AND PACIFIC SPEECH GENERATING DEVICES CURRENT AND FUTURE TYPE ANALYSIS, 2025–2034, (USD MILLION)
FIGURE 30 EAST ASIA AND PACIFIC SPEECH GENERATING DEVICES CURRENT AND FUTURE END USER ANALYSIS, 2025–2034, (USD MILLION)
FIGURE 31 MARKET SHARE BY COUNTRY
FIGURE 32 SEA AND SOUTH ASIA SPEECH GENERATING DEVICES CURRENT AND FUTURE TYPE ANALYSIS, 2025–2034, (USD MILLION)
FIGURE 33 SEA AND SOUTH ASIA SPEECH GENERATING DEVICES CURRENT AND FUTURE END USER ANALYSIS, 2025–2034, (USD MILLION)
FIGURE 34 MARKET SHARE BY COUNTRY
FIGURE 35 MIDDLE EAST AND AFRICA SPEECH GENERATING DEVICES CURRENT AND FUTURE TYPE ANALYSIS, 2025–2034, (USD MILLION)
FIGURE 36 MIDDLE EAST AND AFRICA SPEECH GENERATING DEVICES CURRENT AND FUTURE END USER ANALYSIS, 2025–2034, (USD MILLION)
FIGURE 37 NORTH AMERICA SPEECH GENERATING DEVICES CURRENT AND FUTURE MARKET VOLUME SHARE REGIONAL ANALYSIS, 2025–2034, (USD MILLION)
FIGURE 38 U.S. SPEECH GENERATING DEVICES CURRENT AND FUTURE TYPE ANALYSIS, 2025–2034, (USD MILLION)
FIGURE 39 U.S. SPEECH GENERATING DEVICES CURRENT AND FUTURE END USER ANALYSIS, 2025–2034, (USD MILLION)
FIGURE 40 CANADA SPEECH GENERATING DEVICES CURRENT AND FUTURE TYPE ANALYSIS, 2025–2034, (USD MILLION)
FIGURE 41 CANADA SPEECH GENERATING DEVICES CURRENT AND FUTURE END USER ANALYSIS, 2025–2034, (USD MILLION)
FIGURE 42 LATIN AMERICA SPEECH GENERATING DEVICES CURRENT AND FUTURE MARKET VOLUME SHARE REGIONAL ANALYSIS, 2025–2034, (USD MILLION)
FIGURE 43 MEXICO SPEECH GENERATING DEVICES CURRENT AND FUTURE TYPE ANALYSIS, 2025–2034, (USD MILLION)
FIGURE 44 MEXICO SPEECH GENERATING DEVICES CURRENT AND FUTURE END USER ANALYSIS, 2025–2034, (USD MILLION)
FIGURE 45 BRAZIL SPEECH GENERATING DEVICES CURRENT AND FUTURE TYPE ANALYSIS, 2025–2034, (USD MILLION)
FIGURE 46 BRAZIL SPEECH GENERATING DEVICES CURRENT AND FUTURE END USER ANALYSIS, 2025–2034, (USD MILLION)
FIGURE 47 ARGENTINA SPEECH GENERATING DEVICES CURRENT AND FUTURE TYPE ANALYSIS, 2025–2034, (USD MILLION)
FIGURE 48 ARGENTINA SPEECH GENERATING DEVICES CURRENT AND FUTURE END USER ANALYSIS, 2025–2034, (USD MILLION)
FIGURE 49 COLUMBIA SPEECH GENERATING DEVICES CURRENT AND FUTURE TYPE ANALYSIS, 2025–2034, (USD MILLION)
FIGURE 50 COLUMBIA SPEECH GENERATING DEVICES CURRENT AND FUTURE END USER ANALYSIS, 2025–2034, (USD MILLION)
FIGURE 51 REST OF LATIN AMERICA SPEECH GENERATING DEVICES CURRENT AND FUTURE TYPE ANALYSIS, 2025–2034, (USD MILLION)
FIGURE 52 REST OF LATIN AMERICA SPEECH GENERATING DEVICES CURRENT AND FUTURE END USER ANALYSIS, 2025–2034, (USD MILLION)
FIGURE 53 EASTERN EUROPE SPEECH GENERATING DEVICES CURRENT AND FUTURE MARKET VOLUME SHARE REGIONAL ANALYSIS, 2025–2034, (USD MILLION)
FIGURE 54 POLAND SPEECH GENERATING DEVICES CURRENT AND FUTURE TYPE ANALYSIS, 2025–2034, (USD MILLION)
FIGURE 55 POLAND SPEECH GENERATING DEVICES CURRENT AND FUTURE END USER ANALYSIS, 2025–2034, (USD MILLION)
FIGURE 56 RUSSIA SPEECH GENERATING DEVICES CURRENT AND FUTURE TYPE ANALYSIS, 2025–2034, (USD MILLION)
FIGURE 57 RUSSIA SPEECH GENERATING DEVICES CURRENT AND FUTURE END USER ANALYSIS, 2025–2034, (USD MILLION)
FIGURE 58 CZECH REPUBLIC SPEECH GENERATING DEVICES CURRENT AND FUTURE TYPE ANALYSIS, 2025–2034, (USD MILLION)
FIGURE 59 CZECH REPUBLIC SPEECH GENERATING DEVICES CURRENT AND FUTURE END USER ANALYSIS, 2025–2034, (USD MILLION)
FIGURE 60 ROMANIA SPEECH GENERATING DEVICES CURRENT AND FUTURE TYPE ANALYSIS, 2025–2034, (USD MILLION)
FIGURE 61 ROMANIA SPEECH GENERATING DEVICES CURRENT AND FUTURE END USER ANALYSIS, 2025–2034, (USD MILLION)
FIGURE 62 REST OF EASTERN EUROPE SPEECH GENERATING DEVICES CURRENT AND FUTURE TYPE ANALYSIS, 2025–2034, (USD MILLION)
FIGURE 63 REST OF EASTERN EUROPE SPEECH GENERATING DEVICES CURRENT AND FUTURE END USER ANALYSIS, 2025–2034, (USD MILLION)
FIGURE 64 WESTERN EUROPE SPEECH GENERATING DEVICES CURRENT AND FUTURE MARKET VOLUME SHARE REGIONAL ANALYSIS, 2025–2034, (USD MILLION)
FIGURE 65 GERMANY SPEECH GENERATING DEVICES CURRENT AND FUTURE TYPE ANALYSIS, 2025–2034, (USD MILLION)
FIGURE 66 GERMANY SPEECH GENERATING DEVICES CURRENT AND FUTURE END USER ANALYSIS, 2025–2034, (USD MILLION)
FIGURE 67 FRANCE SPEECH GENERATING DEVICES CURRENT AND FUTURE TYPE ANALYSIS, 2025–2034, (USD MILLION)
FIGURE 68 FRANCE SPEECH GENERATING DEVICES CURRENT AND FUTURE END USER ANALYSIS, 2025–2034, (USD MILLION)
FIGURE 69 UK SPEECH GENERATING DEVICES CURRENT AND FUTURE TYPE ANALYSIS, 2025–2034, (USD MILLION)
FIGURE 70 UK SPEECH GENERATING DEVICES CURRENT AND FUTURE END USER ANALYSIS, 2025–2034, (USD MILLION)
FIGURE 71 SPAIN SPEECH GENERATING DEVICES CURRENT AND FUTURE TYPE ANALYSIS, 2025–2034, (USD MILLION)
FIGURE 72 SPAIN SPEECH GENERATING DEVICES CURRENT AND FUTURE END USER ANALYSIS, 2025–2034, (USD MILLION)
FIGURE 73 ITALY SPEECH GENERATING DEVICES CURRENT AND FUTURE TYPE ANALYSIS, 2025–2034, (USD MILLION)
FIGURE 74 ITALY SPEECH GENERATING DEVICES CURRENT AND FUTURE END USER ANALYSIS, 2025–2034, (USD MILLION)
FIGURE 75 REST OF WESTERN EUROPE SPEECH GENERATING DEVICES CURRENT AND FUTURE TYPE ANALYSIS, 2025–2034, (USD MILLION)
FIGURE 76 REST OF WESTERN EUROPE SPEECH GENERATING DEVICES CURRENT AND FUTURE END USER ANALYSIS, 2025–2034, (USD MILLION)
FIGURE 77 EAST ASIA AND PACIFIC SPEECH GENERATING DEVICES CURRENT AND FUTURE MARKET VOLUME SHARE REGIONAL ANALYSIS, 2025–2034, (USD MILLION)
FIGURE 78 CHINA SPEECH GENERATING DEVICES CURRENT AND FUTURE TYPE ANALYSIS, 2025–2034, (USD MILLION)
FIGURE 79 CHINA SPEECH GENERATING DEVICES CURRENT AND FUTURE END USER ANALYSIS, 2025–2034, (USD MILLION)
FIGURE 80 JAPAN SPEECH GENERATING DEVICES CURRENT AND FUTURE TYPE ANALYSIS, 2025–2034, (USD MILLION)
FIGURE 81 JAPAN SPEECH GENERATING DEVICES CURRENT AND FUTURE END USER ANALYSIS, 2025–2034, (USD MILLION)
FIGURE 82 AUSTRALIA SPEECH GENERATING DEVICES CURRENT AND FUTURE TYPE ANALYSIS, 2025–2034, (USD MILLION)
FIGURE 83 AUSTRALIA SPEECH GENERATING DEVICES CURRENT AND FUTURE END USER ANALYSIS, 2025–2034, (USD MILLION)
FIGURE 84 CAMBODIA SPEECH GENERATING DEVICES CURRENT AND FUTURE TYPE ANALYSIS, 2025–2034, (USD MILLION)
FIGURE 85 CAMBODIA SPEECH GENERATING DEVICES CURRENT AND FUTURE END USER ANALYSIS, 2025–2034, (USD MILLION)
FIGURE 86 FIJI SPEECH GENERATING DEVICES CURRENT AND FUTURE TYPE ANALYSIS, 2025–2034, (USD MILLION)
FIGURE 87 FIJI SPEECH GENERATING DEVICES CURRENT AND FUTURE END USER ANALYSIS, 2025–2034, (USD MILLION)
FIGURE 88 INDONESIA SPEECH GENERATING DEVICES CURRENT AND FUTURE TYPE ANALYSIS, 2025–2034, (USD MILLION)
FIGURE 89 INDONESIA SPEECH GENERATING DEVICES CURRENT AND FUTURE END USER ANALYSIS, 2025–2034, (USD MILLION)
FIGURE 90 SOUTH KOREA SPEECH GENERATING DEVICES CURRENT AND FUTURE TYPE ANALYSIS, 2025–2034, (USD MILLION)
FIGURE 91 SOUTH KOREA SPEECH GENERATING DEVICES CURRENT AND FUTURE END USER ANALYSIS, 2025–2034, (USD MILLION)
FIGURE 92 REST OF EAST ASIA AND PACIFIC SPEECH GENERATING DEVICES CURRENT AND FUTURE TYPE ANALYSIS, 2025–2034, (USD MILLION)
FIGURE 93 REST OF EAST ASIA AND PACIFIC SPEECH GENERATING DEVICES CURRENT AND FUTURE END USER ANALYSIS, 2025–2034, (USD MILLION)
FIGURE 94 SEA AND SOUTH ASIA SPEECH GENERATING DEVICES CURRENT AND FUTURE MARKET VOLUME SHARE REGIONAL ANALYSIS, 2025–2034, (USD MILLION)
FIGURE 95 BANGLADESH SPEECH GENERATING DEVICES CURRENT AND FUTURE TYPE ANALYSIS, 2025–2034, (USD MILLION)
FIGURE 96 BANGLADESH SPEECH GENERATING DEVICES CURRENT AND FUTURE END USER ANALYSIS, 2025–2034, (USD MILLION)
FIGURE 97 NEW ZEALAND SPEECH GENERATING DEVICES CURRENT AND FUTURE TYPE ANALYSIS, 2025–2034, (USD MILLION)
FIGURE 98 NEW ZEALAND SPEECH GENERATING DEVICES CURRENT AND FUTURE END USER ANALYSIS, 2025–2034, (USD MILLION)
FIGURE 99 INDIA SPEECH GENERATING DEVICES CURRENT AND FUTURE TYPE ANALYSIS, 2025–2034, (USD MILLION)
FIGURE 100 INDIA SPEECH GENERATING DEVICES CURRENT AND FUTURE END USER ANALYSIS, 2025–2034, (USD MILLION)
FIGURE 101 SINGAPORE SPEECH GENERATING DEVICES CURRENT AND FUTURE TYPE ANALYSIS, 2025–2034, (USD MILLION)
FIGURE 102 SINGAPORE SPEECH GENERATING DEVICES CURRENT AND FUTURE END USER ANALYSIS, 2025–2034, (USD MILLION)
FIGURE 103 THAILAND SPEECH GENERATING DEVICES CURRENT AND FUTURE TYPE ANALYSIS, 2025–2034, (USD MILLION)
FIGURE 104 THAILAND SPEECH GENERATING DEVICES CURRENT AND FUTURE END USER ANALYSIS, 2025–2034, (USD MILLION)
FIGURE 105 TAIWAN SPEECH GENERATING DEVICES CURRENT AND FUTURE TYPE ANALYSIS, 2025–2034, (USD MILLION)
FIGURE 106 TAIWAN SPEECH GENERATING DEVICES CURRENT AND FUTURE END USER ANALYSIS, 2025–2034, (USD MILLION)
FIGURE 107 MALAYSIA SPEECH GENERATING DEVICES CURRENT AND FUTURE TYPE ANALYSIS, 2025–2034, (USD MILLION)
FIGURE 108 MALAYSIA SPEECH GENERATING DEVICES CURRENT AND FUTURE END USER ANALYSIS, 2025–2034, (USD MILLION)
FIGURE 109 REST OF SEA AND SOUTH ASIA SPEECH GENERATING DEVICES CURRENT AND FUTURE TYPE ANALYSIS, 2025–2034, (USD MILLION)
FIGURE 110 REST OF SEA AND SOUTH ASIA SPEECH GENERATING DEVICES CURRENT AND FUTURE END USER ANALYSIS, 2025–2034, (USD MILLION)
FIGURE 111 MIDDLE EAST AND AFRICA SPEECH GENERATING DEVICES CURRENT AND FUTURE MARKET VOLUME SHARE REGIONAL ANALYSIS, 2025–2034, (USD MILLION)
FIGURE 112 GCC COUNTRIES SPEECH GENERATING DEVICES CURRENT AND FUTURE TYPE ANALYSIS, 2025–2034, (USD MILLION)
FIGURE 113 GCC COUNTRIES SPEECH GENERATING DEVICES CURRENT AND FUTURE END USER ANALYSIS, 2025–2034, (USD MILLION)
FIGURE 114 SAUDI ARABIA SPEECH GENERATING DEVICES CURRENT AND FUTURE TYPE ANALYSIS, 2025–2034, (USD MILLION)
FIGURE 115 SAUDI ARABIA SPEECH GENERATING DEVICES CURRENT AND FUTURE END USER ANALYSIS, 2025–2034, (USD MILLION)
FIGURE 116 UAE SPEECH GENERATING DEVICES CURRENT AND FUTURE TYPE ANALYSIS, 2025–2034, (USD MILLION)
FIGURE 117 UAE SPEECH GENERATING DEVICES CURRENT AND FUTURE END USER ANALYSIS, 2025–2034, (USD MILLION)
FIGURE 118 BAHRAIN SPEECH GENERATING DEVICES CURRENT AND FUTURE TYPE ANALYSIS, 2025–2034, (USD MILLION)
FIGURE 119 BAHRAIN SPEECH GENERATING DEVICES CURRENT AND FUTURE END USER ANALYSIS, 2025–2034, (USD MILLION)
FIGURE 120 KUWAIT SPEECH GENERATING DEVICES CURRENT AND FUTURE TYPE ANALYSIS, 2025–2034, (USD MILLION)
FIGURE 121 KUWAIT SPEECH GENERATING DEVICES CURRENT AND FUTURE END USER ANALYSIS, 2025–2034, (USD MILLION)
FIGURE 122 OMAN SPEECH GENERATING DEVICES CURRENT AND FUTURE TYPE ANALYSIS, 2025–2034, (USD MILLION)
FIGURE 123 OMAN SPEECH GENERATING DEVICES CURRENT AND FUTURE END USER ANALYSIS, 2025–2034, (USD MILLION)
FIGURE 124 QATAR SPEECH GENERATING DEVICES CURRENT AND FUTURE TYPE ANALYSIS, 2025–2034, (USD MILLION)
FIGURE 125 QATAR SPEECH GENERATING DEVICES CURRENT AND FUTURE END USER ANALYSIS, 2025–2034, (USD MILLION)
FIGURE 126 EGYPT SPEECH GENERATING DEVICES CURRENT AND FUTURE TYPE ANALYSIS, 2025–2034, (USD MILLION)
FIGURE 127 EGYPT SPEECH GENERATING DEVICES CURRENT AND FUTURE END USER ANALYSIS, 2025–2034, (USD MILLION)
FIGURE 128 NIGERIA SPEECH GENERATING DEVICES CURRENT AND FUTURE TYPE ANALYSIS, 2025–2034, (USD MILLION)
FIGURE 129 NIGERIA SPEECH GENERATING DEVICES CURRENT AND FUTURE END USER ANALYSIS, 2025–2034, (USD MILLION)
FIGURE 130 SOUTH AFRICA SPEECH GENERATING DEVICES CURRENT AND FUTURE TYPE ANALYSIS, 2025–2034, (USD MILLION)
FIGURE 131 SOUTH AFRICA SPEECH GENERATING DEVICES CURRENT AND FUTURE END USER ANALYSIS, 2025–2034, (USD MILLION)
FIGURE 132 ISRAEL SPEECH GENERATING DEVICES CURRENT AND FUTURE TYPE ANALYSIS, 2025–2034, (USD MILLION)
FIGURE 133 ISRAEL SPEECH GENERATING DEVICES CURRENT AND FUTURE END USER ANALYSIS, 2025–2034, (USD MILLION)
FIGURE 134 REST OF MEA SPEECH GENERATING DEVICES CURRENT AND FUTURE TYPE ANALYSIS, 2025–2034, (USD MILLION)
FIGURE 135 REST OF MEA SPEECH GENERATING DEVICES CURRENT AND FUTURE END USER ANALYSIS, 2025–2034, (USD MILLION)
FIGURE 136 U. S. MARKET SHARE ANALYSIS BY TYPE (2024)
FIGURE 137 U. S. MARKET SHARE ANALYSIS BY END USER (2024)
FIGURE 138 CANADA MARKET SHARE ANALYSIS BY TYPE (2024)
FIGURE 139 CANADA MARKET SHARE ANALYSIS BY END USER (2024)
FIGURE 140 MEXICO MARKET SHARE ANALYSIS BY TYPE (2024)
FIGURE 141 MEXICO MARKET SHARE ANALYSIS BY END USER (2024)
FIGURE 142 CHINA MARKET SHARE ANALYSIS BY TYPE (2024)
FIGURE 143 CHINA MARKET SHARE ANALYSIS BY END USER (2024)
FIGURE 144 JAPAN MARKET SHARE ANALYSIS BY TYPE (2024)
FIGURE 145 JAPAN MARKET SHARE ANALYSIS BY END USER (2024)
FIGURE 146 INDIA MARKET SHARE ANALYSIS BY TYPE (2024)
FIGURE 147 INDIA MARKET SHARE ANALYSIS BY END USER (2024)
FIGURE 148 SOUTH KOREA MARKET SHARE ANALYSIS BY TYPE (2024)
FIGURE 149 SOUTH KOREA MARKET SHARE ANALYSIS BY END USER (2024)
FIGURE 150 SAUDI ARABIA MARKET SHARE ANALYSIS BY TYPE (2024)
FIGURE 151 SAUDI ARABIA MARKET SHARE ANALYSIS BY END USER (2024)
FIGURE 152 UAE MARKET SHARE ANALYSIS BY TYPE (2024)
FIGURE 153 UAE MARKET SHARE ANALYSIS BY END USER (2024)
FIGURE 154 EGYPT MARKET SHARE ANALYSIS BY TYPE (2024)
FIGURE 155 EGYPT MARKET SHARE ANALYSIS BY END USER (2024)
FIGURE 156 NIGERIA MARKET SHARE ANALYSIS BY TYPE (2024)
FIGURE 157 NIGERIA MARKET SHARE ANALYSIS BY END USER (2024)
FIGURE 158 SOUTH AFRICA MARKET SHARE ANALYSIS BY TYPE (2024)
FIGURE 159 SOUTH AFRICA MARKET SHARE ANALYSIS BY END USER (2024)
FIGURE 160 GERMANY MARKET SHARE ANALYSIS BY TYPE (2024)
FIGURE 161 GERMANY MARKET SHARE ANALYSIS BY END USER (2024)
FIGURE 162 FRANCE MARKET SHARE ANALYSIS BY TYPE (2024)
FIGURE 163 FRANCE MARKET SHARE ANALYSIS BY END USER (2024)
FIGURE 164 UK MARKET SHARE ANALYSIS BY TYPE (2024)
FIGURE 165 UK MARKET SHARE ANALYSIS BY END USER (2024)
FIGURE 166 SPAIN MARKET SHARE ANALYSIS BY TYPE (2024)
FIGURE 167 SPAIN MARKET SHARE ANALYSIS BY END USER (2024)
FIGURE 168 ITALY MARKET SHARE ANALYSIS BY TYPE (2024)
FIGURE 169 ITALY MARKET SHARE ANALYSIS BY END USER (2024)
FIGURE 170 BRAZIL MARKET SHARE ANALYSIS BY TYPE (2024)
FIGURE 171 BRAZIL MARKET SHARE ANALYSIS BY END USER (2024)
FIGURE 172 ARGENTINA MARKET SHARE ANALYSIS BY TYPE (2024)
FIGURE 173 ARGENTINA MARKET SHARE ANALYSIS BY END USER (2024)
FIGURE 174 COLUMBIA MARKET SHARE ANALYSIS BY TYPE (2024)
FIGURE 175 COLUMBIA MARKET SHARE ANALYSIS BY END USER (2024)
FIGURE 176 GLOBAL SPEECH GENERATING DEVICES CURRENT AND FUTURE MARKET KEY COUNTRY LEVEL ANALYSIS, 2024–2034, (USD MILLION)
FIGURE 177 FINANCIAL OVERVIEW:
Key Players Analysis:
Tobii Dynavox: Tobii Dynavox maintains significant market share through comprehensive product portfolio spanning dedicated devices, eye-gaze systems, and software solutions. The company's strength lies in continuous innovation, particularly in eye-tracking technology, and extensive global distribution network. Strategic focus on research and development, clinical evidence generation, and partnerships with healthcare providers reinforces market position. Recent investments in AI-powered features and cloud-based platforms position the company for sustained growth in evolving market conditions.
PRC-Saltillo: PRC-Saltillo is one of the major players with specialization in dedicated SGDs and strong relationships within the speech-language pathology community. The company's competitive advantage stems from robust device design, clinical validation, and comprehensive training programs for users and professionals. Focus on evidence-based solutions and collaboration with researchers enhances credibility and drives adoption in clinical settings. Expansion into tablet-based solutions and international markets supports growth objectives while maintaining core strengths in traditional SGD segments.
Lingraphica: Lingraphica captures market through specialization in aphasia and stroke recovery solutions, offering unique positioning in the adult acquired communication disorder segment. The company's strength lies in evidence-based therapy integration, clinical research partnerships, and comprehensive support services for users and families. Focus on outcomes measurement and insurance reimbursement navigation differentiates the company in the healthcare market, while expansion into broader communication disorder segments drives growth opportunities.
AssistiveWare: AssistiveWare through the popular Proloquo2Go app and focus on symbol-based communication solutions show strong hold in market. The company's competitive advantage lies in user-friendly design, affordability, and strong presence in the iOS ecosystem. Continuous feature development, international language support, and partnerships with educational institutions support market expansion while maintaining cost-effectiveness compared to dedicated device alternatives.
Market Key Players
Tobii Dynavox
PRC-Saltillo
Lingraphica
AssistiveWare (Proloquo2Go)
Smartbox Assistive Technology
Jabbla
AbleNet
Compass by Komp
Therapy Box
Liberator Ltd.
Saztec International
Enabling Devices
Abilia Toby Churchill
Saltillo Corporation
Driver:
Rising Autism Prevalence & Awareness:
The increasing prevalence of autism spectrum disorders globally, with current estimates of 1 in 36 children in the US being diagnosed with ASD, drives substantial demand for SGDs. Enhanced awareness among parents, educators, and healthcare providers about the benefits of augmentative and alternative communication (AAC) leads to earlier intervention and increased device adoption. Government initiatives supporting autism services and insurance mandates for autism-related therapies further accelerate market growth. Educational inclusion policies requiring communication support in schools create sustained demand for SGDs across the pediatric population, with long-term usage extending into adulthood.
Technological Advancements in AI & Natural Language Processing:
Integration of artificial intelligence, machine learning, and natural language processing capabilities enhances SGD functionality through predictive text, personalized vocabulary development, and improved speech synthesis quality. Cloud-based platforms enable remote programming, data synchronization across devices, and continuous learning from user interactions. Voice banking technology allows users to preserve their natural voice before disease progression, while advanced eye-tracking and gesture recognition expand access for users with severe motor impairments. These innovations improve communication outcomes and user satisfaction, driving adoption across diverse user populations and clinical settings.
Restrain:
High Device Costs & Limited Insurance Coverage:
Premium SGDs can cost $5,000-$15,000, creating significant financial barriers for many potential users and their families. While some insurance plans cover SGDs, coverage varies widely, and many policies exclude tablet-based solutions or limit replacement frequency. The evaluation and customization process adds additional costs through speech-language pathology services, which may not be fully covered. Limited funding programs and lengthy approval processes discourage adoption, particularly among lower-income populations and in developing markets where insurance coverage for assistive technologies remains minimal.
Device Complexity & Training Requirements:
SGDs require significant time investment for setup, customization, and user training, creating barriers for both users and caregivers. Complex programming interfaces may overwhelm non-technical users, while inadequate training leads to device abandonment. Ongoing maintenance, software updates, and vocabulary development require continuous support that may not be readily available in all regions. The learning curve associated with new communication methods can be particularly challenging for older users or those with cognitive impairments, limiting adoption in certain populations despite potential benefits.
Opportunities:
Emerging Markets Expansion:
Developing countries in Asia-Pacific, Latin America, and Africa present significant growth opportunities as healthcare infrastructure improves and awareness of communication disorders increases. Government initiatives promoting inclusive education and disability rights create demand for SGDs in schools and healthcare facilities. Local partnerships and technology transfer programs can reduce costs and improve accessibility, while mobile-based solutions leverage widespread smartphone adoption to deliver affordable communication support. The growing middle class in these regions increases purchasing power for assistive technologies, creating sustainable market opportunities.
Advanced AI algorithms enable unprecedented personalization of communication experiences through predictive text, context-aware vocabulary suggestions, and adaptive user interfaces that learn from individual usage patterns. Integration with telehealth platforms expands access to speech-language pathology services in underserved areas, enabling remote device programming, therapy delivery, and progress monitoring. Cloud-based analytics provide insights for continuous improvement of communication strategies, while integration with smart home devices and IoT platforms creates seamless communication environments that extend beyond traditional SGD boundaries.
Trends:
Personalization Through AI & Machine Learning:
SGDs are increasingly incorporating AI-driven personalization features that adapt to individual user preferences, communication patterns, and contextual needs. Machine learning algorithms analyze usage data to suggest relevant vocabulary, predict communication intentions, and optimize interface layouts for improved efficiency. Personalized voice synthesis allows users to maintain unique communication styles, while adaptive learning systems adjust complexity levels based on cognitive abilities and progress over time. This trend transforms SGDs from static communication tools into dynamic, evolving platforms that grow with users' changing needs and capabilities.
Cloud-Based Solutions & Remote Support:
The shift toward cloud-based SGD platforms enables seamless synchronization across multiple devices, remote programming by speech-language pathologists, and continuous access to updated vocabulary and features. Cloud connectivity facilitates telehealth integration, allowing for virtual therapy sessions, progress monitoring, and device optimization without requiring in-person visits. This trend particularly benefits users in rural or underserved areas, reduces support costs for providers, and enables continuous improvement of communication experiences through data analytics and user feedback collection.
Recent Development
In April 2025: PRC-Saltillo released significant enhancements to its TouchChat application in January 2025, introducing sophisticated artificial intelligence-powered word prediction capabilities that accelerate communication for users with speech impairments. The updated application features dynamic multilingual functionality, enabling seamless real-time language switching that supports diverse communication needs across different linguistic contexts.