Spices and Seasonings Market Size | Growth Outlook & 7.1% CAGR
Global Spices and Seasonings Market Size, Share & Analysis By Product Type (Spices, Herbs, Salt & Salt Substitutes, Others), By Application (Food Processing, Retail), By Distribution Channel Industry Regions & Key Players – Flavor Innovation Trends & Forecast 2025–2034
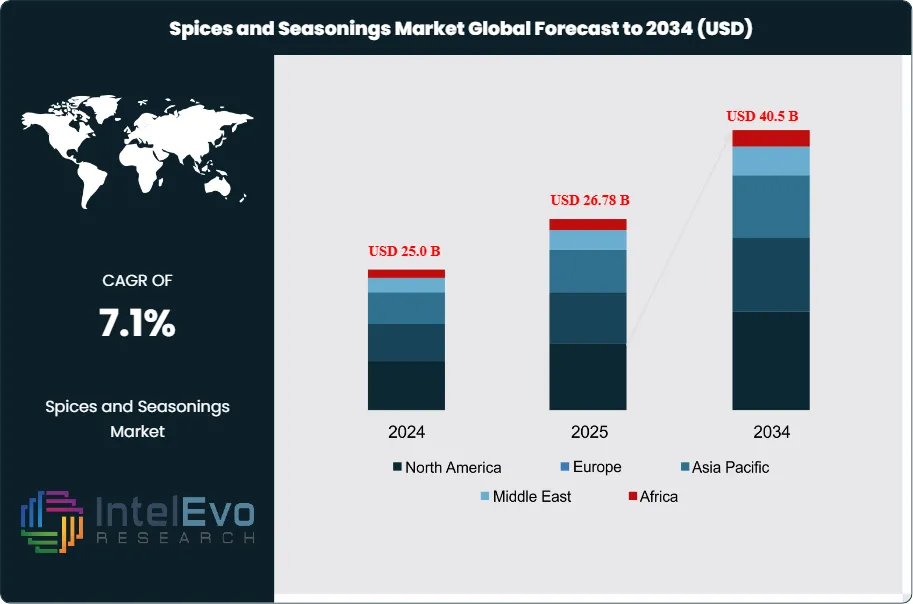
The Spices and Seasonings Market is estimated at USD 25.0 billion in 2024 and is on track to reach nearly USD 40.5 billion by 2034, reflecting a healthy CAGR of 7.1% during 2025–2034. Growth is being fueled by rising global demand for ethnic cuisines, the rapid expansion of packaged foods, and increasing consumer interest in natural flavor enhancers. Health-driven trends—such as turmeric, ginger, cinnamon, and garlic-based blends—are further boosting product innovation across FMCG categories. With foodservice modernization, e-commerce penetration, and premium spice blends trending worldwide, the industry is gaining strong visibility across culinary, wellness, and gourmet lifestyle segments.
The market has shown consistent expansion in recent years, driven by rising cross-cultural food consumption, the growing popularity of ethnic cuisines, and increasing preference for natural flavor enhancers. With spices and seasonings serving both culinary and functional roles, demand continues to grow across food manufacturing, hospitality, and household segments. In 2023, global spice production reached approximately 13.6 million metric tons, with India contributing close to 75% of this volume. India alone produced around 10.2 million metric tons, securing its position as the leading global supplier. The U.S. market also reflects strong demand, with spice consumption exceeding 635 million pounds in 2022 and growing at an average annual rate of 2.8%, according to USDA data.
Health-driven consumption is a key growth driver, particularly for spices linked to wellness benefits such as turmeric, ginger, garlic, and cinnamon. These products are increasingly used in both traditional recipes and health-positioned food items. WHO findings highlight that natural spice-based diets may help reduce risks associated with chronic conditions like cardiovascular disease and diabetes, supporting their inclusion in health-conscious product lines. The market also benefits from rising consumer interest in clean-label and preservative-free formulations, where spices often replace synthetic additives.
From a supply-side perspective, investments in processing infrastructure and quality certification are reshaping global trade dynamics. India and Vietnam continue to strengthen their export pipelines through government-backed initiatives, including India’s “Spice Parks” that offer shared facilities for value-added processing and packaging. Export revenues from India alone stood at USD 4.3 billion in FY 2023, underscoring its strategic importance in the global value chain.
Technological advancements in grinding, sterilization, and packaging are improving shelf life and traceability, particularly in export markets with strict regulatory standards. Meanwhile, rising demand from foodservice operators, ready-to-eat meal producers, and premium snack brands is accelerating the market’s expansion. With increasing adoption across North America, Europe, and Asia Pacific, and strong production bases in South Asia, the global spices and seasonings market is well-positioned for sustained, demand-led growth through 2034.
Key Takeaways
Market Growth: The global spices and seasonings market is projected to grow from USD 25.0 billion in 2024 to USD 40.5 billion by 2034, registering a CAGR of 7.1%. Growth is fueled by rising demand for natural ingredients, expanding international cuisines, and increasing application in processed and ready-to-eat foods.
Product Type: Spices accounted for over 68.3% of the global market in 2024, driven by widespread use in culinary applications, health-focused consumption, and strong export volumes from countries like India and Vietnam.
Application: Meat and poultry products remained the leading application segment with a 38.2% market share, supported by rising demand for flavor enhancement in packaged meats and marinade-based preparations across developed markets.
Driver: Consumer preference for clean-label and health-oriented products is accelerating demand for spices such as turmeric, garlic, and ginger. These ingredients are linked to immunity and anti-inflammatory benefits, aligning with broader health and wellness trends.
Restraint: Volatility in raw material prices due to climate conditions, export restrictions, and supply chain disruptions continues to challenge manufacturers. This affects pricing stability and margins, particularly for small-scale processors.
Opportunity: The rise of ethnic and fusion cuisines in Western markets presents strong growth potential for specialty spice blends. North America and Europe are expected to see increased import volumes, creating opportunities for exporters targeting premium and organic spice categories.
Trend: Investment in processing infrastructure, such as India's Spice Parks initiative, is enabling higher-quality production and better compliance with international standards. These upgrades are enhancing competitiveness in export-driven economies.
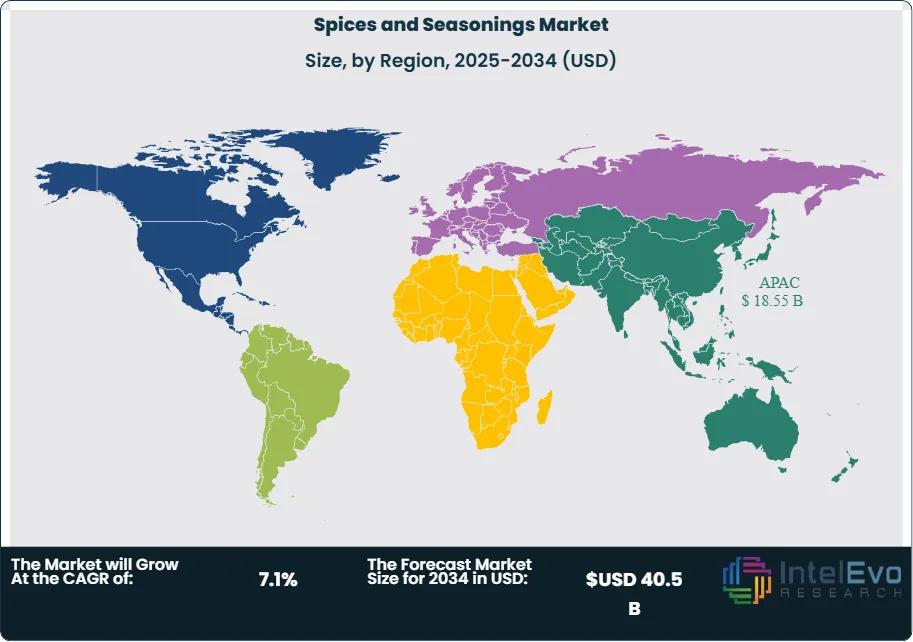
Regional Analysis: Asia Pacific led the global market in 2024 with a commanding 74.2% share, translating to USD 17.8 billion in revenue. The region's dominance is supported by high production volumes, strong domestic consumption, and well-established export networks. North America and Europe are emerging as high-value markets for imported, value-added spice products.
Application Analysis
As of 2025, meat and poultry products continue to lead the global spices and seasonings market by application, accounting for approximately 38.2% of total revenue. This dominance is driven by the widespread use of spice blends in marinated meats, processed poultry, and pre-seasoned protein products. Consumer demand for flavorful, ready-to-cook options has surged across retail and foodservice channels, particularly in North America and Western Europe, where convenience and taste remain key purchase drivers.
The expanding influence of multicultural cuisines is further amplifying demand for diverse seasoning profiles. Middle Eastern, South Asian, and Latin American spice blends are increasingly incorporated into commercial meat preparations to meet changing consumer palates. In 2025, ready-to-eat meat products using ethnic-inspired marinades, such as shawarma, tandoori, or chimichurri, are seeing strong uptake across frozen and chilled categories. Manufacturers are responding with targeted product development and reformulated spice mixes, contributing to the sustained growth of this segment.
Regional Analysis
Asia Pacific remains the dominant regional force in the global spices and seasonings market, commanding approximately 74.2% of market share in 2024, equivalent to USD 17.8 billion in revenue. The region’s strength lies in its long-standing agricultural capacity, cultural integration of spices, and strategic export positioning. India leads the global supply chain with its extensive spice farming sector, supported by national programs that fund organic farming, processing upgrades, and trade promotion through the Spices Board of India.
Other key contributors include China, Vietnam, and Indonesia, each leveraging their agro-climatic diversity to cultivate high-demand spices such as pepper, star anise, ginger, and turmeric. These countries are expanding production capacity while adopting modern drying, sterilization, and packaging technologies to meet global quality standards. Growing consumer preference in Western markets for authentic Asian flavors continues to drive export demand, reinforcing Asia Pacific’s leadership position.
At the same time, developed markets in North America and Europe are emerging as high-value importers, driven by rising consumption of ethnic foods and health-positioned spice products. While not primary producers, these regions play a critical role in demand growth, offering strong opportunities for Asia-based exporters focused on premium and organic product lines..
By Product Type (Spices, Herbs, Salt & Salt Substitutes, Others), By Application (Meat and Poultry Products, Snacks and Convenience Food, Soups, Sauces and Dressings, Bakery and Confectionery, Frozen Products, Beverages, Others)
Research Methodology
Primary Research- 100 Interviews of Stakeholders
Secondary Research
Desk Research
Regional scope
North America (United States, Canada, Mexico)
Latin America (Brazil, Argentina, Columbia)
East Asia And Pacific (China, Japan, South Korea, Australia, Cambodia, Fiji, Indonesia)
Sea And South Asia (India, Singapore, Thailand, Taiwan, Malaysia)
Eastern Europe (Poland, Russia, Czech Republic, Romania)
Western Europe (Germany, U.K., France, Spain, Itlay)
Middle East & Africa (GCC Countries, Egypt, Nigeria, South Africa, Israel)
Competitive Landscape
McCormick & Company Inc., Döhler GmbH, The Watkins Company, Everest Spices, Sensient Technologies Corporation, Baria Pepper, Kerry Group plc, Ajinomoto Co, Inc., Associated British Food PLC, Unilever Group, DS Group, The Spice House
Customization Scope
Customization for segments, region/country-level will be provided. Moreover, additional customization can be done based on the requirements.
Pricing and Purchase Options
Avail customized purchase options to meet your exact research needs. We have three licenses to opt for: Single User License, Multi-User License (Up to 5 Users), Corporate Use License (Unlimited User and Printable PDF).
TABLE OF CONTENTS
1. EXECUTIVE SUMMARY
1.1. MARKET SNAPSHOT
1.2. KEY FINDINGS & INSIGHTS
1.3. ANALYST RECOMMENDATIONS
1.4. FUTURE OUTLOOK
2. RESEARCH METHODOLOGY
2.1. MARKET DEFINITION & SCOPE
2.2. RESEARCH OBJECTIVES: PRIMARY & SECONDARY DATA SOURCES
2.3. DATA COLLECTION SOURCES
2.3.1. COVERAGE OF 100+ PRIMARY RESEARCH/CONSULTATION CALLS WITH INDUSTRY STAKEHOLDERS
FIGURE 17 NORTH AMERICA SPICES AND SEASONINGS CURRENT AND FUTURE TYPE ANALYSIS, 2025–2034, (USD MILLION)
FIGURE 18 NORTH AMERICA SPICES AND SEASONINGS CURRENT AND FUTURE END USER ANALYSIS, 2025–2034, (USD MILLION)
FIGURE 19 MARKET SHARE BY COUNTRY
FIGURE 20 LATIN AMERICA SPICES AND SEASONINGS CURRENT AND FUTURE TYPE ANALYSIS, 2025–2034, (USD MILLION)
FIGURE 21 LATIN AMERICA SPICES AND SEASONINGS CURRENT AND FUTURE END USER ANALYSIS, 2025–2034, (USD MILLION)
FIGURE 22 MARKET SHARE BY COUNTRY
FIGURE 23 EASTERN EUROPE SPICES AND SEASONINGS CURRENT AND FUTURE TYPE ANALYSIS, 2025–2034, (USD MILLION)
FIGURE 24 EASTERN EUROPE SPICES AND SEASONINGS CURRENT AND FUTURE END USER ANALYSIS, 2025–2034, (USD MILLION)
FIGURE 25 MARKET SHARE BY COUNTRY
FIGURE 26 WESTERN EUROPE SPICES AND SEASONINGS CURRENT AND FUTURE TYPE ANALYSIS, 2025–2034, (USD MILLION)
FIGURE 27 WESTERN EUROPE SPICES AND SEASONINGS CURRENT AND FUTURE END USER ANALYSIS, 2025–2034, (USD MILLION)
FIGURE 28 MARKET SHARE BY COUNTRY
FIGURE 29 EAST ASIA AND PACIFIC SPICES AND SEASONINGS CURRENT AND FUTURE TYPE ANALYSIS, 2025–2034, (USD MILLION)
FIGURE 30 EAST ASIA AND PACIFIC SPICES AND SEASONINGS CURRENT AND FUTURE END USER ANALYSIS, 2025–2034, (USD MILLION)
FIGURE 31 MARKET SHARE BY COUNTRY
FIGURE 32 SEA AND SOUTH ASIA SPICES AND SEASONINGS CURRENT AND FUTURE TYPE ANALYSIS, 2025–2034, (USD MILLION)
FIGURE 33 SEA AND SOUTH ASIA SPICES AND SEASONINGS CURRENT AND FUTURE END USER ANALYSIS, 2025–2034, (USD MILLION)
FIGURE 34 MARKET SHARE BY COUNTRY
FIGURE 35 MIDDLE EAST AND AFRICA SPICES AND SEASONINGS CURRENT AND FUTURE TYPE ANALYSIS, 2025–2034, (USD MILLION)
FIGURE 36 MIDDLE EAST AND AFRICA SPICES AND SEASONINGS CURRENT AND FUTURE END USER ANALYSIS, 2025–2034, (USD MILLION)
FIGURE 37 NORTH AMERICA SPICES AND SEASONINGS CURRENT AND FUTURE MARKET VOLUME SHARE REGIONAL ANALYSIS, 2025–2034, (USD MILLION)
FIGURE 38 U.S. SPICES AND SEASONINGS CURRENT AND FUTURE TYPE ANALYSIS, 2025–2034, (USD MILLION)
FIGURE 39 U.S. SPICES AND SEASONINGS CURRENT AND FUTURE END USER ANALYSIS, 2025–2034, (USD MILLION)
FIGURE 40 CANADA SPICES AND SEASONINGS CURRENT AND FUTURE TYPE ANALYSIS, 2025–2034, (USD MILLION)
FIGURE 41 CANADA SPICES AND SEASONINGS CURRENT AND FUTURE END USER ANALYSIS, 2025–2034, (USD MILLION)
FIGURE 42 LATIN AMERICA SPICES AND SEASONINGS CURRENT AND FUTURE MARKET VOLUME SHARE REGIONAL ANALYSIS, 2025–2034, (USD MILLION)
FIGURE 43 MEXICO SPICES AND SEASONINGS CURRENT AND FUTURE TYPE ANALYSIS, 2025–2034, (USD MILLION)
FIGURE 44 MEXICO SPICES AND SEASONINGS CURRENT AND FUTURE END USER ANALYSIS, 2025–2034, (USD MILLION)
FIGURE 45 BRAZIL SPICES AND SEASONINGS CURRENT AND FUTURE TYPE ANALYSIS, 2025–2034, (USD MILLION)
FIGURE 46 BRAZIL SPICES AND SEASONINGS CURRENT AND FUTURE END USER ANALYSIS, 2025–2034, (USD MILLION)
FIGURE 47 ARGENTINA SPICES AND SEASONINGS CURRENT AND FUTURE TYPE ANALYSIS, 2025–2034, (USD MILLION)
FIGURE 48 ARGENTINA SPICES AND SEASONINGS CURRENT AND FUTURE END USER ANALYSIS, 2025–2034, (USD MILLION)
FIGURE 49 COLUMBIA SPICES AND SEASONINGS CURRENT AND FUTURE TYPE ANALYSIS, 2025–2034, (USD MILLION)
FIGURE 50 COLUMBIA SPICES AND SEASONINGS CURRENT AND FUTURE END USER ANALYSIS, 2025–2034, (USD MILLION)
FIGURE 51 REST OF LATIN AMERICA SPICES AND SEASONINGS CURRENT AND FUTURE TYPE ANALYSIS, 2025–2034, (USD MILLION)
FIGURE 52 REST OF LATIN AMERICA SPICES AND SEASONINGS CURRENT AND FUTURE END USER ANALYSIS, 2025–2034, (USD MILLION)
FIGURE 53 EASTERN EUROPE SPICES AND SEASONINGS CURRENT AND FUTURE MARKET VOLUME SHARE REGIONAL ANALYSIS, 2025–2034, (USD MILLION)
FIGURE 54 POLAND SPICES AND SEASONINGS CURRENT AND FUTURE TYPE ANALYSIS, 2025–2034, (USD MILLION)
FIGURE 55 POLAND SPICES AND SEASONINGS CURRENT AND FUTURE END USER ANALYSIS, 2025–2034, (USD MILLION)
FIGURE 56 RUSSIA SPICES AND SEASONINGS CURRENT AND FUTURE TYPE ANALYSIS, 2025–2034, (USD MILLION)
FIGURE 57 RUSSIA SPICES AND SEASONINGS CURRENT AND FUTURE END USER ANALYSIS, 2025–2034, (USD MILLION)
FIGURE 58 CZECH REPUBLIC SPICES AND SEASONINGS CURRENT AND FUTURE TYPE ANALYSIS, 2025–2034, (USD MILLION)
FIGURE 59 CZECH REPUBLIC SPICES AND SEASONINGS CURRENT AND FUTURE END USER ANALYSIS, 2025–2034, (USD MILLION)
FIGURE 60 ROMANIA SPICES AND SEASONINGS CURRENT AND FUTURE TYPE ANALYSIS, 2025–2034, (USD MILLION)
FIGURE 61 ROMANIA SPICES AND SEASONINGS CURRENT AND FUTURE END USER ANALYSIS, 2025–2034, (USD MILLION)
FIGURE 62 REST OF EASTERN EUROPE SPICES AND SEASONINGS CURRENT AND FUTURE TYPE ANALYSIS, 2025–2034, (USD MILLION)
FIGURE 63 REST OF EASTERN EUROPE SPICES AND SEASONINGS CURRENT AND FUTURE END USER ANALYSIS, 2025–2034, (USD MILLION)
FIGURE 64 WESTERN EUROPE SPICES AND SEASONINGS CURRENT AND FUTURE MARKET VOLUME SHARE REGIONAL ANALYSIS, 2025–2034, (USD MILLION)
FIGURE 65 GERMANY SPICES AND SEASONINGS CURRENT AND FUTURE TYPE ANALYSIS, 2025–2034, (USD MILLION)
FIGURE 66 GERMANY SPICES AND SEASONINGS CURRENT AND FUTURE END USER ANALYSIS, 2025–2034, (USD MILLION)
FIGURE 67 FRANCE SPICES AND SEASONINGS CURRENT AND FUTURE TYPE ANALYSIS, 2025–2034, (USD MILLION)
FIGURE 68 FRANCE SPICES AND SEASONINGS CURRENT AND FUTURE END USER ANALYSIS, 2025–2034, (USD MILLION)
FIGURE 69 UK SPICES AND SEASONINGS CURRENT AND FUTURE TYPE ANALYSIS, 2025–2034, (USD MILLION)
FIGURE 70 UK SPICES AND SEASONINGS CURRENT AND FUTURE END USER ANALYSIS, 2025–2034, (USD MILLION)
FIGURE 71 SPAIN SPICES AND SEASONINGS CURRENT AND FUTURE TYPE ANALYSIS, 2025–2034, (USD MILLION)
FIGURE 72 SPAIN SPICES AND SEASONINGS CURRENT AND FUTURE END USER ANALYSIS, 2025–2034, (USD MILLION)
FIGURE 73 ITALY SPICES AND SEASONINGS CURRENT AND FUTURE TYPE ANALYSIS, 2025–2034, (USD MILLION)
FIGURE 74 ITALY SPICES AND SEASONINGS CURRENT AND FUTURE END USER ANALYSIS, 2025–2034, (USD MILLION)
FIGURE 75 REST OF WESTERN EUROPE SPICES AND SEASONINGS CURRENT AND FUTURE TYPE ANALYSIS, 2025–2034, (USD MILLION)
FIGURE 76 REST OF WESTERN EUROPE SPICES AND SEASONINGS CURRENT AND FUTURE END USER ANALYSIS, 2025–2034, (USD MILLION)
FIGURE 77 EAST ASIA AND PACIFIC SPICES AND SEASONINGS CURRENT AND FUTURE MARKET VOLUME SHARE REGIONAL ANALYSIS, 2025–2034, (USD MILLION)
FIGURE 78 CHINA SPICES AND SEASONINGS CURRENT AND FUTURE TYPE ANALYSIS, 2025–2034, (USD MILLION)
FIGURE 79 CHINA SPICES AND SEASONINGS CURRENT AND FUTURE END USER ANALYSIS, 2025–2034, (USD MILLION)
FIGURE 80 JAPAN SPICES AND SEASONINGS CURRENT AND FUTURE TYPE ANALYSIS, 2025–2034, (USD MILLION)
FIGURE 81 JAPAN SPICES AND SEASONINGS CURRENT AND FUTURE END USER ANALYSIS, 2025–2034, (USD MILLION)
FIGURE 82 AUSTRALIA SPICES AND SEASONINGS CURRENT AND FUTURE TYPE ANALYSIS, 2025–2034, (USD MILLION)
FIGURE 83 AUSTRALIA SPICES AND SEASONINGS CURRENT AND FUTURE END USER ANALYSIS, 2025–2034, (USD MILLION)
FIGURE 84 CAMBODIA SPICES AND SEASONINGS CURRENT AND FUTURE TYPE ANALYSIS, 2025–2034, (USD MILLION)
FIGURE 85 CAMBODIA SPICES AND SEASONINGS CURRENT AND FUTURE END USER ANALYSIS, 2025–2034, (USD MILLION)
FIGURE 86 FIJI SPICES AND SEASONINGS CURRENT AND FUTURE TYPE ANALYSIS, 2025–2034, (USD MILLION)
FIGURE 87 FIJI SPICES AND SEASONINGS CURRENT AND FUTURE END USER ANALYSIS, 2025–2034, (USD MILLION)
FIGURE 88 INDONESIA SPICES AND SEASONINGS CURRENT AND FUTURE TYPE ANALYSIS, 2025–2034, (USD MILLION)
FIGURE 89 INDONESIA SPICES AND SEASONINGS CURRENT AND FUTURE END USER ANALYSIS, 2025–2034, (USD MILLION)
FIGURE 90 SOUTH KOREA SPICES AND SEASONINGS CURRENT AND FUTURE TYPE ANALYSIS, 2025–2034, (USD MILLION)
FIGURE 91 SOUTH KOREA SPICES AND SEASONINGS CURRENT AND FUTURE END USER ANALYSIS, 2025–2034, (USD MILLION)
FIGURE 92 REST OF EAST ASIA AND PACIFIC SPICES AND SEASONINGS CURRENT AND FUTURE TYPE ANALYSIS, 2025–2034, (USD MILLION)
FIGURE 93 REST OF EAST ASIA AND PACIFIC SPICES AND SEASONINGS CURRENT AND FUTURE END USER ANALYSIS, 2025–2034, (USD MILLION)
FIGURE 94 SEA AND SOUTH ASIA SPICES AND SEASONINGS CURRENT AND FUTURE MARKET VOLUME SHARE REGIONAL ANALYSIS, 2025–2034, (USD MILLION)
FIGURE 95 BANGLADESH SPICES AND SEASONINGS CURRENT AND FUTURE TYPE ANALYSIS, 2025–2034, (USD MILLION)
FIGURE 96 BANGLADESH SPICES AND SEASONINGS CURRENT AND FUTURE END USER ANALYSIS, 2025–2034, (USD MILLION)
FIGURE 97 NEW ZEALAND SPICES AND SEASONINGS CURRENT AND FUTURE TYPE ANALYSIS, 2025–2034, (USD MILLION)
FIGURE 98 NEW ZEALAND SPICES AND SEASONINGS CURRENT AND FUTURE END USER ANALYSIS, 2025–2034, (USD MILLION)
FIGURE 99 INDIA SPICES AND SEASONINGS CURRENT AND FUTURE TYPE ANALYSIS, 2025–2034, (USD MILLION)
FIGURE 100 INDIA SPICES AND SEASONINGS CURRENT AND FUTURE END USER ANALYSIS, 2025–2034, (USD MILLION)
FIGURE 101 SINGAPORE SPICES AND SEASONINGS CURRENT AND FUTURE TYPE ANALYSIS, 2025–2034, (USD MILLION)
FIGURE 102 SINGAPORE SPICES AND SEASONINGS CURRENT AND FUTURE END USER ANALYSIS, 2025–2034, (USD MILLION)
FIGURE 103 THAILAND SPICES AND SEASONINGS CURRENT AND FUTURE TYPE ANALYSIS, 2025–2034, (USD MILLION)
FIGURE 104 THAILAND SPICES AND SEASONINGS CURRENT AND FUTURE END USER ANALYSIS, 2025–2034, (USD MILLION)
FIGURE 105 TAIWAN SPICES AND SEASONINGS CURRENT AND FUTURE TYPE ANALYSIS, 2025–2034, (USD MILLION)
FIGURE 106 TAIWAN SPICES AND SEASONINGS CURRENT AND FUTURE END USER ANALYSIS, 2025–2034, (USD MILLION)
FIGURE 107 MALAYSIA SPICES AND SEASONINGS CURRENT AND FUTURE TYPE ANALYSIS, 2025–2034, (USD MILLION)
FIGURE 108 MALAYSIA SPICES AND SEASONINGS CURRENT AND FUTURE END USER ANALYSIS, 2025–2034, (USD MILLION)
FIGURE 109 REST OF SEA AND SOUTH ASIA SPICES AND SEASONINGS CURRENT AND FUTURE TYPE ANALYSIS, 2025–2034, (USD MILLION)
FIGURE 110 REST OF SEA AND SOUTH ASIA SPICES AND SEASONINGS CURRENT AND FUTURE END USER ANALYSIS, 2025–2034, (USD MILLION)
FIGURE 111 MIDDLE EAST AND AFRICA SPICES AND SEASONINGS CURRENT AND FUTURE MARKET VOLUME SHARE REGIONAL ANALYSIS, 2025–2034, (USD MILLION)
FIGURE 112 GCC COUNTRIES SPICES AND SEASONINGS CURRENT AND FUTURE TYPE ANALYSIS, 2025–2034, (USD MILLION)
FIGURE 113 GCC COUNTRIES SPICES AND SEASONINGS CURRENT AND FUTURE END USER ANALYSIS, 2025–2034, (USD MILLION)
FIGURE 114 SAUDI ARABIA SPICES AND SEASONINGS CURRENT AND FUTURE TYPE ANALYSIS, 2025–2034, (USD MILLION)
FIGURE 115 SAUDI ARABIA SPICES AND SEASONINGS CURRENT AND FUTURE END USER ANALYSIS, 2025–2034, (USD MILLION)
FIGURE 116 UAE SPICES AND SEASONINGS CURRENT AND FUTURE TYPE ANALYSIS, 2025–2034, (USD MILLION)
FIGURE 117 UAE SPICES AND SEASONINGS CURRENT AND FUTURE END USER ANALYSIS, 2025–2034, (USD MILLION)
FIGURE 118 BAHRAIN SPICES AND SEASONINGS CURRENT AND FUTURE TYPE ANALYSIS, 2025–2034, (USD MILLION)
FIGURE 119 BAHRAIN SPICES AND SEASONINGS CURRENT AND FUTURE END USER ANALYSIS, 2025–2034, (USD MILLION)
FIGURE 120 KUWAIT SPICES AND SEASONINGS CURRENT AND FUTURE TYPE ANALYSIS, 2025–2034, (USD MILLION)
FIGURE 121 KUWAIT SPICES AND SEASONINGS CURRENT AND FUTURE END USER ANALYSIS, 2025–2034, (USD MILLION)
FIGURE 122 OMAN SPICES AND SEASONINGS CURRENT AND FUTURE TYPE ANALYSIS, 2025–2034, (USD MILLION)
FIGURE 123 OMAN SPICES AND SEASONINGS CURRENT AND FUTURE END USER ANALYSIS, 2025–2034, (USD MILLION)
FIGURE 124 QATAR SPICES AND SEASONINGS CURRENT AND FUTURE TYPE ANALYSIS, 2025–2034, (USD MILLION)
FIGURE 125 QATAR SPICES AND SEASONINGS CURRENT AND FUTURE END USER ANALYSIS, 2025–2034, (USD MILLION)
FIGURE 126 EGYPT SPICES AND SEASONINGS CURRENT AND FUTURE TYPE ANALYSIS, 2025–2034, (USD MILLION)
FIGURE 127 EGYPT SPICES AND SEASONINGS CURRENT AND FUTURE END USER ANALYSIS, 2025–2034, (USD MILLION)
FIGURE 128 NIGERIA SPICES AND SEASONINGS CURRENT AND FUTURE TYPE ANALYSIS, 2025–2034, (USD MILLION)
FIGURE 129 NIGERIA SPICES AND SEASONINGS CURRENT AND FUTURE END USER ANALYSIS, 2025–2034, (USD MILLION)
FIGURE 130 SOUTH AFRICA SPICES AND SEASONINGS CURRENT AND FUTURE TYPE ANALYSIS, 2025–2034, (USD MILLION)
FIGURE 131 SOUTH AFRICA SPICES AND SEASONINGS CURRENT AND FUTURE END USER ANALYSIS, 2025–2034, (USD MILLION)
FIGURE 132 ISRAEL SPICES AND SEASONINGS CURRENT AND FUTURE TYPE ANALYSIS, 2025–2034, (USD MILLION)
FIGURE 133 ISRAEL SPICES AND SEASONINGS CURRENT AND FUTURE END USER ANALYSIS, 2025–2034, (USD MILLION)
FIGURE 134 REST OF MEA SPICES AND SEASONINGS CURRENT AND FUTURE TYPE ANALYSIS, 2025–2034, (USD MILLION)
FIGURE 135 REST OF MEA SPICES AND SEASONINGS CURRENT AND FUTURE END USER ANALYSIS, 2025–2034, (USD MILLION)
FIGURE 136 U. S. MARKET SHARE ANALYSIS BY TYPE (2024)
FIGURE 137 U. S. MARKET SHARE ANALYSIS BY END USER (2024)
FIGURE 138 CANADA MARKET SHARE ANALYSIS BY TYPE (2024)
FIGURE 139 CANADA MARKET SHARE ANALYSIS BY END USER (2024)
FIGURE 140 MEXICO MARKET SHARE ANALYSIS BY TYPE (2024)
FIGURE 141 MEXICO MARKET SHARE ANALYSIS BY END USER (2024)
FIGURE 142 CHINA MARKET SHARE ANALYSIS BY TYPE (2024)
FIGURE 143 CHINA MARKET SHARE ANALYSIS BY END USER (2024)
FIGURE 144 JAPAN MARKET SHARE ANALYSIS BY TYPE (2024)
FIGURE 145 JAPAN MARKET SHARE ANALYSIS BY END USER (2024)
FIGURE 146 INDIA MARKET SHARE ANALYSIS BY TYPE (2024)
FIGURE 147 INDIA MARKET SHARE ANALYSIS BY END USER (2024)
FIGURE 148 SOUTH KOREA MARKET SHARE ANALYSIS BY TYPE (2024)
FIGURE 149 SOUTH KOREA MARKET SHARE ANALYSIS BY END USER (2024)
FIGURE 150 SAUDI ARABIA MARKET SHARE ANALYSIS BY TYPE (2024)
FIGURE 151 SAUDI ARABIA MARKET SHARE ANALYSIS BY END USER (2024)
FIGURE 152 UAE MARKET SHARE ANALYSIS BY TYPE (2024)
FIGURE 153 UAE MARKET SHARE ANALYSIS BY END USER (2024)
FIGURE 154 EGYPT MARKET SHARE ANALYSIS BY TYPE (2024)
FIGURE 155 EGYPT MARKET SHARE ANALYSIS BY END USER (2024)
FIGURE 156 NIGERIA MARKET SHARE ANALYSIS BY TYPE (2024)
FIGURE 157 NIGERIA MARKET SHARE ANALYSIS BY END USER (2024)
FIGURE 158 SOUTH AFRICA MARKET SHARE ANALYSIS BY TYPE (2024)
FIGURE 159 SOUTH AFRICA MARKET SHARE ANALYSIS BY END USER (2024)
FIGURE 160 GERMANY MARKET SHARE ANALYSIS BY TYPE (2024)
FIGURE 161 GERMANY MARKET SHARE ANALYSIS BY END USER (2024)
FIGURE 162 FRANCE MARKET SHARE ANALYSIS BY TYPE (2024)
FIGURE 163 FRANCE MARKET SHARE ANALYSIS BY END USER (2024)
FIGURE 164 UK MARKET SHARE ANALYSIS BY TYPE (2024)
FIGURE 165 UK MARKET SHARE ANALYSIS BY END USER (2024)
FIGURE 166 SPAIN MARKET SHARE ANALYSIS BY TYPE (2024)
FIGURE 167 SPAIN MARKET SHARE ANALYSIS BY END USER (2024)
FIGURE 168 ITALY MARKET SHARE ANALYSIS BY TYPE (2024)
FIGURE 169 ITALY MARKET SHARE ANALYSIS BY END USER (2024)
FIGURE 170 BRAZIL MARKET SHARE ANALYSIS BY TYPE (2024)
FIGURE 171 BRAZIL MARKET SHARE ANALYSIS BY END USER (2024)
FIGURE 172 ARGENTINA MARKET SHARE ANALYSIS BY TYPE (2024)
FIGURE 173 ARGENTINA MARKET SHARE ANALYSIS BY END USER (2024)
FIGURE 174 COLUMBIA MARKET SHARE ANALYSIS BY TYPE (2024)
FIGURE 175 COLUMBIA MARKET SHARE ANALYSIS BY END USER (2024)
FIGURE 176 GLOBAL SPICES AND SEASONINGS CURRENT AND FUTURE MARKET KEY COUNTRY LEVEL ANALYSIS, 2024–2034, (USD MILLION)
FIGURE 177 FINANCIAL OVERVIEW:
Key Player Analysis
Ajinomoto Co., Inc. Ajinomoto positions itself as a global leader in the spices and seasonings market, with a strong presence in Asia and expanding operations across North America and Europe. The company’s seasoning portfolio includes a wide range of umami products, blended spices, and culinary bases tailored to both consumer and foodservice segments. Ajinomoto’s strength lies in its integration of food science with traditional flavor systems, enabling it to develop products that meet both taste and nutritional preferences.
In 2025, Ajinomoto continues to invest in foodtech R&D, focusing on reduced-sodium formulations and functional seasoning solutions aligned with health-conscious trends. Its proprietary fermentation technologies differentiate its products in a market increasingly driven by clean-label and health-focused demands. The company also benefits from a robust distribution network and a strong brand presence across emerging markets in Southeast Asia, where urbanization and convenience consumption are driving spice use.
Sensient Technologies Corporation Sensient Technologies operates as a key innovator in the global flavor and seasoning space, particularly in the food ingredients and natural colorants segment. Within the spices and seasonings category, Sensient specializes in flavor systems for snacks, sauces, meats, and prepared foods. The company leverages advanced extraction and encapsulation technologies to create customized seasoning profiles with improved shelf life and stability.
In 2025, Sensient is expanding its clean-label product offerings and investing in sustainable sourcing programs, particularly in Latin America and Africa. Through AI-enabled flavor mapping and digital formulation platforms, the company is reducing development time and enhancing precision in meeting regional taste preferences. Its ability to combine flavor, color, and functional performance in a single solution positions Sensient as a preferred partner for global food manufacturers seeking product differentiation.
Associated British Foods plc Associated British Foods (ABF), through its subsidiary AB World Foods, is positioned as a challenger in the global spices and seasonings market, with brands like Patak’s and Blue Dragon anchoring its presence in ethnic and international cuisines. The company has a strong foothold in Europe and is expanding selectively into North America and Asia Pacific to capitalize on growing consumer demand for authentic global flavors.
ABF’s strategic focus remains on brand-led growth and regional diversification. In 2025, the company is investing in automation across its spice blending and packaging facilities to improve efficiency and reduce lead times. Its differentiated value lies in owning heritage brands with strong loyalty in ethnic food segments, allowing it to tap into both mainstream retail and specialty markets. ABF’s ability to scale regional spice offerings while maintaining authenticity provides it with a competitive edge in mature markets.
Kerry Group plc Kerry Group is a global ingredient leader and a major player in the seasonings and taste solutions market. Its product portfolio includes a wide range of spice blends, flavor modulators, and functional ingredients used across snacks, processed meats, bakery, and convenience foods. The company operates in over 150 countries, with a strong customer base that spans multinational food processors and regional brands.
In 2025, Kerry continues to prioritize innovation in plant-based flavor systems and clean-label seasonings. Its Taste & Nutrition division, which reported over EUR 7 billion in revenue in 2024, is driving growth through investments in AI-enabled formulation platforms and sustainable sourcing models. Kerry’s focus on localized taste development and rapid product turnaround enables it to address regional trends efficiently, making it a strategic partner for brands seeking tailored seasoning solutions in fast-moving consumer markets.
Market Key Players
McCormick & Company Inc.
Döhler GmbH
The Watkins Company
Everest Spices
Sensient Technologies Corporation
Baria Pepper
Kerry Group plc
Ajinomoto Co, Inc.
Associated British Food PLC
Unilever Group
DS Group
The Spice House
Driver:
Health-Conscious Consumers Drive Demand for Functional Spices
As of 2025, rising health consciousness is reshaping consumer behavior in the global spices and seasonings market. Natural spices with functional health benefits—such as turmeric, ginger, cinnamon, and garlic—are seeing increased household and commercial use. These ingredients are associated with anti-inflammatory, antioxidant, and metabolic health properties. The World Health Organization notes consistent links between spice-rich diets and reduced risk of chronic illnesses, including heart disease and diabetes.
Government Support Boosts Adoption of Ayurvedic & Natural Seasonings
Government support is reinforcing this shift. In India, the Ministry of AYUSH has received a 2025 budget allocation of INR 2,970 crores to promote Ayurvedic practices, including the use of traditional spices in wellness. This momentum is expanding the market for organic and functional spice products, prompting food manufacturers to reformulate seasoning blends to meet demand for natural, additive-free alternatives. The health-driven consumption trend is expected to remain a key growth engine across both mature and emerging economies.
Restraint:
Climate Volatility Disrupts Spice Supply and Price Stability
Volatility in agricultural supply chains continues to limit stability in the spices and seasonings market. Top-producing countries like India, Vietnam, and Indonesia remain vulnerable to climate-related disruptions and inconsistent labor availability. In 2024, unseasonal monsoon rains in southern India led to a 20% decline in cardamom output, causing a shortfall in global supply and a spike in prices. Such fluctuations directly impact margins for exporters and availability for importers.
Strict Global Regulations Create Compliance Challenges for Exporters
Regulatory barriers add further complexity. Importing regions such as the European Union enforce strict limits on pesticide residues and contaminants. In 2025, multiple shipments from South and Southeast Asia were rejected for non-compliance, resulting in additional logistical costs and reputational risks for suppliers. Without a more resilient and transparent supply chain, producers face continued challenges in meeting global demand consistently and cost-effectively.
Opportunity:
Rising Global Appetite for Ethnic Flavors Expands Market Demand
The global appetite for diverse cuisines is expanding rapidly, creating strong growth potential for the spices and seasonings market. As international travel and digital food culture expose consumers to new flavor profiles, demand for authentic ethnic spice blends has risen sharply. In 2024, spice imports into the U.S. increased by more than 15%, reflecting strong interest in Middle Eastern, South Asian, and Latin American ingredients among Western consumers.
Strategic Export Initiatives Strengthen Spice Value and Quality Positioning
Exporting countries are responding strategically. India’s “Spice Route” initiative is enhancing marketing and infrastructure to position the country as a premium source for authentic spice products. By improving traceability and processing standards, this initiative aims to capture value from the rising demand for global flavors in high-margin markets like North America and Europe. For producers and exporters, this trend presents a clear path to revenue growth through product diversification and quality differentiation.
Trend:
Sustainability & Traceability Become Core Buyer Expectations
Sustainability and traceability are emerging as defining trends in the global spice industry. Buyers increasingly expect transparency on sourcing practices, environmental impact, and labor conditions. This shift is pushing exporters to implement verifiable tracking systems across the supply chain. Certifications such as organic, non-GMO, and Fair Trade are now key purchase drivers, particularly in developed markets.
Digital Tracking and Certifications Reshape the Modern Spice Supply Chain
Responding to this trend, the Spices Board of India has introduced its ‘Traceability and Quality Upgradation’ program, initially targeting high-value spices like pepper and cardamom. The initiative focuses on digitized tracking, sustainable farming practices, and adherence to global residue limits. As consumers and regulators align around ethical sourcing, suppliers who invest in traceability systems will be better positioned to secure market access and command premium pricing.
Recent Developments
Dec 2024 – Kerry Group plc: Kerry announced the acquisition of a Southeast Asia-based seasoning manufacturer for approximately USD 115 million. The deal expands Kerry’s production footprint and enables access to high-growth ASEAN markets with localized flavor profiles. This move strengthens Kerry’s regional supply chain and accelerates its strategy to scale clean-label and culturally relevant spice offerings.
Feb 2025 – Sensient Technologies Corporation: Sensient launched a new AI-enabled flavor development platform aimed at reducing the formulation cycle for custom spice blends by up to 40%. The technology supports real-time sensory analysis and predictive modeling for taste adaptation. This enhances Sensient’s value proposition to global food manufacturers seeking faster product development and region-specific customization.
Apr 2025 – Associated British Foods plc: ABF’s spice division, AB World Foods, expanded its U.S. distribution network through a strategic partnership with a major retail chain. The rollout of Patak’s and Blue Dragon seasoning lines into 1,200 new stores is expected to increase U.S. retail sales by 18% year-over-year. The expansion enhances ABF’s exposure to the fast-growing ethnic foods segment in North America.
Jul 2025 – Ajinomoto Co., Inc.: Ajinomoto opened a new R&D center in India focused on fermentation-based spice enhancement and reduced-sodium seasoning solutions. The facility supports Ajinomoto’s global health positioning and its plan to develop more functional spice ingredients for Asian and Middle Eastern markets. This investment reinforces the company’s innovation-led growth model and local product development strategy.
Sep 2025 – Olam Food Ingredients (ofi): ofi launched a blockchain-based traceability system for its global spice supply chain, starting with black pepper and chili sourced from India and Vietnam. The platform enables end-to-end visibility from farm to shipment, addressing rising buyer demands for transparency and ethical sourcing. This step positions ofi as a leader in digital transformation within the bulk spice export market.

 Aerospace And Defence
 Agriculture
 Automotive And Transportation
 Banking And Finance
 Business
 Chemicals And Materials
 Consumer And Retail
 Electronics And Semiconductors
 Food And Beverages
 Machinery & Equipments
 Manufacturing And Construction
 Medical Devices
 Others
 Pharmaceuticals And Healthcare
 Power And Energy
 Sports
 Technology

, By Application (Food Processing, Retail), By Distribution Channel Industry Regions & Key Players – Flavor Innovation Trends & Forecast 2025–2034")
, By Application (Food Processing, Retail), By Distribution Channel Industry Regions & Key Players – Flavor Innovation Trends & Forecast 2025–2034")
, By Application (Food Processing, Retail), By Distribution Channel Industry Regions & Key Players – Flavor Innovation Trends & Forecast 2025–2034")
, By Application (Food Processing, Retail), By Distribution Channel Industry Regions & Key Players – Flavor Innovation Trends & Forecast 2025–2034")

