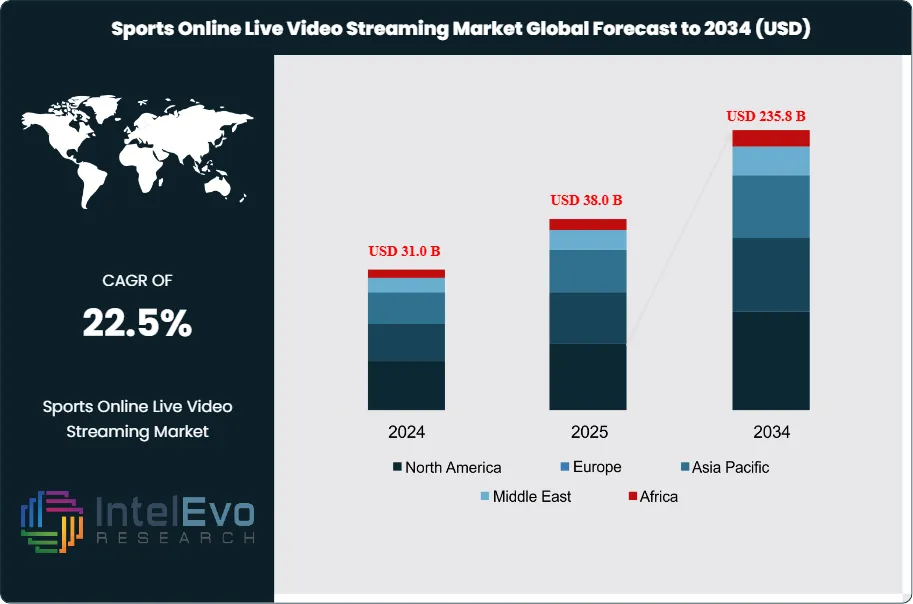
The Global Sports Online Live Video Streaming Market was valued at approximately USD 31.0 billion in 2024 and is projected to reach nearly USD 235.8 billion by 2034, driven by increasing digital media consumption, OTT platform expansion, and rising demand for real-time sports broadcasting across mobile and smart devices. Based on the stated growth trajectory, the market size for 2025 is estimated at approximately USD 38.0 billion. From 2026 onward, the market is expected to expand at a compound annual growth rate (CAGR) of approximately 22.5% during 2026–2034, ultimately reaching around USD 235.8 billion by 2034.
This market builds on expansion from a base of USD 25.3 billion in 2023, when North America held 36.8% share and generated USD 9.31 billion in revenue. Growth is shifting from simple broadcasting models to platform-based, data-driven engagement. Rising broadband penetration, 5G rollout, and the dominance of smartphones increase streaming hours per user and lift paid subscription uptake. Rights holders pursue direct-to-consumer offerings, while traditional broadcasters reshuffle portfolios to protect audience reach.
On the demand side, viewers expect high-quality live feeds, low latency, and flexible payment options. Time-shifted viewing and preference for chat, statistics, and betting overlays raise engagement and willingness to pay. On the supply side, global and regional platforms compete for premium rights, and rights fees rise by an estimated 8–10% per cycle, tightening margins and concentrating risk in top-tier leagues and tournaments.
Technology change acts as a central catalyst. AI-based encoding and automated quality-of-service monitoring reduce buffering and optimize bandwidth. Personalization engines use viewing data to refine recommendations, deliver dynamic advertising, and tailor pricing tiers. Emerging tools such as automated cameras, virtual production, and AI-generated highlight clipping lower production costs for niche events, unlocking new content inventory. Esports and interactive gaming streams add incremental audiences and open new sponsorship and in-stream commerce models.
Regulatory and policy forces shape growth trajectories across regions. Data protection and content localization rules influence how platforms store and monetize user data. Sports integrity, advertising standards, and gambling regulations define the structure of interactive features around live feeds. Public funding programs, including national sports development schemes, expand grassroots and semi-professional competitions, which broaden the pool of events available for streaming.
Regionally, North America and Western Europe remain the largest revenue pools, supported by high ARPU and mature digital payments. Asia Pacific is the fastest-growing cluster, led by India, Southeast Asia, and China, where young demographics and mobile-first behaviour drive double-digit subscriber growth. Latin America and the Middle East are emerging hotspots as operators bundle sports streaming with telecom and pay-TV propositions to reduce churn.
Key Takeaways
Market Growth: The Sports Online Live Video Streaming Market grows from 25.3 billion USD, 2023 to 192.5 billion USD, 2033, implying a strong 22.5% CAGR, 2024-2034. This expansion reflects rapid digital adoption and rising consumer willingness to pay for premium sports content.
Segment Dominance: Football live streaming holds the leading sports-type position with a 28.6% revenue share, 2023. This segment sets the benchmark for engagement and monetization intensity across the portfolio.
Segment Dominance: Television live streaming within online platforms commands more than a 58.0% share of application revenues, 2023. This dominance indicates that connected TV viewing remains central despite rapid growth in mobile and multi-screen consumption.
Driver: Rising broadband penetration and smartphone usage act as primary growth catalysts, with an estimated: 18.0% annual increase in online sports viewership, 2024. Platforms leverage this connectivity to scale subscription and advertising-based models across regions.
Restraint: High content rights costs and infrastructure demands constrain profitability, especially for smaller platforms, with an estimated: 15.0% of total revenue, 2024 absorbed by licensing and delivery overheads. These structural costs limit price flexibility and increase consolidation pressure.
Opportunity: Expansion into personalized, data-driven experiences and interactive features creates a significant incremental revenue pool, with an estimated: 30.0 billion USD, 2024 addressable through targeted advertising, micro-payments, and premium tiers. Esports and niche sports streaming further broaden the monetizable content base.
Trend: The market shifts toward multi-device, low-latency, and high-definition streaming, with an estimated: 65.0% of total sports streams, 2024 delivered over mobile and connected TV devices. AI-enabled recommendation engines and dynamic ad insertion increasingly shape user engagement patterns.
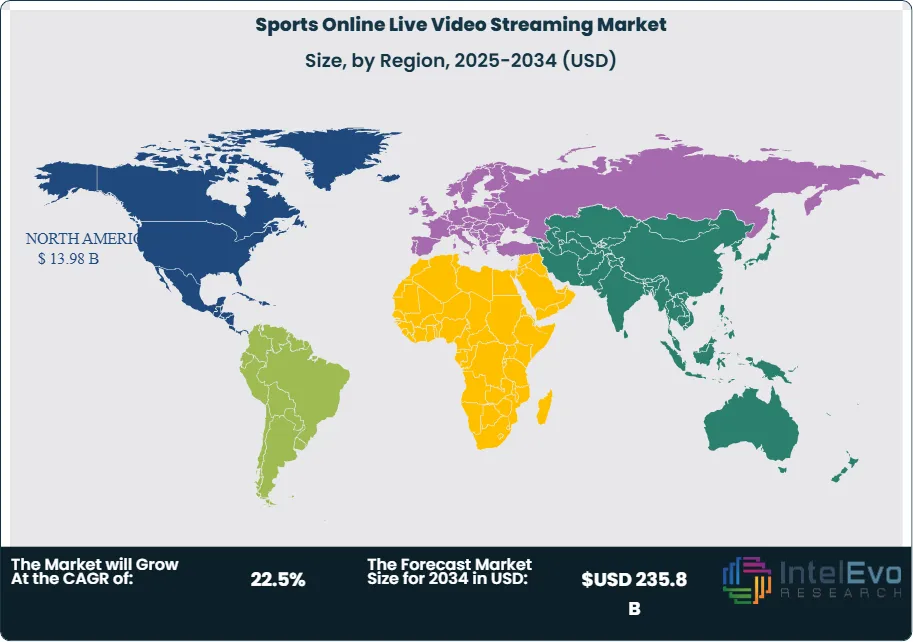
Regional Analysis: North America leads with a 36.8% share and 9.31 billion USD revenue, 2023, supported by high ARPU and mature digital infrastructure. Asia Pacific emerges as the fastest-growing cluster with an estimated: 30.0% share of new subscriber additions, 2024, driven by mobile-first viewers in large emerging economies.
By Type
The sports streaming market in 2025 continues to show clear differences in audience behavior across major sports categories. Football live streaming remains the largest segment and holds more than 28 percent of global viewership. Its scale comes from consistent demand for major leagues in Europe, North America, and Asia, as well as year-round tournament schedules that keep engagement steady. Basketball streaming follows as a strong segment with deeper adoption in the United States and China, supported by rising interest in regional leagues that add meaningful traffic to digital platforms.
Baseball maintains a concentrated but loyal viewer base. It performs well in the United States, Japan, and South Korea where fan engagement supports stable subscription activity. Tennis attracts an affluent global audience. Demand peaks during Grand Slam events that draw viewers across multiple time zones. Cricket remains central in India, Pakistan, Australia, and the United Kingdom. Major tournaments such as the ICC World Cup and domestic leagues continue to deliver high-volume streaming spikes and help platforms capture new paid users.
By Application
Television live streaming continues to anchor the market in 2025. It accounts for more than 58 percent of total consumption. Viewers prefer television for major match broadcasts due to picture quality, stability, and established viewing habits. The format remains essential for large events where millions tune in at the same time and depend on consistent service quality. Broadcasters also retain long-term rights contracts that secure steady traffic to these platforms.
Internet and smartphone streaming expands quickly as mobile adoption accelerates. Younger viewers show high preference for on-the-go access and short-form highlights. Rising 5G penetration and lower data costs push more users toward mobile applications that allow flexible and real-time viewing. Although this segment carries a smaller share today, its growth rate outpaces television due to continuous shifts in device usage patterns. Both formats now operate in parallel and shape the broader consumption model for digital sports content.
By End-Use
Residential users generate most of the streaming volume due to subscription-based models and household viewing patterns. Growth continues as families bundle sports packages with broadband or connected TV services. Commercial buildings, including sports bars, restaurants, and entertainment venues, use streaming to supplement traditional broadcasts and attract peak-hour traffic. These establishments also adopt multi-screen setups that increase the need for reliable streaming feeds. Industrial facilities contribute a smaller portion of demand. Their role centers on training, internal events, and workforce engagement where streaming provides an efficient distribution method for sports-related content used in corporate programs.
By Region
North America leads the market with a 36.8 percent share and recorded 9.31 billion USD in revenue in 2023. Strong broadband coverage and high adoption of subscription video services continue to support regional demand. Europe follows with steady growth driven by the prominence of football and increasing digital investment by broadcasters. Asia Pacific shows the fastest expansion in 2025. India’s cricket audience, China’s basketball base, and rising esports consumption across Southeast Asia contribute to rapid uptake of mobile streaming.
Latin America and the Middle East and Africa show improving momentum. Mobile-first users and better internet access increase viewership for football and regional tournaments. These regions hold long-term potential as telecom operators bundle streaming services with data plans to bring more users into the paid ecosystem. Together, these regional patterns define the next phase of global growth for sports online live video streaming.
By Sports Type (Basketball Live Streaming, Football Live Streaming, Baseball Live Streaming, Tennis Live Streaming, Cricket Live Streaming), By Application (Television live streaming, Internet/Smartphones live streaming)
Research Methodology
Primary Research- 100 Interviews of Stakeholders
Secondary Research
Desk Research
Regional scope
North America (United States, Canada, Mexico)
Latin America (Brazil, Argentina, Columbia)
East Asia And Pacific (China, Japan, South Korea, Australia, Cambodia, Fiji, Indonesia)
Sea And South Asia (India, Singapore, Thailand, Taiwan, Malaysia)
Eastern Europe (Poland, Russia, Czech Republic, Romania)
Western Europe (Germany, U.K., France, Spain, Itlay)
Middle East & Africa (GCC Countries, Egypt, Nigeria, South Africa, Israel)
Competitive Landscape
LiveTV, DAZN US, Philo, BoxCast, Hulu + Live TV, Stream2watch, FuboTV, WatchESPN, Sling TV, FreeStreamsLive, FloSports, AT&T TV
Customization Scope
Customization for segments, region/country-level will be provided. Moreover, additional customization can be done based on the requirements.
Pricing and Purchase Options
Avail customized purchase options to meet your exact research needs. We have three licenses to opt for: Single User License, Multi-User License (Up to 5 Users), Corporate Use License (Unlimited User and Printable PDF).
TABLE OF CONTENTS
1. EXECUTIVE SUMMARY
1.1. MARKET SNAPSHOT
1.2. KEY FINDINGS & INSIGHTS
1.3. ANALYST RECOMMENDATIONS
1.4. FUTURE OUTLOOK
2. RESEARCH METHODOLOGY
2.1. MARKET DEFINITION & SCOPE
2.2. RESEARCH OBJECTIVES: PRIMARY & SECONDARY DATA SOURCES
2.3. DATA COLLECTION SOURCES
2.3.1. COVERAGE OF 100+ PRIMARY RESEARCH/CONSULTATION CALLS WITH INDUSTRY STAKEHOLDERS
FIGURE 17 NORTH AMERICA SPORTS ONLINE LIVE VIDEO STREAMINGCURRENT AND FUTURE TYPE ANALYSIS, 2025–2034, (USD MILLION)
FIGURE 18 NORTH AMERICA SPORTS ONLINE LIVE VIDEO STREAMINGCURRENT AND FUTURE END USER ANALYSIS, 2025–2034, (USD MILLION)
FIGURE 19 MARKET SHARE BY COUNTRY
FIGURE 20 LATIN AMERICA SPORTS ONLINE LIVE VIDEO STREAMINGCURRENT AND FUTURE TYPE ANALYSIS, 2025–2034, (USD MILLION)
FIGURE 21 LATIN AMERICA SPORTS ONLINE LIVE VIDEO STREAMINGCURRENT AND FUTURE END USER ANALYSIS, 2025–2034, (USD MILLION)
FIGURE 22 MARKET SHARE BY COUNTRY
FIGURE 23 EASTERN EUROPE SPORTS ONLINE LIVE VIDEO STREAMINGCURRENT AND FUTURE TYPE ANALYSIS, 2025–2034, (USD MILLION)
FIGURE 24 EASTERN EUROPE SPORTS ONLINE LIVE VIDEO STREAMINGCURRENT AND FUTURE END USER ANALYSIS, 2025–2034, (USD MILLION)
FIGURE 25 MARKET SHARE BY COUNTRY
FIGURE 26 WESTERN EUROPE SPORTS ONLINE LIVE VIDEO STREAMINGCURRENT AND FUTURE TYPE ANALYSIS, 2025–2034, (USD MILLION)
FIGURE 27 WESTERN EUROPE SPORTS ONLINE LIVE VIDEO STREAMINGCURRENT AND FUTURE END USER ANALYSIS, 2025–2034, (USD MILLION)
FIGURE 28 MARKET SHARE BY COUNTRY
FIGURE 29 EAST ASIA AND PACIFIC SPORTS ONLINE LIVE VIDEO STREAMINGCURRENT AND FUTURE TYPE ANALYSIS, 2025–2034, (USD MILLION)
FIGURE 30 EAST ASIA AND PACIFIC SPORTS ONLINE LIVE VIDEO STREAMINGCURRENT AND FUTURE END USER ANALYSIS, 2025–2034, (USD MILLION)
FIGURE 31 MARKET SHARE BY COUNTRY
FIGURE 32 SEA AND SOUTH ASIA SPORTS ONLINE LIVE VIDEO STREAMINGCURRENT AND FUTURE TYPE ANALYSIS, 2025–2034, (USD MILLION)
FIGURE 33 SEA AND SOUTH ASIA SPORTS ONLINE LIVE VIDEO STREAMINGCURRENT AND FUTURE END USER ANALYSIS, 2025–2034, (USD MILLION)
FIGURE 34 MARKET SHARE BY COUNTRY
FIGURE 35 MIDDLE EAST AND AFRICA SPORTS ONLINE LIVE VIDEO STREAMINGCURRENT AND FUTURE TYPE ANALYSIS, 2025–2034, (USD MILLION)
FIGURE 36 MIDDLE EAST AND AFRICA SPORTS ONLINE LIVE VIDEO STREAMINGCURRENT AND FUTURE END USER ANALYSIS, 2025–2034, (USD MILLION)
FIGURE 37 NORTH AMERICA SPORTS ONLINE LIVE VIDEO STREAMINGCURRENT AND FUTURE MARKET VOLUME SHARE REGIONAL ANALYSIS, 2025–2034, (USD MILLION)
FIGURE 38 U.S. SPORTS ONLINE LIVE VIDEO STREAMINGCURRENT AND FUTURE TYPE ANALYSIS, 2025–2034, (USD MILLION)
FIGURE 39 U.S. SPORTS ONLINE LIVE VIDEO STREAMINGCURRENT AND FUTURE END USER ANALYSIS, 2025–2034, (USD MILLION)
FIGURE 40 CANADA SPORTS ONLINE LIVE VIDEO STREAMINGCURRENT AND FUTURE TYPE ANALYSIS, 2025–2034, (USD MILLION)
FIGURE 41 CANADA SPORTS ONLINE LIVE VIDEO STREAMINGCURRENT AND FUTURE END USER ANALYSIS, 2025–2034, (USD MILLION)
FIGURE 42 LATIN AMERICA SPORTS ONLINE LIVE VIDEO STREAMINGCURRENT AND FUTURE MARKET VOLUME SHARE REGIONAL ANALYSIS, 2025–2034, (USD MILLION)
FIGURE 43 MEXICO SPORTS ONLINE LIVE VIDEO STREAMINGCURRENT AND FUTURE TYPE ANALYSIS, 2025–2034, (USD MILLION)
FIGURE 44 MEXICO SPORTS ONLINE LIVE VIDEO STREAMINGCURRENT AND FUTURE END USER ANALYSIS, 2025–2034, (USD MILLION)
FIGURE 45 BRAZIL SPORTS ONLINE LIVE VIDEO STREAMINGCURRENT AND FUTURE TYPE ANALYSIS, 2025–2034, (USD MILLION)
FIGURE 46 BRAZIL SPORTS ONLINE LIVE VIDEO STREAMINGCURRENT AND FUTURE END USER ANALYSIS, 2025–2034, (USD MILLION)
FIGURE 47 ARGENTINA SPORTS ONLINE LIVE VIDEO STREAMINGCURRENT AND FUTURE TYPE ANALYSIS, 2025–2034, (USD MILLION)
FIGURE 48 ARGENTINA SPORTS ONLINE LIVE VIDEO STREAMINGCURRENT AND FUTURE END USER ANALYSIS, 2025–2034, (USD MILLION)
FIGURE 49 COLUMBIA SPORTS ONLINE LIVE VIDEO STREAMINGCURRENT AND FUTURE TYPE ANALYSIS, 2025–2034, (USD MILLION)
FIGURE 50 COLUMBIA SPORTS ONLINE LIVE VIDEO STREAMINGCURRENT AND FUTURE END USER ANALYSIS, 2025–2034, (USD MILLION)
FIGURE 51 REST OF LATIN AMERICA SPORTS ONLINE LIVE VIDEO STREAMINGCURRENT AND FUTURE TYPE ANALYSIS, 2025–2034, (USD MILLION)
FIGURE 52 REST OF LATIN AMERICA SPORTS ONLINE LIVE VIDEO STREAMINGCURRENT AND FUTURE END USER ANALYSIS, 2025–2034, (USD MILLION)
FIGURE 53 EASTERN EUROPE SPORTS ONLINE LIVE VIDEO STREAMINGCURRENT AND FUTURE MARKET VOLUME SHARE REGIONAL ANALYSIS, 2025–2034, (USD MILLION)
FIGURE 54 POLAND SPORTS ONLINE LIVE VIDEO STREAMINGCURRENT AND FUTURE TYPE ANALYSIS, 2025–2034, (USD MILLION)
FIGURE 55 POLAND SPORTS ONLINE LIVE VIDEO STREAMINGCURRENT AND FUTURE END USER ANALYSIS, 2025–2034, (USD MILLION)
FIGURE 56 RUSSIA SPORTS ONLINE LIVE VIDEO STREAMINGCURRENT AND FUTURE TYPE ANALYSIS, 2025–2034, (USD MILLION)
FIGURE 57 RUSSIA SPORTS ONLINE LIVE VIDEO STREAMINGCURRENT AND FUTURE END USER ANALYSIS, 2025–2034, (USD MILLION)
FIGURE 58 CZECH REPUBLIC SPORTS ONLINE LIVE VIDEO STREAMINGCURRENT AND FUTURE TYPE ANALYSIS, 2025–2034, (USD MILLION)
FIGURE 59 CZECH REPUBLIC SPORTS ONLINE LIVE VIDEO STREAMINGCURRENT AND FUTURE END USER ANALYSIS, 2025–2034, (USD MILLION)
FIGURE 60 ROMANIA SPORTS ONLINE LIVE VIDEO STREAMINGCURRENT AND FUTURE TYPE ANALYSIS, 2025–2034, (USD MILLION)
FIGURE 61 ROMANIA SPORTS ONLINE LIVE VIDEO STREAMINGCURRENT AND FUTURE END USER ANALYSIS, 2025–2034, (USD MILLION)
FIGURE 62 REST OF EASTERN EUROPE SPORTS ONLINE LIVE VIDEO STREAMINGCURRENT AND FUTURE TYPE ANALYSIS, 2025–2034, (USD MILLION)
FIGURE 63 REST OF EASTERN EUROPE SPORTS ONLINE LIVE VIDEO STREAMINGCURRENT AND FUTURE END USER ANALYSIS, 2025–2034, (USD MILLION)
FIGURE 64 WESTERN EUROPE SPORTS ONLINE LIVE VIDEO STREAMINGCURRENT AND FUTURE MARKET VOLUME SHARE REGIONAL ANALYSIS, 2025–2034, (USD MILLION)
FIGURE 65 GERMANY SPORTS ONLINE LIVE VIDEO STREAMINGCURRENT AND FUTURE TYPE ANALYSIS, 2025–2034, (USD MILLION)
FIGURE 66 GERMANY SPORTS ONLINE LIVE VIDEO STREAMINGCURRENT AND FUTURE END USER ANALYSIS, 2025–2034, (USD MILLION)
FIGURE 67 FRANCE SPORTS ONLINE LIVE VIDEO STREAMINGCURRENT AND FUTURE TYPE ANALYSIS, 2025–2034, (USD MILLION)
FIGURE 68 FRANCE SPORTS ONLINE LIVE VIDEO STREAMINGCURRENT AND FUTURE END USER ANALYSIS, 2025–2034, (USD MILLION)
FIGURE 69 UK SPORTS ONLINE LIVE VIDEO STREAMINGCURRENT AND FUTURE TYPE ANALYSIS, 2025–2034, (USD MILLION)
FIGURE 70 UK SPORTS ONLINE LIVE VIDEO STREAMINGCURRENT AND FUTURE END USER ANALYSIS, 2025–2034, (USD MILLION)
FIGURE 71 SPAIN SPORTS ONLINE LIVE VIDEO STREAMINGCURRENT AND FUTURE TYPE ANALYSIS, 2025–2034, (USD MILLION)
FIGURE 72 SPAIN SPORTS ONLINE LIVE VIDEO STREAMINGCURRENT AND FUTURE END USER ANALYSIS, 2025–2034, (USD MILLION)
FIGURE 73 ITALY SPORTS ONLINE LIVE VIDEO STREAMINGCURRENT AND FUTURE TYPE ANALYSIS, 2025–2034, (USD MILLION)
FIGURE 74 ITALY SPORTS ONLINE LIVE VIDEO STREAMINGCURRENT AND FUTURE END USER ANALYSIS, 2025–2034, (USD MILLION)
FIGURE 75 REST OF WESTERN EUROPE SPORTS ONLINE LIVE VIDEO STREAMINGCURRENT AND FUTURE TYPE ANALYSIS, 2025–2034, (USD MILLION)
FIGURE 76 REST OF WESTERN EUROPE SPORTS ONLINE LIVE VIDEO STREAMINGCURRENT AND FUTURE END USER ANALYSIS, 2025–2034, (USD MILLION)
FIGURE 77 EAST ASIA AND PACIFIC SPORTS ONLINE LIVE VIDEO STREAMINGCURRENT AND FUTURE MARKET VOLUME SHARE REGIONAL ANALYSIS, 2025–2034, (USD MILLION)
FIGURE 78 CHINA SPORTS ONLINE LIVE VIDEO STREAMINGCURRENT AND FUTURE TYPE ANALYSIS, 2025–2034, (USD MILLION)
FIGURE 79 CHINA SPORTS ONLINE LIVE VIDEO STREAMINGCURRENT AND FUTURE END USER ANALYSIS, 2025–2034, (USD MILLION)
FIGURE 80 JAPAN SPORTS ONLINE LIVE VIDEO STREAMINGCURRENT AND FUTURE TYPE ANALYSIS, 2025–2034, (USD MILLION)
FIGURE 81 JAPAN SPORTS ONLINE LIVE VIDEO STREAMINGCURRENT AND FUTURE END USER ANALYSIS, 2025–2034, (USD MILLION)
FIGURE 82 AUSTRALIA SPORTS ONLINE LIVE VIDEO STREAMINGCURRENT AND FUTURE TYPE ANALYSIS, 2025–2034, (USD MILLION)
FIGURE 83 AUSTRALIA SPORTS ONLINE LIVE VIDEO STREAMINGCURRENT AND FUTURE END USER ANALYSIS, 2025–2034, (USD MILLION)
FIGURE 84 CAMBODIA SPORTS ONLINE LIVE VIDEO STREAMINGCURRENT AND FUTURE TYPE ANALYSIS, 2025–2034, (USD MILLION)
FIGURE 85 CAMBODIA SPORTS ONLINE LIVE VIDEO STREAMINGCURRENT AND FUTURE END USER ANALYSIS, 2025–2034, (USD MILLION)
FIGURE 86 FIJI SPORTS ONLINE LIVE VIDEO STREAMINGCURRENT AND FUTURE TYPE ANALYSIS, 2025–2034, (USD MILLION)
FIGURE 87 FIJI SPORTS ONLINE LIVE VIDEO STREAMINGCURRENT AND FUTURE END USER ANALYSIS, 2025–2034, (USD MILLION)
FIGURE 88 INDONESIA SPORTS ONLINE LIVE VIDEO STREAMINGCURRENT AND FUTURE TYPE ANALYSIS, 2025–2034, (USD MILLION)
FIGURE 89 INDONESIA SPORTS ONLINE LIVE VIDEO STREAMINGCURRENT AND FUTURE END USER ANALYSIS, 2025–2034, (USD MILLION)
FIGURE 90 SOUTH KOREA SPORTS ONLINE LIVE VIDEO STREAMINGCURRENT AND FUTURE TYPE ANALYSIS, 2025–2034, (USD MILLION)
FIGURE 91 SOUTH KOREA SPORTS ONLINE LIVE VIDEO STREAMINGCURRENT AND FUTURE END USER ANALYSIS, 2025–2034, (USD MILLION)
FIGURE 92 REST OF EAST ASIA AND PACIFIC SPORTS ONLINE LIVE VIDEO STREAMINGCURRENT AND FUTURE TYPE ANALYSIS, 2025–2034, (USD MILLION)
FIGURE 93 REST OF EAST ASIA AND PACIFIC SPORTS ONLINE LIVE VIDEO STREAMINGCURRENT AND FUTURE END USER ANALYSIS, 2025–2034, (USD MILLION)
FIGURE 94 SEA AND SOUTH ASIA SPORTS ONLINE LIVE VIDEO STREAMINGCURRENT AND FUTURE MARKET VOLUME SHARE REGIONAL ANALYSIS, 2025–2034, (USD MILLION)
FIGURE 95 BANGLADESH SPORTS ONLINE LIVE VIDEO STREAMINGCURRENT AND FUTURE TYPE ANALYSIS, 2025–2034, (USD MILLION)
FIGURE 96 BANGLADESH SPORTS ONLINE LIVE VIDEO STREAMINGCURRENT AND FUTURE END USER ANALYSIS, 2025–2034, (USD MILLION)
FIGURE 97 NEW ZEALAND SPORTS ONLINE LIVE VIDEO STREAMINGCURRENT AND FUTURE TYPE ANALYSIS, 2025–2034, (USD MILLION)
FIGURE 98 NEW ZEALAND SPORTS ONLINE LIVE VIDEO STREAMINGCURRENT AND FUTURE END USER ANALYSIS, 2025–2034, (USD MILLION)
FIGURE 99 INDIA SPORTS ONLINE LIVE VIDEO STREAMINGCURRENT AND FUTURE TYPE ANALYSIS, 2025–2034, (USD MILLION)
FIGURE 100 INDIA SPORTS ONLINE LIVE VIDEO STREAMINGCURRENT AND FUTURE END USER ANALYSIS, 2025–2034, (USD MILLION)
FIGURE 101 SINGAPORE SPORTS ONLINE LIVE VIDEO STREAMINGCURRENT AND FUTURE TYPE ANALYSIS, 2025–2034, (USD MILLION)
FIGURE 102 SINGAPORE SPORTS ONLINE LIVE VIDEO STREAMINGCURRENT AND FUTURE END USER ANALYSIS, 2025–2034, (USD MILLION)
FIGURE 103 THAILAND SPORTS ONLINE LIVE VIDEO STREAMINGCURRENT AND FUTURE TYPE ANALYSIS, 2025–2034, (USD MILLION)
FIGURE 104 THAILAND SPORTS ONLINE LIVE VIDEO STREAMINGCURRENT AND FUTURE END USER ANALYSIS, 2025–2034, (USD MILLION)
FIGURE 105 TAIWAN SPORTS ONLINE LIVE VIDEO STREAMINGCURRENT AND FUTURE TYPE ANALYSIS, 2025–2034, (USD MILLION)
FIGURE 106 TAIWAN SPORTS ONLINE LIVE VIDEO STREAMINGCURRENT AND FUTURE END USER ANALYSIS, 2025–2034, (USD MILLION)
FIGURE 107 MALAYSIA SPORTS ONLINE LIVE VIDEO STREAMINGCURRENT AND FUTURE TYPE ANALYSIS, 2025–2034, (USD MILLION)
FIGURE 108 MALAYSIA SPORTS ONLINE LIVE VIDEO STREAMINGCURRENT AND FUTURE END USER ANALYSIS, 2025–2034, (USD MILLION)
FIGURE 109 REST OF SEA AND SOUTH ASIA SPORTS ONLINE LIVE VIDEO STREAMINGCURRENT AND FUTURE TYPE ANALYSIS, 2025–2034, (USD MILLION)
FIGURE 110 REST OF SEA AND SOUTH ASIA SPORTS ONLINE LIVE VIDEO STREAMINGCURRENT AND FUTURE END USER ANALYSIS, 2025–2034, (USD MILLION)
FIGURE 111 MIDDLE EAST AND AFRICA SPORTS ONLINE LIVE VIDEO STREAMINGCURRENT AND FUTURE MARKET VOLUME SHARE REGIONAL ANALYSIS, 2025–2034, (USD MILLION)
FIGURE 112 GCC COUNTRIES SPORTS ONLINE LIVE VIDEO STREAMINGCURRENT AND FUTURE TYPE ANALYSIS, 2025–2034, (USD MILLION)
FIGURE 113 GCC COUNTRIES SPORTS ONLINE LIVE VIDEO STREAMINGCURRENT AND FUTURE END USER ANALYSIS, 2025–2034, (USD MILLION)
FIGURE 114 SAUDI ARABIA SPORTS ONLINE LIVE VIDEO STREAMINGCURRENT AND FUTURE TYPE ANALYSIS, 2025–2034, (USD MILLION)
FIGURE 115 SAUDI ARABIA SPORTS ONLINE LIVE VIDEO STREAMINGCURRENT AND FUTURE END USER ANALYSIS, 2025–2034, (USD MILLION)
FIGURE 116 UAE SPORTS ONLINE LIVE VIDEO STREAMINGCURRENT AND FUTURE TYPE ANALYSIS, 2025–2034, (USD MILLION)
FIGURE 117 UAE SPORTS ONLINE LIVE VIDEO STREAMINGCURRENT AND FUTURE END USER ANALYSIS, 2025–2034, (USD MILLION)
FIGURE 118 BAHRAIN SPORTS ONLINE LIVE VIDEO STREAMINGCURRENT AND FUTURE TYPE ANALYSIS, 2025–2034, (USD MILLION)
FIGURE 119 BAHRAIN SPORTS ONLINE LIVE VIDEO STREAMINGCURRENT AND FUTURE END USER ANALYSIS, 2025–2034, (USD MILLION)
FIGURE 120 KUWAIT SPORTS ONLINE LIVE VIDEO STREAMINGCURRENT AND FUTURE TYPE ANALYSIS, 2025–2034, (USD MILLION)
FIGURE 121 KUWAIT SPORTS ONLINE LIVE VIDEO STREAMINGCURRENT AND FUTURE END USER ANALYSIS, 2025–2034, (USD MILLION)
FIGURE 122 OMAN SPORTS ONLINE LIVE VIDEO STREAMINGCURRENT AND FUTURE TYPE ANALYSIS, 2025–2034, (USD MILLION)
FIGURE 123 OMAN SPORTS ONLINE LIVE VIDEO STREAMINGCURRENT AND FUTURE END USER ANALYSIS, 2025–2034, (USD MILLION)
FIGURE 124 QATAR SPORTS ONLINE LIVE VIDEO STREAMINGCURRENT AND FUTURE TYPE ANALYSIS, 2025–2034, (USD MILLION)
FIGURE 125 QATAR SPORTS ONLINE LIVE VIDEO STREAMINGCURRENT AND FUTURE END USER ANALYSIS, 2025–2034, (USD MILLION)
FIGURE 126 EGYPT SPORTS ONLINE LIVE VIDEO STREAMINGCURRENT AND FUTURE TYPE ANALYSIS, 2025–2034, (USD MILLION)
FIGURE 127 EGYPT SPORTS ONLINE LIVE VIDEO STREAMINGCURRENT AND FUTURE END USER ANALYSIS, 2025–2034, (USD MILLION)
FIGURE 128 NIGERIA SPORTS ONLINE LIVE VIDEO STREAMINGCURRENT AND FUTURE TYPE ANALYSIS, 2025–2034, (USD MILLION)
FIGURE 129 NIGERIA SPORTS ONLINE LIVE VIDEO STREAMINGCURRENT AND FUTURE END USER ANALYSIS, 2025–2034, (USD MILLION)
FIGURE 130 SOUTH AFRICA SPORTS ONLINE LIVE VIDEO STREAMINGCURRENT AND FUTURE TYPE ANALYSIS, 2025–2034, (USD MILLION)
FIGURE 131 SOUTH AFRICA SPORTS ONLINE LIVE VIDEO STREAMINGCURRENT AND FUTURE END USER ANALYSIS, 2025–2034, (USD MILLION)
FIGURE 132 ISRAEL SPORTS ONLINE LIVE VIDEO STREAMINGCURRENT AND FUTURE TYPE ANALYSIS, 2025–2034, (USD MILLION)
FIGURE 133 ISRAEL SPORTS ONLINE LIVE VIDEO STREAMINGCURRENT AND FUTURE END USER ANALYSIS, 2025–2034, (USD MILLION)
FIGURE 134 REST OF MEA SPORTS ONLINE LIVE VIDEO STREAMINGCURRENT AND FUTURE TYPE ANALYSIS, 2025–2034, (USD MILLION)
FIGURE 135 REST OF MEA SPORTS ONLINE LIVE VIDEO STREAMINGCURRENT AND FUTURE END USER ANALYSIS, 2025–2034, (USD MILLION)
FIGURE 136 U. S. MARKET SHARE ANALYSIS BY TYPE (2024)
FIGURE 137 U. S. MARKET SHARE ANALYSIS BY END USER (2024)
FIGURE 138 CANADA MARKET SHARE ANALYSIS BY TYPE (2024)
FIGURE 139 CANADA MARKET SHARE ANALYSIS BY END USER (2024)
FIGURE 140 MEXICO MARKET SHARE ANALYSIS BY TYPE (2024)
FIGURE 141 MEXICO MARKET SHARE ANALYSIS BY END USER (2024)
FIGURE 142 CHINA MARKET SHARE ANALYSIS BY TYPE (2024)
FIGURE 143 CHINA MARKET SHARE ANALYSIS BY END USER (2024)
FIGURE 144 JAPAN MARKET SHARE ANALYSIS BY TYPE (2024)
FIGURE 145 JAPAN MARKET SHARE ANALYSIS BY END USER (2024)
FIGURE 146 INDIA MARKET SHARE ANALYSIS BY TYPE (2024)
FIGURE 147 INDIA MARKET SHARE ANALYSIS BY END USER (2024)
FIGURE 148 SOUTH KOREA MARKET SHARE ANALYSIS BY TYPE (2024)
FIGURE 149 SOUTH KOREA MARKET SHARE ANALYSIS BY END USER (2024)
FIGURE 150 SAUDI ARABIA MARKET SHARE ANALYSIS BY TYPE (2024)
FIGURE 151 SAUDI ARABIA MARKET SHARE ANALYSIS BY END USER (2024)
FIGURE 152 UAE MARKET SHARE ANALYSIS BY TYPE (2024)
FIGURE 153 UAE MARKET SHARE ANALYSIS BY END USER (2024)
FIGURE 154 EGYPT MARKET SHARE ANALYSIS BY TYPE (2024)
FIGURE 155 EGYPT MARKET SHARE ANALYSIS BY END USER (2024)
FIGURE 156 NIGERIA MARKET SHARE ANALYSIS BY TYPE (2024)
FIGURE 157 NIGERIA MARKET SHARE ANALYSIS BY END USER (2024)
FIGURE 158 SOUTH AFRICA MARKET SHARE ANALYSIS BY TYPE (2024)
FIGURE 159 SOUTH AFRICA MARKET SHARE ANALYSIS BY END USER (2024)
FIGURE 160 GERMANY MARKET SHARE ANALYSIS BY TYPE (2024)
FIGURE 161 GERMANY MARKET SHARE ANALYSIS BY END USER (2024)
FIGURE 162 FRANCE MARKET SHARE ANALYSIS BY TYPE (2024)
FIGURE 163 FRANCE MARKET SHARE ANALYSIS BY END USER (2024)
FIGURE 164 UK MARKET SHARE ANALYSIS BY TYPE (2024)
FIGURE 165 UK MARKET SHARE ANALYSIS BY END USER (2024)
FIGURE 166 SPAIN MARKET SHARE ANALYSIS BY TYPE (2024)
FIGURE 167 SPAIN MARKET SHARE ANALYSIS BY END USER (2024)
FIGURE 168 ITALY MARKET SHARE ANALYSIS BY TYPE (2024)
FIGURE 169 ITALY MARKET SHARE ANALYSIS BY END USER (2024)
FIGURE 170 BRAZIL MARKET SHARE ANALYSIS BY TYPE (2024)
FIGURE 171 BRAZIL MARKET SHARE ANALYSIS BY END USER (2024)
FIGURE 172 ARGENTINA MARKET SHARE ANALYSIS BY TYPE (2024)
FIGURE 173 ARGENTINA MARKET SHARE ANALYSIS BY END USER (2024)
FIGURE 174 COLUMBIA MARKET SHARE ANALYSIS BY TYPE (2024)
FIGURE 175 COLUMBIA MARKET SHARE ANALYSIS BY END USER (2024)
FIGURE 176 GLOBAL SPORTS ONLINE LIVE VIDEO STREAMINGCURRENT AND FUTURE MARKET KEY COUNTRY LEVEL ANALYSIS, 2024–2034, (USD MILLION)
FIGURE 177 FINANCIAL OVERVIEW:
Key Player Analysis
LiveTV: LiveTV positions itself as a challenger in the global sports streaming landscape. The platform attracts a large base of real-time viewers seeking fast access to international sports events, particularly football, basketball, and combat sports. Its model relies on high-traffic streaming infrastructure that supports large concurrent audiences, which helps it capture strong engagement during peak tournaments. LiveTV has expanded its coverage footprint across Europe and parts of Asia to meet rising demand for cross-border sports access. The platform integrates automated feeds and multi-source aggregation to maintain continuity during major events. Its differentiator lies in broad content availability and rapid stream updates, which strengthen its appeal in markets with high sports intensity but limited official broadcast options.
Hulu + Live TV: Hulu + Live TV holds the position of a market leader in North America with a subscriber base that passed 4.6 million in early 2025. Its value proposition centers on bundling live sports with an established on-demand library, which strengthens retention across diverse viewer segments. The service continues to secure premium sports rights partnerships, including expanded coverage in football, basketball, and regional college athletics. Hulu invests heavily in AI-driven personalization engines that tailor sports recommendations and viewing layouts. The platform also upgrades its network delivery systems to support low-latency broadcasts during high-profile events. These moves position Hulu + Live TV as a preferred streaming hub for households seeking unified access to live and on-demand content.
FreeStreamsLive: FreeStreamsLive acts as a niche player that attracts audiences seeking open-access sports streams across global leagues. While it does not operate under the subscription-based model of major platforms, it sustains high traffic during international tournaments and playoff seasons. The service covers a broad mix of sports, including football, cricket, baseball, and minor league events that often receive limited visibility on mainstream networks. Its presence is strongest in regions where formal broadcaster coverage remains fragmented. The platform invests in rapid stream sourcing and real-time updates to reduce downtime during live matches. FreeStreamsLive differentiates itself through extensive sport diversity and ease of access, although regulatory and compliance pressures shape its ability to expand into more structured commercial models.
Market Key Players
LiveTV
DAZN US
Philo
BoxCast
Hulu + Live TV
Stream2watch
FuboTV
WatchESPN
Sling TV
FreeStreamsLive
FloSports
AT&T TV
Driver: Infrastructure and Connectivity Gains
Global Bandwidth and Latency Reduction
By 2026, the streaming market will benefit from major global infrastructure upgrades, especially as 5G coverage expands beyond urban centers into wider economic areas. Viewers no longer accept buffering as a norm; they expect seamless high-definition delivery. Modern platforms have reduced latency by up to 30 percent compared to 2022, creating a "real-time" feel for live broadcasts that wasn't possible before. This technical stability is crucial for managing the high concurrency needed for large global events.
Multi-Device Optimization and Premium Reach
The need for reliable access on smartphones, tablets, and connected TVs requires providers to use more advanced compression technologies and multi-CDN setups. This change not only satisfies viewers but also creates a stronger environment for advertisers, who can confidently reach audiences during peak sporting moments without worrying about stream failures. As engagement rises due to improved reliability, platforms find it easier to support premium pricing models and tiered subscription options for high-bandwidth content.
Restraint: The Persistence of the Digital Divide
Regional Disparities in Network Stability
Despite global advancements, network reliability varies greatly, leading to an uneven experience for audiences. Many large rural and semi-urban groups in Asia, Africa, and Latin America often have average speeds below the 15 Mbps needed for stable HD streaming. This lack of "last-mile" infrastructure results in high churn rates during major tournaments, as viewers in these areas deal with frequent buffering and signal loss at crucial moments.
Cost Burdens of Underconnected Markets
For streaming operators, these regional challenges pose a significant hurdle to accessing high-growth, high-population markets. Developing and maintaining lower-bandwidth options, such as "lite" apps or highly compressed data-saver streams that strive to meet basic quality standards, creates an inherent cost burden. Supporting a variety of connection speeds complicates technical planning and diverts resources from developing advanced features.
Opportunity: 5G Maturation and AI Monetization
High-Concurrency 5G Ecosystems
The next stage of market growth is driven by the rapid development of 5G, expected to account for 60 percent of new mobile connections in developed markets by 2027. This connectivity enables platforms to provide advanced features like seamless multi-angle viewing and instant volumetric replays without straining the user's connection. This environment supports much higher concurrency, allowing millions of fans to watch the same high-quality stream at the same time without a drop in service.
AI-Driven ARPU Growth
At the same time, AI-driven processes are changing how platforms engage with their data to increase revenue. AI systems can now create automated highlights in real-time and design personalized dashboards tailored to each fan's preferences. These smart features, along with context-based advertising that aligns with live action, can boost Average Revenue Per User (ARPU) by 12 to 18 percent. This creates a strong opportunity to monetize previously disengaged audiences through targeted content and sponsorships.
Trend: Participation-Driven Viewing
Interactive and Social Integration
Interactive viewing has changed from a novelty to a key need for sports streaming in 2026. Platforms are increasingly incorporating real-time polls, synchronized "watch-party" features, and social chat functions that turn a passive viewing experience into an active community event. Early data shows that sessions using these interactive tools achieve a 25 percent increase in watch time, as users stay engaged with the app to connect with other fans and affect the broadcast.
Immersive and Volumetric Replays
In areas with high broadband availability, immersive formats like POV camera feeds and volumetric 3D replays are gaining popularity. These technologies let fans "step onto the field" and view important plays from various angles, offering depth that traditional television can't provide. For product roadmaps, this trend indicates a clear move towards participation-driven viewing, which not only enhances user retention but also opens up entirely new categories of valuable sponsorship opportunities.
Recent Developments
Dec 2024 – Hulu + Live TV: Hulu expanded its sports portfolio by securing streaming rights for a new package of regional basketball and football events valued at over USD 120 million. The deal lifts subscriber engagement during peak seasons and strengthens Hulu’s position in premium domestic sports streaming.
Feb 2025 – YouTube TV: YouTube TV launched an AI-assisted viewer dashboard that personalizes multi-angle feeds and real-time statistics for more than 3 million active sports users. This upgrade enhances retention for high-frequency viewers and supports higher ad-yield per session.
Apr 2025 – Amazon Prime Video: Amazon expanded Thursday Night Football coverage into three additional markets in Europe and Latin America, adding an estimated 8 million new addressable households. The expansion reinforces Amazon’s global sports footprint and deepens its influence in cross-border streaming rights.
Jul 2025 – ESPN+: ESPN+ introduced a tiered subscription package that includes 4K streaming and exclusive pre- and post-game content, projected to increase ARPU by 10 to 14 percent. The move strengthens ESPN’s monetization framework as competition intensifies across live sports platforms.
Sep 2025 – DAZN: DAZN acquired a minority stake in a regional streaming provider in Southeast Asia in a transaction valued at roughly USD 65 million. The acquisition widens DAZN’s access to fast-growing cricket and combat-sports audiences in emerging markets and expands its footprint in mobile-first regions.