Strategy Games Market Size Growth & Forecast | CAGR of 10.8%
Global Strategy Games Market Size, Share & Analysis By Device Type (Mobile, PC, Tablets, Other Device Types), By Business Model (Free-to-Play (Ad-Supported), Freemium, Subscription-Based), By Monetization Model, Esports Influence, Player Engagement Trends & Forecast 2025–2034
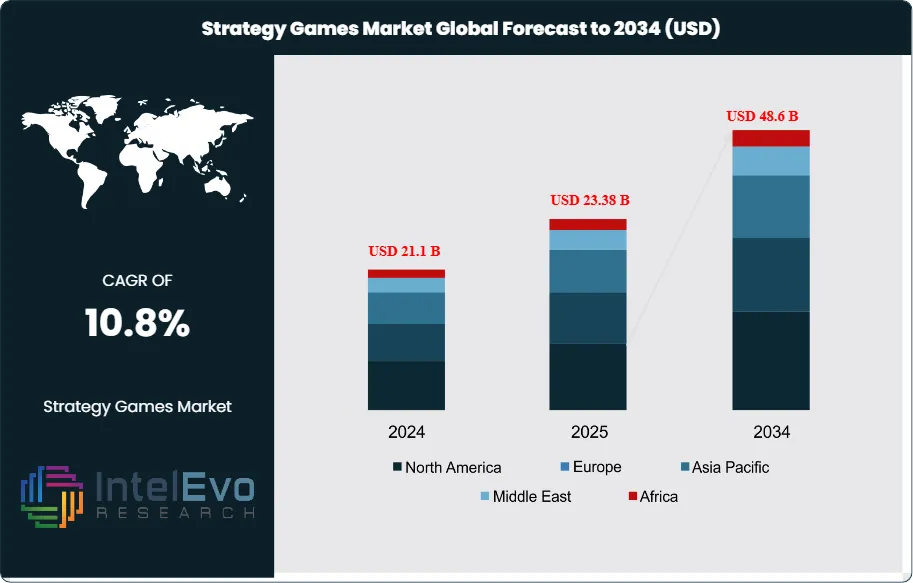
The Strategy Games Market is valued at approximately USD 21.1 billion in 2024 and is projected to reach nearly USD 48.6 billion by 2034, expanding at a CAGR of around 10.8% during 2025–2034. This surge reflects the explosive rise of mobile-first gaming, cross-platform ecosystems, and AI-driven live operations that keep players engaged longer. With esports visibility, influencer-powered discovery, and creator economies scaling rapidly, the strategy gaming segment is entering its most profitable decade. The mix of real-time PvP, social competition, and immersive content drops is transforming strategy games into global entertainment powerhouses.
Growth reflects a steady broadening of the player base and rising monetization depth across premium, free-to-play, and live-service models. Asia-Pacific led with a 40.1% share in 2024—about USD 7.05 billion—supported by mobile-first engagement and competitive communities, while North America and Europe remain sizable revenue pools on PC and console. The forecast implies a net addition of approximately USD 20.8 billion and a near 2.2× expansion of addressable spend over the period, with the mix tilting toward always-online, multiplayer-centric formats.
Demand is underpinned by the intellectual appeal of real-time and turn-based strategy (RTS/TBS), esports-driven visibility, and deeper social loops that lift retention. On the supply side, digital distribution and cross-platform tooling lower barriers for independent studios, even as production values and live-ops expectations push up budgets and staffing needs. Key risks include platform-policy shifts, approval timelines in tightly regulated markets, data-privacy obligations that raise user-acquisition costs, and the ongoing need to balance monetization with fair-play design.
Technology is a central accelerant. Advancements in artificial intelligence and machine learning are yielding adaptive opponents, procedural map generation, and smarter matchmaking, elevating replayability and increasing lifetime value. Cloud infrastructure and analytics enable at-scale telemetry, rapid balance patches, and content cadence, while cross-play, cross-progression, and mod support expand network effects and extend product lifecycles. Automation in testing and content pipelines is shortening iteration cycles, allowing developers to respond faster to meta shifts without compromising stability.
Regionally, Asia-Pacific is expected to remain the volume anchor, with mobile connectivity and competitive ecosystems in markets such as China, Korea, and Japan driving high engagement. Europe is an investment bright spot: targeted public funding—e.g., the UK’s grants of over £3 million to 22 studios and Germany’s ongoing program of up to €50 million annually covering as much as 50% of prototype costs—continues to catalyze studio formation and innovation. North America offers premium ARPU and franchise longevity, while emerging hotspots across India and Southeast Asia present outsized upside as payment penetration and local publishing partnerships mature. Collectively, these dynamics position strategy games for durable, innovation-led growth through 2034.
Key Takeaways
Market Growth: The global Strategy Games market totals USD 21.1 billion (2024) and is projected to reach USD 48.6 billion by 2034 (10.8% CAGR), adding ~USD 27.5 billion in incremental revenue; expansion is propelled by mobile penetration, live-service monetization, and AI-enhanced gameplay depth.
Device Type: Mobile led with 42.3% revenue share in 2024 (≈USD 7.45 billion), underpinned by smartphone ubiquity, 5G connectivity, and shorter session loops suited to on-the-go play.
Business Model: Freemium captured 54.0% of 2024 revenue (≈USD 9.50 billion), reflecting the strength of in-app purchases, battle passes, and live-ops events that extend lifetime value and monetize broad player funnels.
Driver: Integration of AI/ML and competitive multiplayer is lifting engagement—adaptive opponents, procedural content, and smarter matchmaking sustain replayability and session length across RTS/TBS titles (e.g., Supercell, Lilith, Paradox, Sega/Creative Assembly).
Restraint: Economics remain pressured by platform fees of up to 30% on major mobile storefronts and tightening privacy/IDFA regimes, which elevate user-acquisition costs and raise breakeven thresholds for midcore titles.
Opportunity: Asia–Pacific (APAC), already at 40.1% share and USD 7.05 billion (2024), could exceed ~USD 15.4 billion by 2034 if it maintains current share; outsized upside exists in India and Southeast Asia via vernacular content, esports partnerships, and localized payments.
Trend: The genre is shifting toward cross-platform, live-service strategies—cross-play/progression, rapid balance patches, and mod support—while AI-assisted content pipelines shorten release cycles; the freemium mix (54% in 2024) signals continued tilt to service-led monetization.
Regional Analysis: APAC leads (40.1% share; USD 7.05 billion in 2024), while Europe benefits from public funding—e.g., UK grants of £3 million to 22 studios and Germany’s program of up to €50 million annually covering up to 50% of prototype costs—supporting innovation; North America remains a high-ARPU base for premium PC/console franchises.
Device Type Analysis
Mobile remains the growth engine of strategy gaming in 2025, building on its 2024 lead (42.3% share) as 5G penetration, mid-range GPU gains, and lower data costs expand the playable audience. On a 2025 market of roughly USD 20.6 billion (implied from an 8.1% CAGR off 2024), mobile is projected to approach the mid-40s share, or ≈USD 9.1 billion at a 44% mix, driven by mid-core titles with deeper live-ops and touch-optimized UI/UX. PCs retain a resilient second position, favored by real-time and grand-strategy enthusiasts who value precision controls, mod ecosystems, and high-fidelity simulations; premium + DLC monetization and long-tail engagement support stable ARPU even as player time fragments across platforms.
Tablets occupy a defensible niche for map-dense, turn-based play thanks to larger screens and stylus support, while “other device types” (handheld PCs, cloud-ready consoles, hybrid devices) are the fastest-growing tail as cross-play and cross-progression blur device boundaries. Handheld PC adoption (e.g., Steam Deck-class devices) and improving game-streaming latency are expanding portable access to PC-grade complexity—supporting an ecosystem where device choice tracks session length, input preference, and content depth rather than hardware constraints.
Business Model Analysis
Freemium continues to dominate monetization in 2025, scaling from a 54.0% share in 2024 to an expected mid-50s mix as battle passes, cosmetic IAPs, and seasonal content deepen conversion. At a 55% assumption, freemium would generate ≈USD 11.3 billion in 2025, led by live-service strategy titles that pair frequent balance patches with limited-time events to lift payer share and average revenue per paying user.
Free-to-Play (ad-supported) remains the cost-of-entry for casual and emerging-market cohorts, capturing a material low-30s share as rewarded video and interstitial formats improve eCPMs without excessive churn. Subscription-based models—still a minority but rising into the low-teens—benefit from platform bundles and content vaults that de-risk discovery while smoothing revenue for publishers. Key headwinds across models include platform fees (often up to 30%), privacy-driven UA friction, and the need for tighter economy design to maintain fair-play sentiment as monetization depth increases.
Regional Analysis
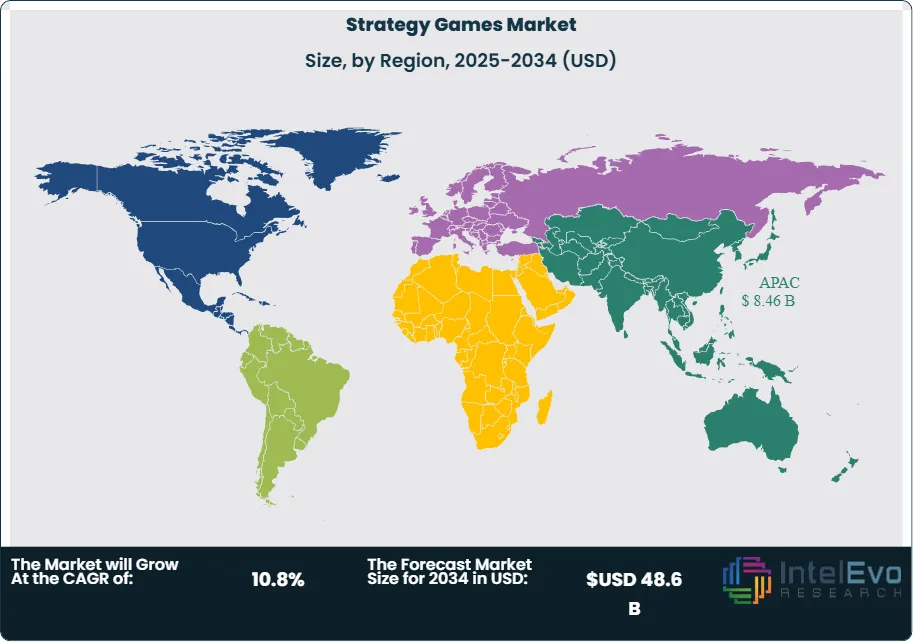
Asia Pacific retains global leadership in 2025, extending its 2024 position (40.1% share; USD 7.05 billion) toward ≈USD 8.2–8.4 billion as mobile-first ecosystems in China, South Korea, Japan, India, and Southeast Asia deepen competitive play, creator-led discovery, and microtransaction familiarity. High tournament visibility and publisher-run leagues continue to reinforce strategy genres’ watchability and community retention.
North America remains the highest-ARPU market, anchored by PC/console franchises and robust DLC/mod communities that lengthen lifecycles. Europe sustains a broad base of strategy studios and players, supported by a mix of premium and live-service models and ongoing public support programs that encourage prototyping and innovation. Latin America and the Middle East & Africa, though smaller today, are expanding faster than the global average—often at low double-digit CAGRs—on improving payments, localized publishing, and budget Android hardware. Net-net, regional dynamics favor mobile-led scale in APAC and emerging markets, with PC/console monetization depth preserving margin in North America and Europe, positioning the category for durable, geographically diversified growth beyond 2025.
By Device Type (Mobile, PC, Tablets, Other Device Types), By Business Model (Free-to-Play (Ad-Supported), Freemium, Subscription-Based)
Research Methodology
Primary Research- 100 Interviews of Stakeholders
Secondary Research
Desk Research
Regional scope
North America (United States, Canada, Mexico)
Latin America (Brazil, Argentina, Columbia)
East Asia And Pacific (China, Japan, South Korea, Australia, Cambodia, Fiji, Indonesia)
Sea And South Asia (India, Singapore, Thailand, Taiwan, Malaysia)
Eastern Europe (Poland, Russia, Czech Republic, Romania)
Western Europe (Germany, U.K., France, Spain, Itlay)
Middle East & Africa (GCC Countries, Egypt, Nigeria, South Africa, Israel)
Competitive Landscape
Relic Entertainment, Ubisoft Entertainment SA, Bandai Namco Entertainment, Firaxis Games, Epic Games, Inc., Nintendo Co., Ltd., Creative Assembly, Blizzard Entertainment, Inc., Paradox Interactive AB, Electronic Arts Inc., Other Key Player
Customization Scope
Customization for segments, region/country-level will be provided. Moreover, additional customization can be done based on the requirements.
Pricing and Purchase Options
Avail customized purchase options to meet your exact research needs. We have three licenses to opt for: Single User License, Multi-User License (Up to 5 Users), Corporate Use License (Unlimited User and Printable PDF).
TABLE OF CONTENTS
1. EXECUTIVE SUMMARY
1.1. MARKET SNAPSHOT
1.2. KEY FINDINGS & INSIGHTS
1.3. ANALYST RECOMMENDATIONS
1.4. FUTURE OUTLOOK
2. RESEARCH METHODOLOGY
2.1. MARKET DEFINITION & SCOPE
2.2. RESEARCH OBJECTIVES: PRIMARY & SECONDARY DATA SOURCES
2.3. DATA COLLECTION SOURCES
2.3.1. COVERAGE OF 100+ PRIMARY RESEARCH/CONSULTATION CALLS WITH INDUSTRY STAKEHOLDERS
FIGURE 17 NORTH AMERICA STRATEGY GAMES CURRENT AND FUTURE TYPE ANALYSIS, 2025–2034, (USD MILLION)
FIGURE 18 NORTH AMERICA STRATEGY GAMES CURRENT AND FUTURE END USER ANALYSIS, 2025–2034, (USD MILLION)
FIGURE 19 MARKET SHARE BY COUNTRY
FIGURE 20 LATIN AMERICA STRATEGY GAMES CURRENT AND FUTURE TYPE ANALYSIS, 2025–2034, (USD MILLION)
FIGURE 21 LATIN AMERICA STRATEGY GAMES CURRENT AND FUTURE END USER ANALYSIS, 2025–2034, (USD MILLION)
FIGURE 22 MARKET SHARE BY COUNTRY
FIGURE 23 EASTERN EUROPE STRATEGY GAMES CURRENT AND FUTURE TYPE ANALYSIS, 2025–2034, (USD MILLION)
FIGURE 24 EASTERN EUROPE STRATEGY GAMES CURRENT AND FUTURE END USER ANALYSIS, 2025–2034, (USD MILLION)
FIGURE 25 MARKET SHARE BY COUNTRY
FIGURE 26 WESTERN EUROPE STRATEGY GAMES CURRENT AND FUTURE TYPE ANALYSIS, 2025–2034, (USD MILLION)
FIGURE 27 WESTERN EUROPE STRATEGY GAMES CURRENT AND FUTURE END USER ANALYSIS, 2025–2034, (USD MILLION)
FIGURE 28 MARKET SHARE BY COUNTRY
FIGURE 29 EAST ASIA AND PACIFIC STRATEGY GAMES CURRENT AND FUTURE TYPE ANALYSIS, 2025–2034, (USD MILLION)
FIGURE 30 EAST ASIA AND PACIFIC STRATEGY GAMES CURRENT AND FUTURE END USER ANALYSIS, 2025–2034, (USD MILLION)
FIGURE 31 MARKET SHARE BY COUNTRY
FIGURE 32 SEA AND SOUTH ASIA STRATEGY GAMES CURRENT AND FUTURE TYPE ANALYSIS, 2025–2034, (USD MILLION)
FIGURE 33 SEA AND SOUTH ASIA STRATEGY GAMES CURRENT AND FUTURE END USER ANALYSIS, 2025–2034, (USD MILLION)
FIGURE 34 MARKET SHARE BY COUNTRY
FIGURE 35 MIDDLE EAST AND AFRICA STRATEGY GAMES CURRENT AND FUTURE TYPE ANALYSIS, 2025–2034, (USD MILLION)
FIGURE 36 MIDDLE EAST AND AFRICA STRATEGY GAMES CURRENT AND FUTURE END USER ANALYSIS, 2025–2034, (USD MILLION)
FIGURE 37 NORTH AMERICA STRATEGY GAMES CURRENT AND FUTURE MARKET VOLUME SHARE REGIONAL ANALYSIS, 2025–2034, (USD MILLION)
FIGURE 38 U.S. STRATEGY GAMES CURRENT AND FUTURE TYPE ANALYSIS, 2025–2034, (USD MILLION)
FIGURE 39 U.S. STRATEGY GAMES CURRENT AND FUTURE END USER ANALYSIS, 2025–2034, (USD MILLION)
FIGURE 40 CANADA STRATEGY GAMES CURRENT AND FUTURE TYPE ANALYSIS, 2025–2034, (USD MILLION)
FIGURE 41 CANADA STRATEGY GAMES CURRENT AND FUTURE END USER ANALYSIS, 2025–2034, (USD MILLION)
FIGURE 42 LATIN AMERICA STRATEGY GAMES CURRENT AND FUTURE MARKET VOLUME SHARE REGIONAL ANALYSIS, 2025–2034, (USD MILLION)
FIGURE 43 MEXICO STRATEGY GAMES CURRENT AND FUTURE TYPE ANALYSIS, 2025–2034, (USD MILLION)
FIGURE 44 MEXICO STRATEGY GAMES CURRENT AND FUTURE END USER ANALYSIS, 2025–2034, (USD MILLION)
FIGURE 45 BRAZIL STRATEGY GAMES CURRENT AND FUTURE TYPE ANALYSIS, 2025–2034, (USD MILLION)
FIGURE 46 BRAZIL STRATEGY GAMES CURRENT AND FUTURE END USER ANALYSIS, 2025–2034, (USD MILLION)
FIGURE 47 ARGENTINA STRATEGY GAMES CURRENT AND FUTURE TYPE ANALYSIS, 2025–2034, (USD MILLION)
FIGURE 48 ARGENTINA STRATEGY GAMES CURRENT AND FUTURE END USER ANALYSIS, 2025–2034, (USD MILLION)
FIGURE 49 COLUMBIA STRATEGY GAMES CURRENT AND FUTURE TYPE ANALYSIS, 2025–2034, (USD MILLION)
FIGURE 50 COLUMBIA STRATEGY GAMES CURRENT AND FUTURE END USER ANALYSIS, 2025–2034, (USD MILLION)
FIGURE 51 REST OF LATIN AMERICA STRATEGY GAMES CURRENT AND FUTURE TYPE ANALYSIS, 2025–2034, (USD MILLION)
FIGURE 52 REST OF LATIN AMERICA STRATEGY GAMES CURRENT AND FUTURE END USER ANALYSIS, 2025–2034, (USD MILLION)
FIGURE 53 EASTERN EUROPE STRATEGY GAMES CURRENT AND FUTURE MARKET VOLUME SHARE REGIONAL ANALYSIS, 2025–2034, (USD MILLION)
FIGURE 54 POLAND STRATEGY GAMES CURRENT AND FUTURE TYPE ANALYSIS, 2025–2034, (USD MILLION)
FIGURE 55 POLAND STRATEGY GAMES CURRENT AND FUTURE END USER ANALYSIS, 2025–2034, (USD MILLION)
FIGURE 56 RUSSIA STRATEGY GAMES CURRENT AND FUTURE TYPE ANALYSIS, 2025–2034, (USD MILLION)
FIGURE 57 RUSSIA STRATEGY GAMES CURRENT AND FUTURE END USER ANALYSIS, 2025–2034, (USD MILLION)
FIGURE 58 CZECH REPUBLIC STRATEGY GAMES CURRENT AND FUTURE TYPE ANALYSIS, 2025–2034, (USD MILLION)
FIGURE 59 CZECH REPUBLIC STRATEGY GAMES CURRENT AND FUTURE END USER ANALYSIS, 2025–2034, (USD MILLION)
FIGURE 60 ROMANIA STRATEGY GAMES CURRENT AND FUTURE TYPE ANALYSIS, 2025–2034, (USD MILLION)
FIGURE 61 ROMANIA STRATEGY GAMES CURRENT AND FUTURE END USER ANALYSIS, 2025–2034, (USD MILLION)
FIGURE 62 REST OF EASTERN EUROPE STRATEGY GAMES CURRENT AND FUTURE TYPE ANALYSIS, 2025–2034, (USD MILLION)
FIGURE 63 REST OF EASTERN EUROPE STRATEGY GAMES CURRENT AND FUTURE END USER ANALYSIS, 2025–2034, (USD MILLION)
FIGURE 64 WESTERN EUROPE STRATEGY GAMES CURRENT AND FUTURE MARKET VOLUME SHARE REGIONAL ANALYSIS, 2025–2034, (USD MILLION)
FIGURE 65 GERMANY STRATEGY GAMES CURRENT AND FUTURE TYPE ANALYSIS, 2025–2034, (USD MILLION)
FIGURE 66 GERMANY STRATEGY GAMES CURRENT AND FUTURE END USER ANALYSIS, 2025–2034, (USD MILLION)
FIGURE 67 FRANCE STRATEGY GAMES CURRENT AND FUTURE TYPE ANALYSIS, 2025–2034, (USD MILLION)
FIGURE 68 FRANCE STRATEGY GAMES CURRENT AND FUTURE END USER ANALYSIS, 2025–2034, (USD MILLION)
FIGURE 69 UK STRATEGY GAMES CURRENT AND FUTURE TYPE ANALYSIS, 2025–2034, (USD MILLION)
FIGURE 70 UK STRATEGY GAMES CURRENT AND FUTURE END USER ANALYSIS, 2025–2034, (USD MILLION)
FIGURE 71 SPAIN STRATEGY GAMES CURRENT AND FUTURE TYPE ANALYSIS, 2025–2034, (USD MILLION)
FIGURE 72 SPAIN STRATEGY GAMES CURRENT AND FUTURE END USER ANALYSIS, 2025–2034, (USD MILLION)
FIGURE 73 ITALY STRATEGY GAMES CURRENT AND FUTURE TYPE ANALYSIS, 2025–2034, (USD MILLION)
FIGURE 74 ITALY STRATEGY GAMES CURRENT AND FUTURE END USER ANALYSIS, 2025–2034, (USD MILLION)
FIGURE 75 REST OF WESTERN EUROPE STRATEGY GAMES CURRENT AND FUTURE TYPE ANALYSIS, 2025–2034, (USD MILLION)
FIGURE 76 REST OF WESTERN EUROPE STRATEGY GAMES CURRENT AND FUTURE END USER ANALYSIS, 2025–2034, (USD MILLION)
FIGURE 77 EAST ASIA AND PACIFIC STRATEGY GAMES CURRENT AND FUTURE MARKET VOLUME SHARE REGIONAL ANALYSIS, 2025–2034, (USD MILLION)
FIGURE 78 CHINA STRATEGY GAMES CURRENT AND FUTURE TYPE ANALYSIS, 2025–2034, (USD MILLION)
FIGURE 79 CHINA STRATEGY GAMES CURRENT AND FUTURE END USER ANALYSIS, 2025–2034, (USD MILLION)
FIGURE 80 JAPAN STRATEGY GAMES CURRENT AND FUTURE TYPE ANALYSIS, 2025–2034, (USD MILLION)
FIGURE 81 JAPAN STRATEGY GAMES CURRENT AND FUTURE END USER ANALYSIS, 2025–2034, (USD MILLION)
FIGURE 82 AUSTRALIA STRATEGY GAMES CURRENT AND FUTURE TYPE ANALYSIS, 2025–2034, (USD MILLION)
FIGURE 83 AUSTRALIA STRATEGY GAMES CURRENT AND FUTURE END USER ANALYSIS, 2025–2034, (USD MILLION)
FIGURE 84 CAMBODIA STRATEGY GAMES CURRENT AND FUTURE TYPE ANALYSIS, 2025–2034, (USD MILLION)
FIGURE 85 CAMBODIA STRATEGY GAMES CURRENT AND FUTURE END USER ANALYSIS, 2025–2034, (USD MILLION)
FIGURE 86 FIJI STRATEGY GAMES CURRENT AND FUTURE TYPE ANALYSIS, 2025–2034, (USD MILLION)
FIGURE 87 FIJI STRATEGY GAMES CURRENT AND FUTURE END USER ANALYSIS, 2025–2034, (USD MILLION)
FIGURE 88 INDONESIA STRATEGY GAMES CURRENT AND FUTURE TYPE ANALYSIS, 2025–2034, (USD MILLION)
FIGURE 89 INDONESIA STRATEGY GAMES CURRENT AND FUTURE END USER ANALYSIS, 2025–2034, (USD MILLION)
FIGURE 90 SOUTH KOREA STRATEGY GAMES CURRENT AND FUTURE TYPE ANALYSIS, 2025–2034, (USD MILLION)
FIGURE 91 SOUTH KOREA STRATEGY GAMES CURRENT AND FUTURE END USER ANALYSIS, 2025–2034, (USD MILLION)
FIGURE 92 REST OF EAST ASIA AND PACIFIC STRATEGY GAMES CURRENT AND FUTURE TYPE ANALYSIS, 2025–2034, (USD MILLION)
FIGURE 93 REST OF EAST ASIA AND PACIFIC STRATEGY GAMES CURRENT AND FUTURE END USER ANALYSIS, 2025–2034, (USD MILLION)
FIGURE 94 SEA AND SOUTH ASIA STRATEGY GAMES CURRENT AND FUTURE MARKET VOLUME SHARE REGIONAL ANALYSIS, 2025–2034, (USD MILLION)
FIGURE 95 BANGLADESH STRATEGY GAMES CURRENT AND FUTURE TYPE ANALYSIS, 2025–2034, (USD MILLION)
FIGURE 96 BANGLADESH STRATEGY GAMES CURRENT AND FUTURE END USER ANALYSIS, 2025–2034, (USD MILLION)
FIGURE 97 NEW ZEALAND STRATEGY GAMES CURRENT AND FUTURE TYPE ANALYSIS, 2025–2034, (USD MILLION)
FIGURE 98 NEW ZEALAND STRATEGY GAMES CURRENT AND FUTURE END USER ANALYSIS, 2025–2034, (USD MILLION)
FIGURE 99 INDIA STRATEGY GAMES CURRENT AND FUTURE TYPE ANALYSIS, 2025–2034, (USD MILLION)
FIGURE 100 INDIA STRATEGY GAMES CURRENT AND FUTURE END USER ANALYSIS, 2025–2034, (USD MILLION)
FIGURE 101 SINGAPORE STRATEGY GAMES CURRENT AND FUTURE TYPE ANALYSIS, 2025–2034, (USD MILLION)
FIGURE 102 SINGAPORE STRATEGY GAMES CURRENT AND FUTURE END USER ANALYSIS, 2025–2034, (USD MILLION)
FIGURE 103 THAILAND STRATEGY GAMES CURRENT AND FUTURE TYPE ANALYSIS, 2025–2034, (USD MILLION)
FIGURE 104 THAILAND STRATEGY GAMES CURRENT AND FUTURE END USER ANALYSIS, 2025–2034, (USD MILLION)
FIGURE 105 TAIWAN STRATEGY GAMES CURRENT AND FUTURE TYPE ANALYSIS, 2025–2034, (USD MILLION)
FIGURE 106 TAIWAN STRATEGY GAMES CURRENT AND FUTURE END USER ANALYSIS, 2025–2034, (USD MILLION)
FIGURE 107 MALAYSIA STRATEGY GAMES CURRENT AND FUTURE TYPE ANALYSIS, 2025–2034, (USD MILLION)
FIGURE 108 MALAYSIA STRATEGY GAMES CURRENT AND FUTURE END USER ANALYSIS, 2025–2034, (USD MILLION)
FIGURE 109 REST OF SEA AND SOUTH ASIA STRATEGY GAMES CURRENT AND FUTURE TYPE ANALYSIS, 2025–2034, (USD MILLION)
FIGURE 110 REST OF SEA AND SOUTH ASIA STRATEGY GAMES CURRENT AND FUTURE END USER ANALYSIS, 2025–2034, (USD MILLION)
FIGURE 111 MIDDLE EAST AND AFRICA STRATEGY GAMES CURRENT AND FUTURE MARKET VOLUME SHARE REGIONAL ANALYSIS, 2025–2034, (USD MILLION)
FIGURE 112 GCC COUNTRIES STRATEGY GAMES CURRENT AND FUTURE TYPE ANALYSIS, 2025–2034, (USD MILLION)
FIGURE 113 GCC COUNTRIES STRATEGY GAMES CURRENT AND FUTURE END USER ANALYSIS, 2025–2034, (USD MILLION)
FIGURE 114 SAUDI ARABIA STRATEGY GAMES CURRENT AND FUTURE TYPE ANALYSIS, 2025–2034, (USD MILLION)
FIGURE 115 SAUDI ARABIA STRATEGY GAMES CURRENT AND FUTURE END USER ANALYSIS, 2025–2034, (USD MILLION)
FIGURE 116 UAE STRATEGY GAMES CURRENT AND FUTURE TYPE ANALYSIS, 2025–2034, (USD MILLION)
FIGURE 117 UAE STRATEGY GAMES CURRENT AND FUTURE END USER ANALYSIS, 2025–2034, (USD MILLION)
FIGURE 118 BAHRAIN STRATEGY GAMES CURRENT AND FUTURE TYPE ANALYSIS, 2025–2034, (USD MILLION)
FIGURE 119 BAHRAIN STRATEGY GAMES CURRENT AND FUTURE END USER ANALYSIS, 2025–2034, (USD MILLION)
FIGURE 120 KUWAIT STRATEGY GAMES CURRENT AND FUTURE TYPE ANALYSIS, 2025–2034, (USD MILLION)
FIGURE 121 KUWAIT STRATEGY GAMES CURRENT AND FUTURE END USER ANALYSIS, 2025–2034, (USD MILLION)
FIGURE 122 OMAN STRATEGY GAMES CURRENT AND FUTURE TYPE ANALYSIS, 2025–2034, (USD MILLION)
FIGURE 123 OMAN STRATEGY GAMES CURRENT AND FUTURE END USER ANALYSIS, 2025–2034, (USD MILLION)
FIGURE 124 QATAR STRATEGY GAMES CURRENT AND FUTURE TYPE ANALYSIS, 2025–2034, (USD MILLION)
FIGURE 125 QATAR STRATEGY GAMES CURRENT AND FUTURE END USER ANALYSIS, 2025–2034, (USD MILLION)
FIGURE 126 EGYPT STRATEGY GAMES CURRENT AND FUTURE TYPE ANALYSIS, 2025–2034, (USD MILLION)
FIGURE 127 EGYPT STRATEGY GAMES CURRENT AND FUTURE END USER ANALYSIS, 2025–2034, (USD MILLION)
FIGURE 128 NIGERIA STRATEGY GAMES CURRENT AND FUTURE TYPE ANALYSIS, 2025–2034, (USD MILLION)
FIGURE 129 NIGERIA STRATEGY GAMES CURRENT AND FUTURE END USER ANALYSIS, 2025–2034, (USD MILLION)
FIGURE 130 SOUTH AFRICA STRATEGY GAMES CURRENT AND FUTURE TYPE ANALYSIS, 2025–2034, (USD MILLION)
FIGURE 131 SOUTH AFRICA STRATEGY GAMES CURRENT AND FUTURE END USER ANALYSIS, 2025–2034, (USD MILLION)
FIGURE 132 ISRAEL STRATEGY GAMES CURRENT AND FUTURE TYPE ANALYSIS, 2025–2034, (USD MILLION)
FIGURE 133 ISRAEL STRATEGY GAMES CURRENT AND FUTURE END USER ANALYSIS, 2025–2034, (USD MILLION)
FIGURE 134 REST OF MEA STRATEGY GAMES CURRENT AND FUTURE TYPE ANALYSIS, 2025–2034, (USD MILLION)
FIGURE 135 REST OF MEA STRATEGY GAMES CURRENT AND FUTURE END USER ANALYSIS, 2025–2034, (USD MILLION)
FIGURE 136 U. S. MARKET SHARE ANALYSIS BY TYPE (2024)
FIGURE 137 U. S. MARKET SHARE ANALYSIS BY END USER (2024)
FIGURE 138 CANADA MARKET SHARE ANALYSIS BY TYPE (2024)
FIGURE 139 CANADA MARKET SHARE ANALYSIS BY END USER (2024)
FIGURE 140 MEXICO MARKET SHARE ANALYSIS BY TYPE (2024)
FIGURE 141 MEXICO MARKET SHARE ANALYSIS BY END USER (2024)
FIGURE 142 CHINA MARKET SHARE ANALYSIS BY TYPE (2024)
FIGURE 143 CHINA MARKET SHARE ANALYSIS BY END USER (2024)
FIGURE 144 JAPAN MARKET SHARE ANALYSIS BY TYPE (2024)
FIGURE 145 JAPAN MARKET SHARE ANALYSIS BY END USER (2024)
FIGURE 146 INDIA MARKET SHARE ANALYSIS BY TYPE (2024)
FIGURE 147 INDIA MARKET SHARE ANALYSIS BY END USER (2024)
FIGURE 148 SOUTH KOREA MARKET SHARE ANALYSIS BY TYPE (2024)
FIGURE 149 SOUTH KOREA MARKET SHARE ANALYSIS BY END USER (2024)
FIGURE 150 SAUDI ARABIA MARKET SHARE ANALYSIS BY TYPE (2024)
FIGURE 151 SAUDI ARABIA MARKET SHARE ANALYSIS BY END USER (2024)
FIGURE 152 UAE MARKET SHARE ANALYSIS BY TYPE (2024)
FIGURE 153 UAE MARKET SHARE ANALYSIS BY END USER (2024)
FIGURE 154 EGYPT MARKET SHARE ANALYSIS BY TYPE (2024)
FIGURE 155 EGYPT MARKET SHARE ANALYSIS BY END USER (2024)
FIGURE 156 NIGERIA MARKET SHARE ANALYSIS BY TYPE (2024)
FIGURE 157 NIGERIA MARKET SHARE ANALYSIS BY END USER (2024)
FIGURE 158 SOUTH AFRICA MARKET SHARE ANALYSIS BY TYPE (2024)
FIGURE 159 SOUTH AFRICA MARKET SHARE ANALYSIS BY END USER (2024)
FIGURE 160 GERMANY MARKET SHARE ANALYSIS BY TYPE (2024)
FIGURE 161 GERMANY MARKET SHARE ANALYSIS BY END USER (2024)
FIGURE 162 FRANCE MARKET SHARE ANALYSIS BY TYPE (2024)
FIGURE 163 FRANCE MARKET SHARE ANALYSIS BY END USER (2024)
FIGURE 164 UK MARKET SHARE ANALYSIS BY TYPE (2024)
FIGURE 165 UK MARKET SHARE ANALYSIS BY END USER (2024)
FIGURE 166 SPAIN MARKET SHARE ANALYSIS BY TYPE (2024)
FIGURE 167 SPAIN MARKET SHARE ANALYSIS BY END USER (2024)
FIGURE 168 ITALY MARKET SHARE ANALYSIS BY TYPE (2024)
FIGURE 169 ITALY MARKET SHARE ANALYSIS BY END USER (2024)
FIGURE 170 BRAZIL MARKET SHARE ANALYSIS BY TYPE (2024)
FIGURE 171 BRAZIL MARKET SHARE ANALYSIS BY END USER (2024)
FIGURE 172 ARGENTINA MARKET SHARE ANALYSIS BY TYPE (2024)
FIGURE 173 ARGENTINA MARKET SHARE ANALYSIS BY END USER (2024)
FIGURE 174 COLUMBIA MARKET SHARE ANALYSIS BY TYPE (2024)
FIGURE 175 COLUMBIA MARKET SHARE ANALYSIS BY END USER (2024)
FIGURE 176 GLOBAL STRATEGY GAMES CURRENT AND FUTURE MARKET KEY COUNTRY LEVEL ANALYSIS, 2024–2034, (USD MILLION)
FIGURE 177 FINANCIAL OVERVIEW:
Key Player Analysis
Firaxis Games: Leader in turn-based 4X strategy anchored by the Civilization franchise. In 2025 the studio expanded the addressable audience with Sid Meier’s Civilization VII – VR on Meta Quest 3/3S, extending the brand into mixed reality and strengthening cross-franchise engagement loops; Firaxis also maintains a steady post-launch cadence for Civ VII (e.g., Patch 1.2.4 in Aug 2025 and a cross-play branch) to stabilize retention and sentiment.
Firaxis’ near-term focus is modernization of toolchains and service operations, though the studio enacted workforce reductions in September 2025—a sign of sharper cost discipline amid live-ops complexity. Take-Two leadership nevertheless reiterated confidence in Civ VII’s long-tail economics, signaling continued investment in updates and monetization refinement through FY26.
Paradox Interactive AB: Leader in grand strategy with a durable DLC/expansion model. Paradox broadened reach via a December 2024 Ubisoft partnership bundle (Victoria 3 x Anno 1800), leveraging co-marketing to drive franchise trial and conversion. In 2025, it re-shaped monetization and content packaging around Vampire: The Masquerade – Bloodlines 2, adding clans to the base game and adjusting preorder terms following community feedback—moves aimed at protecting launch revenue while de-risking backlash ahead of the October 21, 2025 release. Paradox also tightened operating discipline with a return-to-office policy phased in from February 2025, impacting cost structure and collaboration.
Differentiators include a deep mod ecosystem and “games-as-platforms” economics—frequent DLC beats, creator support, and long tails across Stellaris, Crusader Kings, and Hearts of Iron—positioning Paradox to monetize high-engagement niches while offsetting new-title risk.
Creative Assembly: Leader/innovator in large-scale real-time tactics with the Total War franchise. The studio is staging a 25th-anniversary showcase in December 2025 to unveil the “next era” of Total War, an event designed to refresh the roadmap and catalyze re-engagement across PC and console cohorts. While 2025 saw a schedule reset—Tides of Torment for Total War: WARHAMMER III was delayed from summer to later in the year—the decision underscores an explicit quality bar that protects franchise equity and DLC attach rates.
CA’s edge remains production scale (art, AI, and battle simulation depth) and an installed base primed for paid expansions; disciplined pacing and community comms in 2H25 will be pivotal to sustaining ARPU and sentiment into 2026.
Relic Entertainment: Challenger/innovator in RTS, now an independent studio after its March 2024 carve-out backed by Emona Capital. In 2025 Relic outlined a three-pillar strategy—deepen support for existing titles, ship smaller-scope games via an internal initiative, and revisit classics—and announced Earth vs Mars (turn-based) as a lighter-weight release to diversify risk and shorten iteration cycles.
Independence allows Relic to rebalance portfolio risk, align roadmaps to cash flow, and rebuild community trust around Company of Heroes while exploring new IP. Investor backing adds financing flexibility, though execution hinges on tighter live-ops and content velocity after prior restructuring.
Market Key Players
Relic Entertainment
Ubisoft Entertainment SA
Bandai Namco Entertainment
Firaxis Games
Epic Games, Inc.
Nintendo Co., Ltd.
Creative Assembly
Blizzard Entertainment, Inc.
Paradox Interactive AB
Electronic Arts Inc.
Other Key Player
Driver:
Strong Market Momentum Driven by Live Ops & Cross-Platform Play
As of 2025, the strategy games category is expanding on a resilient, service-led footing, with the market estimated at ~USD 20.6 billion and tracking toward USD 38.4 billion by 2034 (8.1% CAGR). Growth is anchored in mobile-first adoption and cross-platform engagement that keep player networks liquid across devices. The core driver is deeper live operations supported by analytics and AI/ML—adaptive opponents, smarter matchmaking, and procedural content that sustain replayability and increase average revenue per paying user (ARPPU) without inflating churn. Esports visibility and creator ecosystems amplify discovery and retention, reinforcing the engagement loop for both real-time and turn-based subgenres.
Strategically, these capabilities shift value from one-off launches to enduring services. Publishers that pair rapid balance patches with seasonal events and battle passes are lifting conversion and extending title lifecycles, while cross-progression keeps cohorts intact as players switch between mobile, PC, and new handheld PCs. The result is a compounding monetization profile—more sessions per user, higher payer share, and improved lifetime value across top franchises.
Restraint:
Rising Development Complexity Pressuring Margins & Scalability
Rising production and live-ops complexity are tightening unit economics in 2025. Strategy titles demand large content pipelines (units, maps, UI states) and continuous tuning, pushing development budgets and tooling requirements higher; app store fees (commonly up to 30%) and privacy-led user acquisition friction further compress margins. Additionally, approval timelines in tightly regulated markets and anti-cheat/fair-play safeguards add latency and cost to launches.
The impact is twofold: smaller studios face elevated breakeven points and greater dependence on platform featuring, while larger publishers must continually optimize economy design to avoid pay-to-win perceptions that erode retention. Without disciplined roadmap governance and automated QA/telemetry, content cadence lags can translate into mid-cycle DAU decay and higher reacquisition costs.
Opportunity:
High-Growth Opportunities in Mobile-First Emerging Markets
The most attractive upside sits at the intersection of mobile-first economies and emerging geographies. Asia Pacific, already the largest region (40%+ share in 2024), can exceed USD 15 billion by 2034 if it maintains mix, with India and Southeast Asia poised for low double-digit CAGRs as payments, local publishing, and vernacular content deepen penetration. On the product side, mid-core, touch-optimized strategy with synchronous PvP and creator-integrated live events is positioned to outgrow the category average through 2025–2030.
Technologically, AI-assisted development (automated testing, balance simulations, and asset generation) is reducing iteration cycles—early deployments indicate 20–30% faster content updates—unlocking more frequent events and improved personalization. Publishers that institutionalize these toolchains can scale roadmaps without linear headcount growth, widening gross margin on live services.
Trend:
Shift Toward Cross-Platform “Forever Games” and AI-Powered Personalization
Cross-platform, service-centric models are becoming the default configuration for strategy games in 2025. Cross-play and cross-progression are now standard in leading launches, while mod support and UGC extend tail engagement on PC and spill over to cloud/handheld ecosystems. Concurrently, generative AI is moving from experimentation to production, informing NPC behavior, scenario generation, and difficulty adaptation that personalize challenge curves at scale.
This operational shift favors portfolios built around “forever games” with predictable content seasons, modular monetization (battle passes, cosmetics, expansions), and strong community ops. Investors should expect valuation premiums for publishers demonstrating reliable live-ops telemetry, automated pipelines, and multi-region compliance capabilities—capabilities that translate directly into higher retention, stronger payer conversion, and more durable cash flows through the decade.
Recent Developments
Dec 2024 – Paradox Interactive & Ubisoft: Announced a Victoria 3 x Anno 1800 bundle to cross-pollinate audiences and boost seasonal sell-through. Strategic impact: Low-risk acquisition funnel for grand-strategy newcomers that can raise DLC attach on both catalogs.
Feb 2025 – Firaxis/2K: Revealed Civilization VII – VR for Meta Quest (spring launch window), reimagining Civ with board-game-style mixed reality. Strategic impact: Expands Civ’s TAM into VR early adopters and strengthens franchise reach beyond PC/console.
Apr 2025 – Paradox Interactive: Implemented a phased return-to-office policy (4 days on-site from Feb; 5 days by Sep 2025). Strategic impact: Aims to improve cross-team coordination for live-ops and launches, while posing retention/travel-cost trade-offs.
Jul 2025 – Creative Assembly: Delayed Total War: WARHAMMER III – Tides of Torment from summer to later in 2025 after playtest feedback. Strategic impact: Protects DLC quality and franchise goodwill, albeit with short-term revenue deferral.
Sep 2025 – Firaxis/2K: Workforce reduction at Firaxis as part of development restructuring on Civ VII. Strategic impact: Tightens cost base and refocuses resources on post-launch stabilization to preserve Civ’s long-tail economics.
Sep 2025 – Paradox Interactive: Adjusted Bloodlines 2 monetization and refunded certain PlayStation preorders following community pushback; expanded base-game content (additional clans) ahead of Oct 21, 2025 launch. Strategic impact: Reduces pricing risk at launch and aligns content value with player expectations to safeguard pre-order momentum.