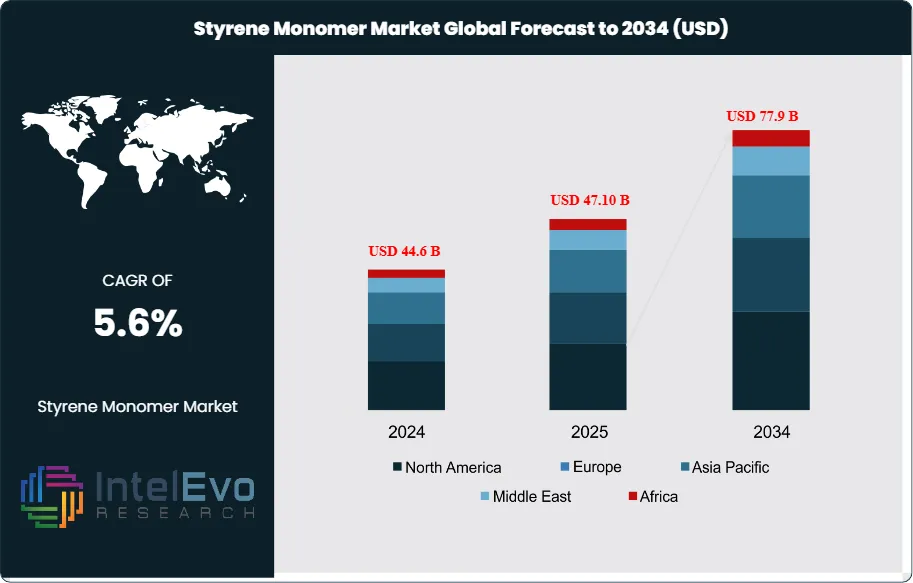
The Styrene Monomer Market size is projected to be worth around USD 77.9 Billion by 2034, up from USD 44.6 Billion in 2024, growing at a CAGR of 5.6% during the forecast period from 2025 to 2034. Rising demand for polystyrene, ABS, and synthetic rubber across packaging, automotive, and construction sectors continues to fuel market expansion. The shift toward lightweight materials and sustainable polymer innovations is also expected to reshape the global styrene value chain. With the Asia-Pacific region leading consumption, key manufacturers are focusing on production efficiency and green chemistry solutions to maintain competitiveness.
The Styrene Monomer (SM) market is a vital segment of the global petrochemical industry, serving as a key raw material for various polymers and resins. Styrene monomer is primarily produced through two processes: Ethylbenzene Dehydrogenation and Propylene Oxide Styrene Monomer (POSM). The market's growth is driven by its applications in producing polystyrene, acrylonitrile butadiene styrene (ABS), styrene-butadiene rubber (SBR), and other derivatives used across industries such as automotive, packaging, electronics, construction, and healthcare.
The availability and cost of raw materials like benzene and ethylene significantly influence the styrene monomer market. Fluctuations in crude oil prices directly affect the prices of these feedstocks, thereby impacting the production cost of styrene monomer. Supply chain disruptions and geopolitical tensions can lead to volatility in raw material supply and pricing.
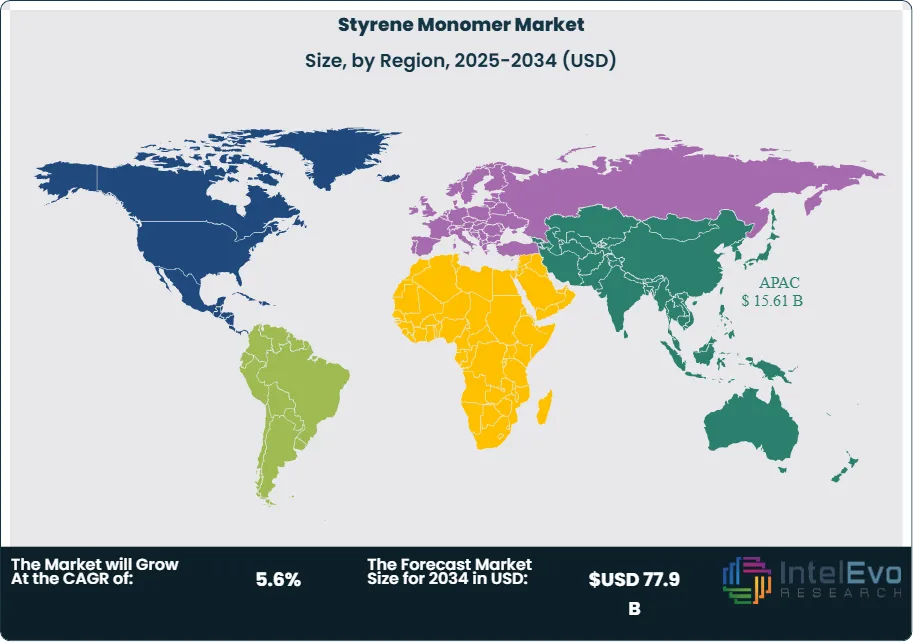
The Asia-Pacific region dominates the global styrene monomer market, accounting for approximately 65.9% of the market share. This dominance is attributed to rapid industrialization, urbanization, and the presence of major manufacturing hubs in countries like China, India, and South Korea. The region's demand is driven by the automotive, packaging, and construction industries. North America and Europe follow, with significant consumption in automotive and electronics sectors. Latin America and the Middle East & Africa are emerging markets, with growth driven by infrastructure development and increasing industrial activities.
The COVID-19 pandemic disrupted the styrene monomer market through supply chain interruptions, reduced industrial activities, and fluctuating demand. Lockdowns and restrictions led to decreased consumption in automotive and construction sectors, while the packaging industry saw increased demand due to the rise in e-commerce and food packaging needs. The market is gradually recovering as industries resume operations and adapt to the new normal, with a focus on sustainability and resilience in supply chains.
Key Takeaways:
Market Growth: The Styrene Monomer Market is expected to reach USD 77.9 Billion by 2034, growing at a robust CAGR of 5.6% from 2024, growing demand from the packaging industry, especially for polystyrene, due to its lightweight and insulating properties is fueling the market.
Production Process Dominance: Ethylbenzene Dehydrogenation remains the leading production method for styrene due to its cost efficiency, high yield, and industrial reliability. While the Propylene Oxide route offers valuable co-products, its complexity limits widespread adoption, though sustainability concerns may drive future innovation.
Application Dominance: Polystyrene holds the largest share in styrene applications, especially in packaging and insulation. However, ABS is rapidly gaining traction due to its growing use in automotive, electronics, and 3D printing, marking a shift toward more versatile, high-performance plastics.
End-Use Industry Dominance: Packaging continues to dominate as the primary end-use industry due to the high consumption of polystyrene-based products. Meanwhile, the automotive and electronics sectors are poised for strong growth, fueled by rising demand for lightweight and durable polymer components.
Driver: Driving factors include strong demand across packaging, automotive, and construction sectors, where its derivatives like polystyrene and ABS are valued for their durability, insulation properties, and ease of molding. Additionally, industrial growth in emerging economies and innovations in polymerization technology are enhancing production efficiency, supporting global market expansion.
Restraint: Health concerns surrounding styrene exposure, along with strict environmental regulations from global authorities, have increased compliance costs and operational complexity. Moreover, fluctuating raw material prices and a gradual industry shift toward eco-friendly alternatives are challenging long-term market stability.
Opportunity: The rise of electric vehicles and infrastructure development in developing countries is creating new applications for lightweight, high-performance styrene-based materials. There is also growing momentum in circular economy efforts, including polystyrene recycling and the development of bio-based monomers, offering companies a chance to tap into sustainable growth markets.
Trend: Technological advancements in chemical recycling are enabling efficient reuse of styrene plastics, promoting closed-loop systems that align with global sustainability goals. At the same time, digitalization and a strategic shift in manufacturing to cost-effective regions are transforming supply chains and driving greater efficiency and competitiveness across the industry.
Regional Analysis: Asia-Pacific leads the Styrene Monomer market due to robust manufacturing sectors in China, India, and Southeast Asia, alongside strong demand from packaging, construction, and automotive industries. North America maintains a significant market share driven by established automotive and electronics industries, coupled with advanced polymer R&D.
Production Process Analysis:
Ethylbenzene Dehydrogenation Leads with over 75% Market Share in Styrene Monomer Market. Ethylbenzene Dehydrogenation dominates due to its maturity, cost-effectiveness, and widespread industrial integration. This method offers high yield and is widely adopted by major manufacturers. On the other hand, the Propylene Oxide process, while producing valuable co-products like propylene glycol, is comparatively more complex and less prevalent. The dominance of ethylbenzene dehydrogenation is expected to persist due to its scalability and proven efficiency in large-scale operations. However, environmental regulations and innovations may encourage gradual shifts toward cleaner, integrated processes.
Application Analysis:
Polystyrene leads in market share due to its vast application in packaging, insulation, and consumer goods. However, ABS is expected to grow rapidly, driven by increasing use in automotive interiors, electronics, and 3D printing. SBR also maintains a strong presence in tire and footwear manufacturing. As industries seek materials that balance cost, durability, and lightweight properties, engineered plastics like ABS and SAN are becoming increasingly attractive. This trend will likely reshape the application dynamics in the near future.
End-Use Industry Analysis:
Packaging is the dominant end-use sector due to high consumption of PS for food containers, disposable cutlery, and insulation materials. However, the Automotive and Electronics sectors are emerging as high-growth areas, fueled by demand for lightweight and durable components. With electric vehicles and smart devices on the rise, the need for advanced polymers like ABS and ASA is accelerating. Meanwhile, the Healthcare and Construction sectors continue to use styrene-based materials for medical tools and insulation, contributing to steady demand.
Region Analysis:
Asia-Pacific Leads With over 45% Market Share In Styrene Monomer Market. Asia-Pacific dominates the global Styrene Monomer market due to its massive production capacity, lower labor costs, and increasing demand from end-use sectors such as packaging, automotive, and construction. China remains a major consumer and producer, while India is rapidly emerging due to industrialization and growing urban infrastructure. The region benefits from favorable government policies and rising middle-class consumption of electronics and packaged goods. North America, while mature, maintains demand stability through innovation, especially in high-performance applications like ABS in the automotive sector. Europe, though affected by environmental restrictions, is investing heavily in sustainable alternatives and recycling technologies, reshaping long-term growth potential. Latin America is witnessing moderate but steady expansion due to growing urban development and increasing consumer demand. The Middle East & Africa are at the early stages of development but offer significant future opportunities as infrastructure projects and industrialization pick up pace.
By Production Process (Ethylbenzene Dehydrogenation, Catalytic Dehydrogenation, Oxidative Dehydrogenation, Others), By End-Use Industry (Automotive & Transportation, Construction & Building Materials, Packaging, Consumer Goods & Appliances, Electrical & Electronics, Marine & Aerospace, Others), By Application (Polystyrene, Acrylonitrile Butadiene Styrene (ABS), Styrene-Butadiene Rubber (SBR), Unsaturated Polyester Resin (UPR), Expanded Polystyrene (EPS), Acrylonitrile Styrene Acrylate (ASA), Styrene-acrylonitrile (SAN), Others (Latex, Coatings, etc.))
Research Methodology
Primary Research- 100 Interviews of Stakeholders
Secondary Research
Desk Research
Regional scope
North America (United States, Canada, Mexico)
Latin America (Brazil, Argentina, Columbia)
East Asia And Pacific (China, Japan, South Korea, Australia, Cambodia, Fiji, Indonesia)
Sea And South Asia (India, Singapore, Thailand, Taiwan, Malaysia)
Eastern Europe (Poland, Russia, Czech Republic, Romania)
Western Europe (Germany, U.K., France, Spain, Itlay)
Middle East & Africa (GCC Countries, Egypt, Nigeria, South Africa, Israel)
Competitive Landscape
SABIC, LG Chemical, INEOS, Shell plc, Lyondell Basell, Styrenix Performance Materials Ltd (SPM), KR Chemicals, Styrolution, Qingdao Haiwan Group Co. Ltd, Denka Company Limited, The Kuwait Styrene Company, Chevron Phillips Chemical Company LLC, KH Chemicals, Equate Petrochemical Company, LOTTE Chemical CORPORATION, Repsol, Westlake Corporation, Hanwha TotalEnergies Petrochemical Co Ltd, Americas Styrenics LLC
Customization Scope
Customization for segments, region/country-level will be provided. Moreover, additional customization can be done based on the requirements.
Pricing and Purchase Options
Avail customized purchase options to meet your exact research needs. We have three licenses to opt for: Single User License, Multi-User License (Up to 5 Users), Corporate Use License (Unlimited User and Printable PDF).
TABLE OF CONTENTS
1. EXECUTIVE SUMMARY
1.1. MARKET SNAPSHOT
1.2. KEY FINDINGS & INSIGHTS
1.3. ANALYST RECOMMENDATIONS
1.4. FUTURE OUTLOOK
2. RESEARCH METHODOLOGY
2.1. MARKET DEFINITION & SCOPE
2.2. RESEARCH OBJECTIVES: PRIMARY & SECONDARY DATA SOURCES
2.3. DATA COLLECTION SOURCES
2.3.1. COVERAGE OF 100+ PRIMARY RESEARCH/CONSULTATION CALLS WITH INDUSTRY STAKEHOLDERS
FIGURE 17 NORTH AMERICA STYRENE MONOMER CURRENT AND FUTURE TYPE ANALYSIS, 2025–2034, (USD MILLION)
FIGURE 18 NORTH AMERICA STYRENE MONOMER CURRENT AND FUTURE END USER ANALYSIS, 2025–2034, (USD MILLION)
FIGURE 19 MARKET SHARE BY COUNTRY
FIGURE 20 LATIN AMERICA STYRENE MONOMER CURRENT AND FUTURE TYPE ANALYSIS, 2025–2034, (USD MILLION)
FIGURE 21 LATIN AMERICA STYRENE MONOMER CURRENT AND FUTURE END USER ANALYSIS, 2025–2034, (USD MILLION)
FIGURE 22 MARKET SHARE BY COUNTRY
FIGURE 23 EASTERN EUROPE STYRENE MONOMER CURRENT AND FUTURE TYPE ANALYSIS, 2025–2034, (USD MILLION)
FIGURE 24 EASTERN EUROPE STYRENE MONOMER CURRENT AND FUTURE END USER ANALYSIS, 2025–2034, (USD MILLION)
FIGURE 25 MARKET SHARE BY COUNTRY
FIGURE 26 WESTERN EUROPE STYRENE MONOMER CURRENT AND FUTURE TYPE ANALYSIS, 2025–2034, (USD MILLION)
FIGURE 27 WESTERN EUROPE STYRENE MONOMER CURRENT AND FUTURE END USER ANALYSIS, 2025–2034, (USD MILLION)
FIGURE 28 MARKET SHARE BY COUNTRY
FIGURE 29 EAST ASIA AND PACIFIC STYRENE MONOMER CURRENT AND FUTURE TYPE ANALYSIS, 2025–2034, (USD MILLION)
FIGURE 30 EAST ASIA AND PACIFIC STYRENE MONOMER CURRENT AND FUTURE END USER ANALYSIS, 2025–2034, (USD MILLION)
FIGURE 31 MARKET SHARE BY COUNTRY
FIGURE 32 SEA AND SOUTH ASIA STYRENE MONOMER CURRENT AND FUTURE TYPE ANALYSIS, 2025–2034, (USD MILLION)
FIGURE 33 SEA AND SOUTH ASIA STYRENE MONOMER CURRENT AND FUTURE END USER ANALYSIS, 2025–2034, (USD MILLION)
FIGURE 34 MARKET SHARE BY COUNTRY
FIGURE 35 MIDDLE EAST AND AFRICA STYRENE MONOMER CURRENT AND FUTURE TYPE ANALYSIS, 2025–2034, (USD MILLION)
FIGURE 36 MIDDLE EAST AND AFRICA STYRENE MONOMER CURRENT AND FUTURE END USER ANALYSIS, 2025–2034, (USD MILLION)
FIGURE 37 NORTH AMERICA STYRENE MONOMER CURRENT AND FUTURE MARKET VOLUME SHARE REGIONAL ANALYSIS, 2025–2034, (USD MILLION)
FIGURE 38 U.S. STYRENE MONOMER CURRENT AND FUTURE TYPE ANALYSIS, 2025–2034, (USD MILLION)
FIGURE 39 U.S. STYRENE MONOMER CURRENT AND FUTURE END USER ANALYSIS, 2025–2034, (USD MILLION)
FIGURE 40 CANADA STYRENE MONOMER CURRENT AND FUTURE TYPE ANALYSIS, 2025–2034, (USD MILLION)
FIGURE 41 CANADA STYRENE MONOMER CURRENT AND FUTURE END USER ANALYSIS, 2025–2034, (USD MILLION)
FIGURE 42 LATIN AMERICA STYRENE MONOMER CURRENT AND FUTURE MARKET VOLUME SHARE REGIONAL ANALYSIS, 2025–2034, (USD MILLION)
FIGURE 43 MEXICO STYRENE MONOMER CURRENT AND FUTURE TYPE ANALYSIS, 2025–2034, (USD MILLION)
FIGURE 44 MEXICO STYRENE MONOMER CURRENT AND FUTURE END USER ANALYSIS, 2025–2034, (USD MILLION)
FIGURE 45 BRAZIL STYRENE MONOMER CURRENT AND FUTURE TYPE ANALYSIS, 2025–2034, (USD MILLION)
FIGURE 46 BRAZIL STYRENE MONOMER CURRENT AND FUTURE END USER ANALYSIS, 2025–2034, (USD MILLION)
FIGURE 47 ARGENTINA STYRENE MONOMER CURRENT AND FUTURE TYPE ANALYSIS, 2025–2034, (USD MILLION)
FIGURE 48 ARGENTINA STYRENE MONOMER CURRENT AND FUTURE END USER ANALYSIS, 2025–2034, (USD MILLION)
FIGURE 49 COLUMBIA STYRENE MONOMER CURRENT AND FUTURE TYPE ANALYSIS, 2025–2034, (USD MILLION)
FIGURE 50 COLUMBIA STYRENE MONOMER CURRENT AND FUTURE END USER ANALYSIS, 2025–2034, (USD MILLION)
FIGURE 51 REST OF LATIN AMERICA STYRENE MONOMER CURRENT AND FUTURE TYPE ANALYSIS, 2025–2034, (USD MILLION)
FIGURE 52 REST OF LATIN AMERICA STYRENE MONOMER CURRENT AND FUTURE END USER ANALYSIS, 2025–2034, (USD MILLION)
FIGURE 53 EASTERN EUROPE STYRENE MONOMER CURRENT AND FUTURE MARKET VOLUME SHARE REGIONAL ANALYSIS, 2025–2034, (USD MILLION)
FIGURE 54 POLAND STYRENE MONOMER CURRENT AND FUTURE TYPE ANALYSIS, 2025–2034, (USD MILLION)
FIGURE 55 POLAND STYRENE MONOMER CURRENT AND FUTURE END USER ANALYSIS, 2025–2034, (USD MILLION)
FIGURE 56 RUSSIA STYRENE MONOMER CURRENT AND FUTURE TYPE ANALYSIS, 2025–2034, (USD MILLION)
FIGURE 57 RUSSIA STYRENE MONOMER CURRENT AND FUTURE END USER ANALYSIS, 2025–2034, (USD MILLION)
FIGURE 58 CZECH REPUBLIC STYRENE MONOMER CURRENT AND FUTURE TYPE ANALYSIS, 2025–2034, (USD MILLION)
FIGURE 59 CZECH REPUBLIC STYRENE MONOMER CURRENT AND FUTURE END USER ANALYSIS, 2025–2034, (USD MILLION)
FIGURE 60 ROMANIA STYRENE MONOMER CURRENT AND FUTURE TYPE ANALYSIS, 2025–2034, (USD MILLION)
FIGURE 61 ROMANIA STYRENE MONOMER CURRENT AND FUTURE END USER ANALYSIS, 2025–2034, (USD MILLION)
FIGURE 62 REST OF EASTERN EUROPE STYRENE MONOMER CURRENT AND FUTURE TYPE ANALYSIS, 2025–2034, (USD MILLION)
FIGURE 63 REST OF EASTERN EUROPE STYRENE MONOMER CURRENT AND FUTURE END USER ANALYSIS, 2025–2034, (USD MILLION)
FIGURE 64 WESTERN EUROPE STYRENE MONOMER CURRENT AND FUTURE MARKET VOLUME SHARE REGIONAL ANALYSIS, 2025–2034, (USD MILLION)
FIGURE 65 GERMANY STYRENE MONOMER CURRENT AND FUTURE TYPE ANALYSIS, 2025–2034, (USD MILLION)
FIGURE 66 GERMANY STYRENE MONOMER CURRENT AND FUTURE END USER ANALYSIS, 2025–2034, (USD MILLION)
FIGURE 67 FRANCE STYRENE MONOMER CURRENT AND FUTURE TYPE ANALYSIS, 2025–2034, (USD MILLION)
FIGURE 68 FRANCE STYRENE MONOMER CURRENT AND FUTURE END USER ANALYSIS, 2025–2034, (USD MILLION)
FIGURE 69 UK STYRENE MONOMER CURRENT AND FUTURE TYPE ANALYSIS, 2025–2034, (USD MILLION)
FIGURE 70 UK STYRENE MONOMER CURRENT AND FUTURE END USER ANALYSIS, 2025–2034, (USD MILLION)
FIGURE 71 SPAIN STYRENE MONOMER CURRENT AND FUTURE TYPE ANALYSIS, 2025–2034, (USD MILLION)
FIGURE 72 SPAIN STYRENE MONOMER CURRENT AND FUTURE END USER ANALYSIS, 2025–2034, (USD MILLION)
FIGURE 73 ITALY STYRENE MONOMER CURRENT AND FUTURE TYPE ANALYSIS, 2025–2034, (USD MILLION)
FIGURE 74 ITALY STYRENE MONOMER CURRENT AND FUTURE END USER ANALYSIS, 2025–2034, (USD MILLION)
FIGURE 75 REST OF WESTERN EUROPE STYRENE MONOMER CURRENT AND FUTURE TYPE ANALYSIS, 2025–2034, (USD MILLION)
FIGURE 76 REST OF WESTERN EUROPE STYRENE MONOMER CURRENT AND FUTURE END USER ANALYSIS, 2025–2034, (USD MILLION)
FIGURE 77 EAST ASIA AND PACIFIC STYRENE MONOMER CURRENT AND FUTURE MARKET VOLUME SHARE REGIONAL ANALYSIS, 2025–2034, (USD MILLION)
FIGURE 78 CHINA STYRENE MONOMER CURRENT AND FUTURE TYPE ANALYSIS, 2025–2034, (USD MILLION)
FIGURE 79 CHINA STYRENE MONOMER CURRENT AND FUTURE END USER ANALYSIS, 2025–2034, (USD MILLION)
FIGURE 80 JAPAN STYRENE MONOMER CURRENT AND FUTURE TYPE ANALYSIS, 2025–2034, (USD MILLION)
FIGURE 81 JAPAN STYRENE MONOMER CURRENT AND FUTURE END USER ANALYSIS, 2025–2034, (USD MILLION)
FIGURE 82 AUSTRALIA STYRENE MONOMER CURRENT AND FUTURE TYPE ANALYSIS, 2025–2034, (USD MILLION)
FIGURE 83 AUSTRALIA STYRENE MONOMER CURRENT AND FUTURE END USER ANALYSIS, 2025–2034, (USD MILLION)
FIGURE 84 CAMBODIA STYRENE MONOMER CURRENT AND FUTURE TYPE ANALYSIS, 2025–2034, (USD MILLION)
FIGURE 85 CAMBODIA STYRENE MONOMER CURRENT AND FUTURE END USER ANALYSIS, 2025–2034, (USD MILLION)
FIGURE 86 FIJI STYRENE MONOMER CURRENT AND FUTURE TYPE ANALYSIS, 2025–2034, (USD MILLION)
FIGURE 87 FIJI STYRENE MONOMER CURRENT AND FUTURE END USER ANALYSIS, 2025–2034, (USD MILLION)
FIGURE 88 INDONESIA STYRENE MONOMER CURRENT AND FUTURE TYPE ANALYSIS, 2025–2034, (USD MILLION)
FIGURE 89 INDONESIA STYRENE MONOMER CURRENT AND FUTURE END USER ANALYSIS, 2025–2034, (USD MILLION)
FIGURE 90 SOUTH KOREA STYRENE MONOMER CURRENT AND FUTURE TYPE ANALYSIS, 2025–2034, (USD MILLION)
FIGURE 91 SOUTH KOREA STYRENE MONOMER CURRENT AND FUTURE END USER ANALYSIS, 2025–2034, (USD MILLION)
FIGURE 92 REST OF EAST ASIA AND PACIFIC STYRENE MONOMER CURRENT AND FUTURE TYPE ANALYSIS, 2025–2034, (USD MILLION)
FIGURE 93 REST OF EAST ASIA AND PACIFIC STYRENE MONOMER CURRENT AND FUTURE END USER ANALYSIS, 2025–2034, (USD MILLION)
FIGURE 94 SEA AND SOUTH ASIA STYRENE MONOMER CURRENT AND FUTURE MARKET VOLUME SHARE REGIONAL ANALYSIS, 2025–2034, (USD MILLION)
FIGURE 95 BANGLADESH STYRENE MONOMER CURRENT AND FUTURE TYPE ANALYSIS, 2025–2034, (USD MILLION)
FIGURE 96 BANGLADESH STYRENE MONOMER CURRENT AND FUTURE END USER ANALYSIS, 2025–2034, (USD MILLION)
FIGURE 97 NEW ZEALAND STYRENE MONOMER CURRENT AND FUTURE TYPE ANALYSIS, 2025–2034, (USD MILLION)
FIGURE 98 NEW ZEALAND STYRENE MONOMER CURRENT AND FUTURE END USER ANALYSIS, 2025–2034, (USD MILLION)
FIGURE 99 INDIA STYRENE MONOMER CURRENT AND FUTURE TYPE ANALYSIS, 2025–2034, (USD MILLION)
FIGURE 100 INDIA STYRENE MONOMER CURRENT AND FUTURE END USER ANALYSIS, 2025–2034, (USD MILLION)
FIGURE 101 SINGAPORE STYRENE MONOMER CURRENT AND FUTURE TYPE ANALYSIS, 2025–2034, (USD MILLION)
FIGURE 102 SINGAPORE STYRENE MONOMER CURRENT AND FUTURE END USER ANALYSIS, 2025–2034, (USD MILLION)
FIGURE 103 THAILAND STYRENE MONOMER CURRENT AND FUTURE TYPE ANALYSIS, 2025–2034, (USD MILLION)
FIGURE 104 THAILAND STYRENE MONOMER CURRENT AND FUTURE END USER ANALYSIS, 2025–2034, (USD MILLION)
FIGURE 105 TAIWAN STYRENE MONOMER CURRENT AND FUTURE TYPE ANALYSIS, 2025–2034, (USD MILLION)
FIGURE 106 TAIWAN STYRENE MONOMER CURRENT AND FUTURE END USER ANALYSIS, 2025–2034, (USD MILLION)
FIGURE 107 MALAYSIA STYRENE MONOMER CURRENT AND FUTURE TYPE ANALYSIS, 2025–2034, (USD MILLION)
FIGURE 108 MALAYSIA STYRENE MONOMER CURRENT AND FUTURE END USER ANALYSIS, 2025–2034, (USD MILLION)
FIGURE 109 REST OF SEA AND SOUTH ASIA STYRENE MONOMER CURRENT AND FUTURE TYPE ANALYSIS, 2025–2034, (USD MILLION)
FIGURE 110 REST OF SEA AND SOUTH ASIA STYRENE MONOMER CURRENT AND FUTURE END USER ANALYSIS, 2025–2034, (USD MILLION)
FIGURE 111 MIDDLE EAST AND AFRICA STYRENE MONOMER CURRENT AND FUTURE MARKET VOLUME SHARE REGIONAL ANALYSIS, 2025–2034, (USD MILLION)
FIGURE 112 GCC COUNTRIES STYRENE MONOMER CURRENT AND FUTURE TYPE ANALYSIS, 2025–2034, (USD MILLION)
FIGURE 113 GCC COUNTRIES STYRENE MONOMER CURRENT AND FUTURE END USER ANALYSIS, 2025–2034, (USD MILLION)
FIGURE 114 SAUDI ARABIA STYRENE MONOMER CURRENT AND FUTURE TYPE ANALYSIS, 2025–2034, (USD MILLION)
FIGURE 115 SAUDI ARABIA STYRENE MONOMER CURRENT AND FUTURE END USER ANALYSIS, 2025–2034, (USD MILLION)
FIGURE 116 UAE STYRENE MONOMER CURRENT AND FUTURE TYPE ANALYSIS, 2025–2034, (USD MILLION)
FIGURE 117 UAE STYRENE MONOMER CURRENT AND FUTURE END USER ANALYSIS, 2025–2034, (USD MILLION)
FIGURE 118 BAHRAIN STYRENE MONOMER CURRENT AND FUTURE TYPE ANALYSIS, 2025–2034, (USD MILLION)
FIGURE 119 BAHRAIN STYRENE MONOMER CURRENT AND FUTURE END USER ANALYSIS, 2025–2034, (USD MILLION)
FIGURE 120 KUWAIT STYRENE MONOMER CURRENT AND FUTURE TYPE ANALYSIS, 2025–2034, (USD MILLION)
FIGURE 121 KUWAIT STYRENE MONOMER CURRENT AND FUTURE END USER ANALYSIS, 2025–2034, (USD MILLION)
FIGURE 122 OMAN STYRENE MONOMER CURRENT AND FUTURE TYPE ANALYSIS, 2025–2034, (USD MILLION)
FIGURE 123 OMAN STYRENE MONOMER CURRENT AND FUTURE END USER ANALYSIS, 2025–2034, (USD MILLION)
FIGURE 124 QATAR STYRENE MONOMER CURRENT AND FUTURE TYPE ANALYSIS, 2025–2034, (USD MILLION)
FIGURE 125 QATAR STYRENE MONOMER CURRENT AND FUTURE END USER ANALYSIS, 2025–2034, (USD MILLION)
FIGURE 126 EGYPT STYRENE MONOMER CURRENT AND FUTURE TYPE ANALYSIS, 2025–2034, (USD MILLION)
FIGURE 127 EGYPT STYRENE MONOMER CURRENT AND FUTURE END USER ANALYSIS, 2025–2034, (USD MILLION)
FIGURE 128 NIGERIA STYRENE MONOMER CURRENT AND FUTURE TYPE ANALYSIS, 2025–2034, (USD MILLION)
FIGURE 129 NIGERIA STYRENE MONOMER CURRENT AND FUTURE END USER ANALYSIS, 2025–2034, (USD MILLION)
FIGURE 130 SOUTH AFRICA STYRENE MONOMER CURRENT AND FUTURE TYPE ANALYSIS, 2025–2034, (USD MILLION)
FIGURE 131 SOUTH AFRICA STYRENE MONOMER CURRENT AND FUTURE END USER ANALYSIS, 2025–2034, (USD MILLION)
FIGURE 132 ISRAEL STYRENE MONOMER CURRENT AND FUTURE TYPE ANALYSIS, 2025–2034, (USD MILLION)
FIGURE 133 ISRAEL STYRENE MONOMER CURRENT AND FUTURE END USER ANALYSIS, 2025–2034, (USD MILLION)
FIGURE 134 REST OF MEA STYRENE MONOMER CURRENT AND FUTURE TYPE ANALYSIS, 2025–2034, (USD MILLION)
FIGURE 135 REST OF MEA STYRENE MONOMER CURRENT AND FUTURE END USER ANALYSIS, 2025–2034, (USD MILLION)
FIGURE 136 U. S. MARKET SHARE ANALYSIS BY TYPE (2024)
FIGURE 137 U. S. MARKET SHARE ANALYSIS BY END USER (2024)
FIGURE 138 CANADA MARKET SHARE ANALYSIS BY TYPE (2024)
FIGURE 139 CANADA MARKET SHARE ANALYSIS BY END USER (2024)
FIGURE 140 MEXICO MARKET SHARE ANALYSIS BY TYPE (2024)
FIGURE 141 MEXICO MARKET SHARE ANALYSIS BY END USER (2024)
FIGURE 142 CHINA MARKET SHARE ANALYSIS BY TYPE (2024)
FIGURE 143 CHINA MARKET SHARE ANALYSIS BY END USER (2024)
FIGURE 144 JAPAN MARKET SHARE ANALYSIS BY TYPE (2024)
FIGURE 145 JAPAN MARKET SHARE ANALYSIS BY END USER (2024)
FIGURE 146 INDIA MARKET SHARE ANALYSIS BY TYPE (2024)
FIGURE 147 INDIA MARKET SHARE ANALYSIS BY END USER (2024)
FIGURE 148 SOUTH KOREA MARKET SHARE ANALYSIS BY TYPE (2024)
FIGURE 149 SOUTH KOREA MARKET SHARE ANALYSIS BY END USER (2024)
FIGURE 150 SAUDI ARABIA MARKET SHARE ANALYSIS BY TYPE (2024)
FIGURE 151 SAUDI ARABIA MARKET SHARE ANALYSIS BY END USER (2024)
FIGURE 152 UAE MARKET SHARE ANALYSIS BY TYPE (2024)
FIGURE 153 UAE MARKET SHARE ANALYSIS BY END USER (2024)
FIGURE 154 EGYPT MARKET SHARE ANALYSIS BY TYPE (2024)
FIGURE 155 EGYPT MARKET SHARE ANALYSIS BY END USER (2024)
FIGURE 156 NIGERIA MARKET SHARE ANALYSIS BY TYPE (2024)
FIGURE 157 NIGERIA MARKET SHARE ANALYSIS BY END USER (2024)
FIGURE 158 SOUTH AFRICA MARKET SHARE ANALYSIS BY TYPE (2024)
FIGURE 159 SOUTH AFRICA MARKET SHARE ANALYSIS BY END USER (2024)
FIGURE 160 GERMANY MARKET SHARE ANALYSIS BY TYPE (2024)
FIGURE 161 GERMANY MARKET SHARE ANALYSIS BY END USER (2024)
FIGURE 162 FRANCE MARKET SHARE ANALYSIS BY TYPE (2024)
FIGURE 163 FRANCE MARKET SHARE ANALYSIS BY END USER (2024)
FIGURE 164 UK MARKET SHARE ANALYSIS BY TYPE (2024)
FIGURE 165 UK MARKET SHARE ANALYSIS BY END USER (2024)
FIGURE 166 SPAIN MARKET SHARE ANALYSIS BY TYPE (2024)
FIGURE 167 SPAIN MARKET SHARE ANALYSIS BY END USER (2024)
FIGURE 168 ITALY MARKET SHARE ANALYSIS BY TYPE (2024)
FIGURE 169 ITALY MARKET SHARE ANALYSIS BY END USER (2024)
FIGURE 170 BRAZIL MARKET SHARE ANALYSIS BY TYPE (2024)
FIGURE 171 BRAZIL MARKET SHARE ANALYSIS BY END USER (2024)
FIGURE 172 ARGENTINA MARKET SHARE ANALYSIS BY TYPE (2024)
FIGURE 173 ARGENTINA MARKET SHARE ANALYSIS BY END USER (2024)
FIGURE 174 COLUMBIA MARKET SHARE ANALYSIS BY TYPE (2024)
FIGURE 175 COLUMBIA MARKET SHARE ANALYSIS BY END USER (2024)
FIGURE 176 GLOBAL STYRENE MONOMER CURRENT AND FUTURE MARKET KEY COUNTRY LEVEL ANALYSIS, 2024–2034, (USD MILLION)
FIGURE 177 FINANCIAL OVERVIEW:
Key Players Analysis:
SABIC: SABIC is one of the leading global producers of styrene monomer, with a robust footprint across the petrochemical value chain. Leveraging its vertically integrated operations and access to low-cost feedstock in the Middle East, SABIC ensures competitive pricing and large-scale output. The company focuses on sustainability through innovations in circular polymers and advanced recycling, positioning itself strongly amidst tightening environmental regulations. Its consistent investments in capacity expansion and technology upgrades have solidified its role as a key supplier in both mature and emerging styrene markets.
LG Chem (LG Chemical): LG Chem is a dominant player in the styrene monomer sector, particularly in Asia, where it operates large-scale petrochemical complexes. With integrated production capabilities that span from raw materials to high-value styrene derivatives like ABS, the company benefits from cost synergies and strong supply chain control. LG Chem’s focus on advanced materials and sustainable product lines ensures resilience amid shifting regulatory landscapes. Its strong R&D and strategic expansions in China and Southeast Asia have enhanced its global competitiveness in the styrene market.
INEOS Styrolution: INEOS Styrolution is a global leader dedicated exclusively to styrenics, making it one of the top players in the styrene monomer market. Operating multiple world-scale plants across Europe, Asia, and the Americas, the company maintains a robust production and distribution network. Its specialization in styrene-based materials enables it to deliver tailored solutions across automotive, electronics, and packaging sectors. INEOS Styrolution also pioneers sustainable initiatives, including chemical recycling and bio-attributed styrene, aligning with growing environmental demands while maintaining technical performance.
Shell plc: Shell is a major styrene monomer producer through its integrated petrochemical operations, leveraging its global refining infrastructure. Its strong presence in North America and Europe ensures reliable supply to key industrial hubs. Shell focuses on improving energy efficiency in its styrene production and actively invests in research to develop sustainable alternatives. With deep capital resources and a diversified product base, Shell combines financial strength and technological expertise to retain its leadership in the global styrene market.
LyondellBasell: LyondellBasell is a significant player in the global styrene market, supported by its expansive petrochemical operations and advanced process technologies. The company operates state-of-the-art production facilities with high operational efficiency and scale. Its portfolio includes a broad range of styrene applications from packaging to construction materials. LyondellBasell’s strategic alliances and efforts toward circular plastics and carbon footprint reduction enhance its competitive edge. As global demand for high-performance plastics grows, the company remains a reliable and innovative styrene supplier.
Market Key Players
SABIC
LG Chemical
INEOS
Shell plc
Lyondell Basell
Styrenix Performance Materials Ltd (SPM)
KR Chemicals
Styrolution
Qingdao Haiwan Group Co.,Ltd
Denka Company Limited
The Kuwait Styrene Company
Chevron Phillips Chemical Company LLC
KH Chemicals
Equate Petrochemical Company
LOTTE Chemical CORPORATION
Repsol
Westlake Corporation
Hanwha TotalEnergies Petrochemical Co Ltd
Americas Styrenics LLC
Driver:
Demand from Key End-Use Sectors
The styrene monomer market is largely propelled by its extensive use in packaging, construction, and automotive industries. Polystyrene, a major derivative of styrene, is widely utilized in food packaging, insulation, and consumer goods due to its low cost, durability, and ease of molding. In construction, styrene-based materials offer excellent thermal insulation, making them ideal for modern building requirements. The automotive sector also significantly relies on acrylonitrile butadiene styrene (ABS) for manufacturing interior and exterior components. This broad demand across industries forms the backbone of the market’s consistent growth and global relevance.
Growth in Emerging Economies and Technological Advancements
Emerging economies such as India, China, and countries in Southeast Asia are experiencing rapid industrialization and urbanization, driving demand for styrene in infrastructure and consumer goods. Rising disposable incomes are pushing up consumption of electronics and packaged products, indirectly boosting styrene usage. Additionally, advancements in production and polymerization technologies are enabling manufacturers to increase output with reduced energy usage and lower environmental impact. These innovations help producers remain competitive and meet global supply demands effectively, thus reinforcing the market's expansion.
Restrain:
Health Hazards and Environmental Regulations
Styrene monomer poses significant health risks, including being classified as a possible human carcinogen, prompting concerns over exposure through inhalation or prolonged contact. Environmental authorities such as the EPA (Environmental Protection Agency) and REACH (Registration, Evaluation, Authorisation and Restriction of Chemicals) have imposed strict limits on its handling and emissions. These regulations increase operational burdens and require continuous monitoring, advanced safety equipment, and employee training. As environmental scrutiny intensifies, compliance becomes more costly and complex for producers, acting as a substantial market restraint.
Raw Material Volatility and Shift Toward Alternatives
Styrene is produced using benzene and ethylene, both of which are petroleum-derived and subject to volatile pricing based on crude oil markets. These fluctuations directly impact production costs and margins, making long-term planning difficult. Additionally, consumer resistance to plastic products is rising due to growing awareness of environmental issues, pushing companies toward biodegradable or recyclable alternatives. This shift, though gradual, is prompting industries to reduce their reliance on styrene-based products, which could threaten long-term market demand.
Opportunities:
Electric Vehicles and Construction Growth in Developing Nations
The expanding electric vehicle (EV) market provides strong growth potential for styrene monomer, especially in the production of lightweight, high-performance ABS components. EV manufacturers prioritize materials that reduce vehicle weight and enhance energy efficiency, making ABS an ideal solution. Simultaneously, rapid urbanization in regions like Asia-Pacific and Africa is driving the demand for construction materials, including insulation and piping made from styrene derivatives. As infrastructure projects and residential developments rise, so does the need for versatile and cost-effective plastic components.
Focus on Circular Economy and Sustainable Product Development
The global push for sustainability has led to increased investment in circular economy practices such as recycling polystyrene and developing renewable alternatives to styrene. Companies are focusing on chemical recycling technologies that allow reuse of styrene-based plastics without degrading their quality. Additionally, R&D into bio-based monomers is gaining momentum, driven by both regulatory pressure and evolving consumer preferences. This shift opens new product segments and market potential for eco-friendly styrene variants, positioning companies that innovate in this space as future market leaders.
Trends:
Green Technologies and Chemical Recycling Innovations
As environmental awareness rises, chemical recycling technologies are gaining momentum, especially for polystyrene waste. Unlike mechanical recycling, chemical recycling breaks down plastic into its monomers, allowing high-quality reuse. This trend supports closed-loop systems that minimize landfill waste and maximize resource efficiency. Governments and private players are investing in such innovations to align with zero-waste targets. These developments are encouraging producers to adopt more sustainable practices while retaining the functionality of styrene-based materials.
Digitalization and Strategic Manufacturing Shifts
Digital tools and AI are increasingly integrated into styrene production processes to improve operational efficiency, reduce energy consumption, and enhance real-time monitoring. Furthermore, production is shifting toward regions with lower labor costs and more lenient environmental regulations, optimizing cost structures. This realignment of manufacturing hubs is redefining global supply chains and encouraging strategic mergers and partnerships to enhance market positioning. Such trends are shaping a more responsive and resilient styrene production ecosystem.
Recent Development:
In March 2025 – AmSty(Americas Styrenics LLC), one of the leading styrene producers in the Americas, announced a significant milestone: the first sales of PolyRenew® certified recycled styrene were recorded in 2024. PolyRenew® is AmSty’s proprietary line of styrene and polystyrene products produced from recycled or sustainable raw materials, verified through ISCC PLUS certification-a globally recognized standard for sustainability and circularity in chemicals and plastics
In February 2024 - Styrenix Performance Materials Ltd (SPM) announced a major investment of ₹6.5 billion (approximately $78 million) to expand its acrylonitrile butadiene styrene (ABS) and polystyrene (PS) production capacities at its Dahej and Nandesari facilities in Gujarat. According to the company’s phased expansion plan, ABS capacity will increase from 85,000 tonnes per year to 210,000 tonnes per year by FY28, while PS capacity will rise from 66,000 tonnes per year to 150,000 tonnes per year within the next three years. The expansion will be funded through a mix of internal accruals and debt, and is aimed at meeting the rising domestic demand from sectors such as automotive, electronics, and household appliances.