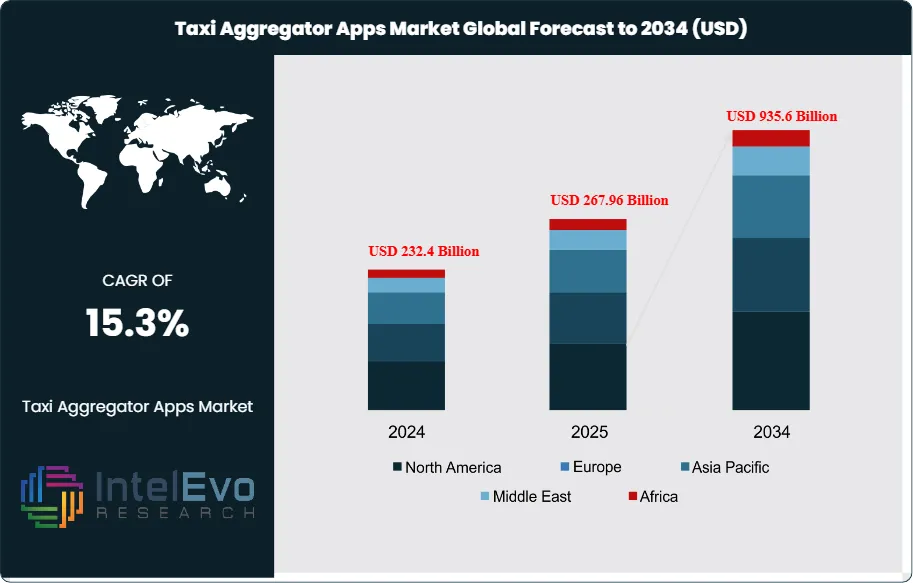
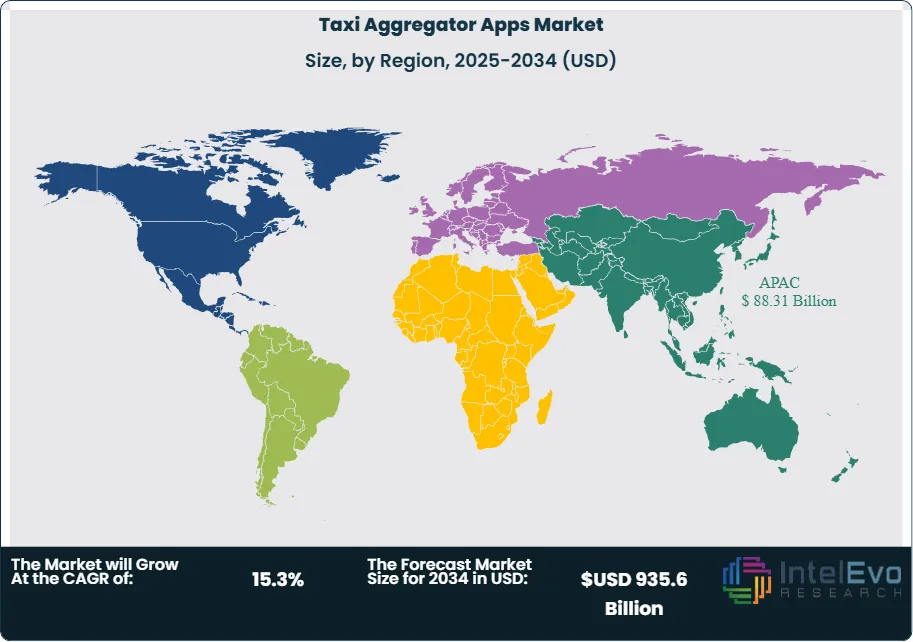
The Taxi Aggregator Apps Market is projected to reach around USD 935.6 Billion by 2034, up from USD 232.4 Billion in 2024, growing at a CAGR of approximately 15.3% during 2025–2034. Rising urbanization, smartphone penetration, and demand for on-demand mobility services continue to drive market expansion. The integration of electric vehicles, AI-powered route optimization, and subscription-based ride models is shaping the next phase of growth. With increasing global travel and digital adoption, taxi aggregator platforms are set to redefine future mobility experiences.
The taxi aggregator apps market encompasses digital platforms that connect passengers with taxi and ride-hailing services through mobile applications. These platforms facilitate on-demand transportation services, enabling users to book rides, track vehicles in real-time, view fare estimates, and process payments electronically. The market includes various service models from traditional taxi booking to ride sharing and premium transportation services, serving both individual consumers and corporate clients across urban and inter-urban routes.
The market is experiencing robust growth driven by increasing smartphone penetration, urbanization trends, and changing consumer preferences toward convenient transportation solutions. Technology integration including AI, GPS tracking, and real-time analytics has significantly enhanced service quality and operational efficiency. The shift from traditional taxi services to app-based platforms has accelerated, particularly following the COVID-19 pandemic which emphasized contactless transactions and digital service adoption.
North America currently dominates the global market share, driven by high smartphone adoption rates and established ride-hailing culture. Asia-Pacific represents the fastest-growing region, with significant expansion in countries like India and China where companies like DiDi and Ola have established strong market presence. Europe shows steady growth with players like Bolt gaining market share, while Latin America presents emerging opportunities with regional leaders like Cabify and Beat expanding their operations.
The pandemic initially caused significant disruptions to the taxi aggregator market, with over 100 million active users lost during 2020 due to travel restrictions and safety concerns. However, the market has shown strong recovery with increased demand for contactless payment options, enhanced safety protocols, and reduced reliance on public transportation. The crisis accelerated digital adoption and reinforced the importance of flexible, on-demand transportation solutions.
Regulatory challenges in various markets have affected international expansion strategies for major players. Trade tensions and data localization requirements have influenced market operations, particularly affecting companies like DiDi in certain jurisdictions. Geopolitical factors continue to shape market access and competitive positioning, with regional preferences often favoring local or regional players over global giants.
Market Growth: The Taxi Aggregator Apps Market is expected to reach USD 935.6 Billion by 2034, driven by rapid smartphone penetration, increasing urbanization, and growing consumer preference for on-demand mobility solutions over traditional taxi services.
Service Type Dominance: Inter-city leads market share due to convenience and door-to-door service advantages.
Platform Technology Dominance: Android dominates market share, owing to device affordability and market reach in emerging economies.
Vehicle Type Dominance: Economy cars leads market share, driven by affordability and fuel efficiency preferences.
Driver: Smartphone penetration & urbanization and technological advancements accelerate growth through enhanced connectivity and improved user experiences with AI-powered optimization.
Restraint: Regulatory challenges & intense competition and high operational costs create barriers through compliance complexities and pricing pressures affecting profitability.
Opportunity: Emerging markets expansion and integration of electric/autonomous vehicles offer growth potential through untapped regions and sustainable transportation solutions.
Trend: AI-powered optimization and sustainable mobility solutions are reshaping the market by enhancing efficiency and addressing environmental concerns.
Regional Analysis: Asia-Pacific leads owing to high urbanization, smartphone penetration, and supportive government policies.
Service Type Analysis:
Inter-city taxi aggregator services maintain commanding market leadership, primarily attributed to their superior convenience and adaptability compared to conventional transportation alternatives. These platforms deliver comprehensive door-to-door transportation solutions that effectively eliminate the operational complexities associated with local transit networks during inter-city travel, providing seamless connectivity between distant urban centers. The economic benefits of inter-city taxi aggregator platforms, especially when incorporating ride-sharing functionalities, position them as financially attractive substitutes to personal vehicle ownership or traditional rental services. Consumers increasingly recognize the cost savings achieved through shared fare structures, elimination of fuel expenses, maintenance costs, and parking fees, while avoiding the substantial capital investment required for vehicle ownership.
Platform Technology Analysis:
Android platforms maintain market dominance through widespread device accessibility and cost-effectiveness, particularly across developing economies where price sensitivity significantly influences consumer purchasing decisions. The open-source architecture of Android enables extensive customization and adaptability, making it exceptionally well-suited for diverse global markets with varying consumer preferences and requirements. This flexibility allows developers and manufacturers to tailor user experiences according to regional needs and cultural preferences. The affordability advantage of Android devices compared to iOS alternatives substantially increases market accessibility and expands the potential user base across economic segments that might otherwise be excluded from smartphone adoption.
Vehicle Type Analysis:
Economy Cars Leads With more than 30% Market Share In Taxi Aggregator Apps Market. Economy Cars maintain their commanding position in the taxi aggregator market by appealing to price-sensitive consumers who prioritize affordable transportation solutions over premium features. Their compact dimensions provide significant operational advantages, enabling efficient navigation through densely congested urban corridors and making them particularly well-suited for metropolitan environments where maneuverability and parking accessibility are critical factors. The segment's dominance is further reinforced by increasing environmental consciousness among consumers, which drives preference for fuel-efficient vehicles that minimize operational costs and carbon footprints. Many economy car models now offer hybrid or fully electric variants, addressing the growing demand for sustainable transportation options while maintaining cost-effectiveness.
Region Analysis:
Asia-Pacific Leads With over 38% Market Share In Taxi Aggregator Apps Market. Asia-Pacific has established commanding leadership in the global taxi aggregator market through a convergence of favorable demographic, technological, and regulatory factors. The region's dominance stems from exceptional population density, rapid urbanization, and robust smartphone adoption across key economies including China, India, and Southeast Asia. Major regional players have driven significant innovation and competitive pricing while benefiting from supportive government policies promoting digital transformation and smart city initiatives. The presence of tech-savvy consumer bases with high mobile application comfort levels creates ideal conditions for platform adoption and feature development. North America and Europe represent mature secondary markets with established infrastructure, while Latin America and Africa offer emerging growth opportunities through increasing smartphone penetration and urbanization trends driving demand for convenient digital transportation solutions.
Customization for segments, region/country-level will be provided. Moreover, additional customization can be done based on the requirements.
Pricing and Purchase Options
Avail customized purchase options to meet your exact research needs. We have three licenses to opt for: Single User License, Multi-User License (Up to 5 Users), Corporate Use License (Unlimited User and Printable PDF).
TABLE OF CONTENTS
1. EXECUTIVE SUMMARY
1.1. MARKET SNAPSHOT
1.2. KEY FINDINGS & INSIGHTS
1.3. ANALYST RECOMMENDATIONS
1.4. FUTURE OUTLOOK
2. RESEARCH METHODOLOGY
2.1. MARKET DEFINITION & SCOPE
2.2. RESEARCH OBJECTIVES: PRIMARY & SECONDARY DATA SOURCES
2.3. DATA COLLECTION SOURCES
2.3.1. COVERAGE OF 100+ PRIMARY RESEARCH/CONSULTATION CALLS WITH INDUSTRY STAKEHOLDERS
FIGURE 17 NORTH AMERICA TAXI AGGREGATOR APPS CURRENT AND FUTURE TYPE ANALYSIS, 2025–2034, (USD MILLION)
FIGURE 18 NORTH AMERICA TAXI AGGREGATOR APPS CURRENT AND FUTURE END USER ANALYSIS, 2025–2034, (USD MILLION)
FIGURE 19 MARKET SHARE BY COUNTRY
FIGURE 20 LATIN AMERICA TAXI AGGREGATOR APPS CURRENT AND FUTURE TYPE ANALYSIS, 2025–2034, (USD MILLION)
FIGURE 21 LATIN AMERICA TAXI AGGREGATOR APPS CURRENT AND FUTURE END USER ANALYSIS, 2025–2034, (USD MILLION)
FIGURE 22 MARKET SHARE BY COUNTRY
FIGURE 23 EASTERN EUROPE TAXI AGGREGATOR APPS CURRENT AND FUTURE TYPE ANALYSIS, 2025–2034, (USD MILLION)
FIGURE 24 EASTERN EUROPE TAXI AGGREGATOR APPS CURRENT AND FUTURE END USER ANALYSIS, 2025–2034, (USD MILLION)
FIGURE 25 MARKET SHARE BY COUNTRY
FIGURE 26 WESTERN EUROPE TAXI AGGREGATOR APPS CURRENT AND FUTURE TYPE ANALYSIS, 2025–2034, (USD MILLION)
FIGURE 27 WESTERN EUROPE TAXI AGGREGATOR APPS CURRENT AND FUTURE END USER ANALYSIS, 2025–2034, (USD MILLION)
FIGURE 28 MARKET SHARE BY COUNTRY
FIGURE 29 EAST ASIA AND PACIFIC TAXI AGGREGATOR APPS CURRENT AND FUTURE TYPE ANALYSIS, 2025–2034, (USD MILLION)
FIGURE 30 EAST ASIA AND PACIFIC TAXI AGGREGATOR APPS CURRENT AND FUTURE END USER ANALYSIS, 2025–2034, (USD MILLION)
FIGURE 31 MARKET SHARE BY COUNTRY
FIGURE 32 SEA AND SOUTH ASIA TAXI AGGREGATOR APPS CURRENT AND FUTURE TYPE ANALYSIS, 2025–2034, (USD MILLION)
FIGURE 33 SEA AND SOUTH ASIA TAXI AGGREGATOR APPS CURRENT AND FUTURE END USER ANALYSIS, 2025–2034, (USD MILLION)
FIGURE 34 MARKET SHARE BY COUNTRY
FIGURE 35 MIDDLE EAST AND AFRICA TAXI AGGREGATOR APPS CURRENT AND FUTURE TYPE ANALYSIS, 2025–2034, (USD MILLION)
FIGURE 36 MIDDLE EAST AND AFRICA TAXI AGGREGATOR APPS CURRENT AND FUTURE END USER ANALYSIS, 2025–2034, (USD MILLION)
FIGURE 37 NORTH AMERICA TAXI AGGREGATOR APPS CURRENT AND FUTURE MARKET VOLUME SHARE REGIONAL ANALYSIS, 2025–2034, (USD MILLION)
FIGURE 38 U.S. TAXI AGGREGATOR APPS CURRENT AND FUTURE TYPE ANALYSIS, 2025–2034, (USD MILLION)
FIGURE 39 U.S. TAXI AGGREGATOR APPS CURRENT AND FUTURE END USER ANALYSIS, 2025–2034, (USD MILLION)
FIGURE 40 CANADA TAXI AGGREGATOR APPS CURRENT AND FUTURE TYPE ANALYSIS, 2025–2034, (USD MILLION)
FIGURE 41 CANADA TAXI AGGREGATOR APPS CURRENT AND FUTURE END USER ANALYSIS, 2025–2034, (USD MILLION)
FIGURE 42 LATIN AMERICA TAXI AGGREGATOR APPS CURRENT AND FUTURE MARKET VOLUME SHARE REGIONAL ANALYSIS, 2025–2034, (USD MILLION)
FIGURE 43 MEXICO TAXI AGGREGATOR APPS CURRENT AND FUTURE TYPE ANALYSIS, 2025–2034, (USD MILLION)
FIGURE 44 MEXICO TAXI AGGREGATOR APPS CURRENT AND FUTURE END USER ANALYSIS, 2025–2034, (USD MILLION)
FIGURE 45 BRAZIL TAXI AGGREGATOR APPS CURRENT AND FUTURE TYPE ANALYSIS, 2025–2034, (USD MILLION)
FIGURE 46 BRAZIL TAXI AGGREGATOR APPS CURRENT AND FUTURE END USER ANALYSIS, 2025–2034, (USD MILLION)
FIGURE 47 ARGENTINA TAXI AGGREGATOR APPS CURRENT AND FUTURE TYPE ANALYSIS, 2025–2034, (USD MILLION)
FIGURE 48 ARGENTINA TAXI AGGREGATOR APPS CURRENT AND FUTURE END USER ANALYSIS, 2025–2034, (USD MILLION)
FIGURE 49 COLUMBIA TAXI AGGREGATOR APPS CURRENT AND FUTURE TYPE ANALYSIS, 2025–2034, (USD MILLION)
FIGURE 50 COLUMBIA TAXI AGGREGATOR APPS CURRENT AND FUTURE END USER ANALYSIS, 2025–2034, (USD MILLION)
FIGURE 51 REST OF LATIN AMERICA TAXI AGGREGATOR APPS CURRENT AND FUTURE TYPE ANALYSIS, 2025–2034, (USD MILLION)
FIGURE 52 REST OF LATIN AMERICA TAXI AGGREGATOR APPS CURRENT AND FUTURE END USER ANALYSIS, 2025–2034, (USD MILLION)
FIGURE 53 EASTERN EUROPE TAXI AGGREGATOR APPS CURRENT AND FUTURE MARKET VOLUME SHARE REGIONAL ANALYSIS, 2025–2034, (USD MILLION)
FIGURE 54 POLAND TAXI AGGREGATOR APPS CURRENT AND FUTURE TYPE ANALYSIS, 2025–2034, (USD MILLION)
FIGURE 55 POLAND TAXI AGGREGATOR APPS CURRENT AND FUTURE END USER ANALYSIS, 2025–2034, (USD MILLION)
FIGURE 56 RUSSIA TAXI AGGREGATOR APPS CURRENT AND FUTURE TYPE ANALYSIS, 2025–2034, (USD MILLION)
FIGURE 57 RUSSIA TAXI AGGREGATOR APPS CURRENT AND FUTURE END USER ANALYSIS, 2025–2034, (USD MILLION)
FIGURE 58 CZECH REPUBLIC TAXI AGGREGATOR APPS CURRENT AND FUTURE TYPE ANALYSIS, 2025–2034, (USD MILLION)
FIGURE 59 CZECH REPUBLIC TAXI AGGREGATOR APPS CURRENT AND FUTURE END USER ANALYSIS, 2025–2034, (USD MILLION)
FIGURE 60 ROMANIA TAXI AGGREGATOR APPS CURRENT AND FUTURE TYPE ANALYSIS, 2025–2034, (USD MILLION)
FIGURE 61 ROMANIA TAXI AGGREGATOR APPS CURRENT AND FUTURE END USER ANALYSIS, 2025–2034, (USD MILLION)
FIGURE 62 REST OF EASTERN EUROPE TAXI AGGREGATOR APPS CURRENT AND FUTURE TYPE ANALYSIS, 2025–2034, (USD MILLION)
FIGURE 63 REST OF EASTERN EUROPE TAXI AGGREGATOR APPS CURRENT AND FUTURE END USER ANALYSIS, 2025–2034, (USD MILLION)
FIGURE 64 WESTERN EUROPE TAXI AGGREGATOR APPS CURRENT AND FUTURE MARKET VOLUME SHARE REGIONAL ANALYSIS, 2025–2034, (USD MILLION)
FIGURE 65 GERMANY TAXI AGGREGATOR APPS CURRENT AND FUTURE TYPE ANALYSIS, 2025–2034, (USD MILLION)
FIGURE 66 GERMANY TAXI AGGREGATOR APPS CURRENT AND FUTURE END USER ANALYSIS, 2025–2034, (USD MILLION)
FIGURE 67 FRANCE TAXI AGGREGATOR APPS CURRENT AND FUTURE TYPE ANALYSIS, 2025–2034, (USD MILLION)
FIGURE 68 FRANCE TAXI AGGREGATOR APPS CURRENT AND FUTURE END USER ANALYSIS, 2025–2034, (USD MILLION)
FIGURE 69 UK TAXI AGGREGATOR APPS CURRENT AND FUTURE TYPE ANALYSIS, 2025–2034, (USD MILLION)
FIGURE 70 UK TAXI AGGREGATOR APPS CURRENT AND FUTURE END USER ANALYSIS, 2025–2034, (USD MILLION)
FIGURE 71 SPAIN TAXI AGGREGATOR APPS CURRENT AND FUTURE TYPE ANALYSIS, 2025–2034, (USD MILLION)
FIGURE 72 SPAIN TAXI AGGREGATOR APPS CURRENT AND FUTURE END USER ANALYSIS, 2025–2034, (USD MILLION)
FIGURE 73 ITALY TAXI AGGREGATOR APPS CURRENT AND FUTURE TYPE ANALYSIS, 2025–2034, (USD MILLION)
FIGURE 74 ITALY TAXI AGGREGATOR APPS CURRENT AND FUTURE END USER ANALYSIS, 2025–2034, (USD MILLION)
FIGURE 75 REST OF WESTERN EUROPE TAXI AGGREGATOR APPS CURRENT AND FUTURE TYPE ANALYSIS, 2025–2034, (USD MILLION)
FIGURE 76 REST OF WESTERN EUROPE TAXI AGGREGATOR APPS CURRENT AND FUTURE END USER ANALYSIS, 2025–2034, (USD MILLION)
FIGURE 77 EAST ASIA AND PACIFIC TAXI AGGREGATOR APPS CURRENT AND FUTURE MARKET VOLUME SHARE REGIONAL ANALYSIS, 2025–2034, (USD MILLION)
FIGURE 78 CHINA TAXI AGGREGATOR APPS CURRENT AND FUTURE TYPE ANALYSIS, 2025–2034, (USD MILLION)
FIGURE 79 CHINA TAXI AGGREGATOR APPS CURRENT AND FUTURE END USER ANALYSIS, 2025–2034, (USD MILLION)
FIGURE 80 JAPAN TAXI AGGREGATOR APPS CURRENT AND FUTURE TYPE ANALYSIS, 2025–2034, (USD MILLION)
FIGURE 81 JAPAN TAXI AGGREGATOR APPS CURRENT AND FUTURE END USER ANALYSIS, 2025–2034, (USD MILLION)
FIGURE 82 AUSTRALIA TAXI AGGREGATOR APPS CURRENT AND FUTURE TYPE ANALYSIS, 2025–2034, (USD MILLION)
FIGURE 83 AUSTRALIA TAXI AGGREGATOR APPS CURRENT AND FUTURE END USER ANALYSIS, 2025–2034, (USD MILLION)
FIGURE 84 CAMBODIA TAXI AGGREGATOR APPS CURRENT AND FUTURE TYPE ANALYSIS, 2025–2034, (USD MILLION)
FIGURE 85 CAMBODIA TAXI AGGREGATOR APPS CURRENT AND FUTURE END USER ANALYSIS, 2025–2034, (USD MILLION)
FIGURE 86 FIJI TAXI AGGREGATOR APPS CURRENT AND FUTURE TYPE ANALYSIS, 2025–2034, (USD MILLION)
FIGURE 87 FIJI TAXI AGGREGATOR APPS CURRENT AND FUTURE END USER ANALYSIS, 2025–2034, (USD MILLION)
FIGURE 88 INDONESIA TAXI AGGREGATOR APPS CURRENT AND FUTURE TYPE ANALYSIS, 2025–2034, (USD MILLION)
FIGURE 89 INDONESIA TAXI AGGREGATOR APPS CURRENT AND FUTURE END USER ANALYSIS, 2025–2034, (USD MILLION)
FIGURE 90 SOUTH KOREA TAXI AGGREGATOR APPS CURRENT AND FUTURE TYPE ANALYSIS, 2025–2034, (USD MILLION)
FIGURE 91 SOUTH KOREA TAXI AGGREGATOR APPS CURRENT AND FUTURE END USER ANALYSIS, 2025–2034, (USD MILLION)
FIGURE 92 REST OF EAST ASIA AND PACIFIC TAXI AGGREGATOR APPS CURRENT AND FUTURE TYPE ANALYSIS, 2025–2034, (USD MILLION)
FIGURE 93 REST OF EAST ASIA AND PACIFIC TAXI AGGREGATOR APPS CURRENT AND FUTURE END USER ANALYSIS, 2025–2034, (USD MILLION)
FIGURE 94 SEA AND SOUTH ASIA TAXI AGGREGATOR APPS CURRENT AND FUTURE MARKET VOLUME SHARE REGIONAL ANALYSIS, 2025–2034, (USD MILLION)
FIGURE 95 BANGLADESH TAXI AGGREGATOR APPS CURRENT AND FUTURE TYPE ANALYSIS, 2025–2034, (USD MILLION)
FIGURE 96 BANGLADESH TAXI AGGREGATOR APPS CURRENT AND FUTURE END USER ANALYSIS, 2025–2034, (USD MILLION)
FIGURE 97 NEW ZEALAND TAXI AGGREGATOR APPS CURRENT AND FUTURE TYPE ANALYSIS, 2025–2034, (USD MILLION)
FIGURE 98 NEW ZEALAND TAXI AGGREGATOR APPS CURRENT AND FUTURE END USER ANALYSIS, 2025–2034, (USD MILLION)
FIGURE 99 INDIA TAXI AGGREGATOR APPS CURRENT AND FUTURE TYPE ANALYSIS, 2025–2034, (USD MILLION)
FIGURE 100 INDIA TAXI AGGREGATOR APPS CURRENT AND FUTURE END USER ANALYSIS, 2025–2034, (USD MILLION)
FIGURE 101 SINGAPORE TAXI AGGREGATOR APPS CURRENT AND FUTURE TYPE ANALYSIS, 2025–2034, (USD MILLION)
FIGURE 102 SINGAPORE TAXI AGGREGATOR APPS CURRENT AND FUTURE END USER ANALYSIS, 2025–2034, (USD MILLION)
FIGURE 103 THAILAND TAXI AGGREGATOR APPS CURRENT AND FUTURE TYPE ANALYSIS, 2025–2034, (USD MILLION)
FIGURE 104 THAILAND TAXI AGGREGATOR APPS CURRENT AND FUTURE END USER ANALYSIS, 2025–2034, (USD MILLION)
FIGURE 105 TAIWAN TAXI AGGREGATOR APPS CURRENT AND FUTURE TYPE ANALYSIS, 2025–2034, (USD MILLION)
FIGURE 106 TAIWAN TAXI AGGREGATOR APPS CURRENT AND FUTURE END USER ANALYSIS, 2025–2034, (USD MILLION)
FIGURE 107 MALAYSIA TAXI AGGREGATOR APPS CURRENT AND FUTURE TYPE ANALYSIS, 2025–2034, (USD MILLION)
FIGURE 108 MALAYSIA TAXI AGGREGATOR APPS CURRENT AND FUTURE END USER ANALYSIS, 2025–2034, (USD MILLION)
FIGURE 109 REST OF SEA AND SOUTH ASIA TAXI AGGREGATOR APPS CURRENT AND FUTURE TYPE ANALYSIS, 2025–2034, (USD MILLION)
FIGURE 110 REST OF SEA AND SOUTH ASIA TAXI AGGREGATOR APPS CURRENT AND FUTURE END USER ANALYSIS, 2025–2034, (USD MILLION)
FIGURE 111 MIDDLE EAST AND AFRICA TAXI AGGREGATOR APPS CURRENT AND FUTURE MARKET VOLUME SHARE REGIONAL ANALYSIS, 2025–2034, (USD MILLION)
FIGURE 112 GCC COUNTRIES TAXI AGGREGATOR APPS CURRENT AND FUTURE TYPE ANALYSIS, 2025–2034, (USD MILLION)
FIGURE 113 GCC COUNTRIES TAXI AGGREGATOR APPS CURRENT AND FUTURE END USER ANALYSIS, 2025–2034, (USD MILLION)
FIGURE 114 SAUDI ARABIA TAXI AGGREGATOR APPS CURRENT AND FUTURE TYPE ANALYSIS, 2025–2034, (USD MILLION)
FIGURE 115 SAUDI ARABIA TAXI AGGREGATOR APPS CURRENT AND FUTURE END USER ANALYSIS, 2025–2034, (USD MILLION)
FIGURE 116 UAE TAXI AGGREGATOR APPS CURRENT AND FUTURE TYPE ANALYSIS, 2025–2034, (USD MILLION)
FIGURE 117 UAE TAXI AGGREGATOR APPS CURRENT AND FUTURE END USER ANALYSIS, 2025–2034, (USD MILLION)
FIGURE 118 BAHRAIN TAXI AGGREGATOR APPS CURRENT AND FUTURE TYPE ANALYSIS, 2025–2034, (USD MILLION)
FIGURE 119 BAHRAIN TAXI AGGREGATOR APPS CURRENT AND FUTURE END USER ANALYSIS, 2025–2034, (USD MILLION)
FIGURE 120 KUWAIT TAXI AGGREGATOR APPS CURRENT AND FUTURE TYPE ANALYSIS, 2025–2034, (USD MILLION)
FIGURE 121 KUWAIT TAXI AGGREGATOR APPS CURRENT AND FUTURE END USER ANALYSIS, 2025–2034, (USD MILLION)
FIGURE 122 OMAN TAXI AGGREGATOR APPS CURRENT AND FUTURE TYPE ANALYSIS, 2025–2034, (USD MILLION)
FIGURE 123 OMAN TAXI AGGREGATOR APPS CURRENT AND FUTURE END USER ANALYSIS, 2025–2034, (USD MILLION)
FIGURE 124 QATAR TAXI AGGREGATOR APPS CURRENT AND FUTURE TYPE ANALYSIS, 2025–2034, (USD MILLION)
FIGURE 125 QATAR TAXI AGGREGATOR APPS CURRENT AND FUTURE END USER ANALYSIS, 2025–2034, (USD MILLION)
FIGURE 126 EGYPT TAXI AGGREGATOR APPS CURRENT AND FUTURE TYPE ANALYSIS, 2025–2034, (USD MILLION)
FIGURE 127 EGYPT TAXI AGGREGATOR APPS CURRENT AND FUTURE END USER ANALYSIS, 2025–2034, (USD MILLION)
FIGURE 128 NIGERIA TAXI AGGREGATOR APPS CURRENT AND FUTURE TYPE ANALYSIS, 2025–2034, (USD MILLION)
FIGURE 129 NIGERIA TAXI AGGREGATOR APPS CURRENT AND FUTURE END USER ANALYSIS, 2025–2034, (USD MILLION)
FIGURE 130 SOUTH AFRICA TAXI AGGREGATOR APPS CURRENT AND FUTURE TYPE ANALYSIS, 2025–2034, (USD MILLION)
FIGURE 131 SOUTH AFRICA TAXI AGGREGATOR APPS CURRENT AND FUTURE END USER ANALYSIS, 2025–2034, (USD MILLION)
FIGURE 132 ISRAEL TAXI AGGREGATOR APPS CURRENT AND FUTURE TYPE ANALYSIS, 2025–2034, (USD MILLION)
FIGURE 133 ISRAEL TAXI AGGREGATOR APPS CURRENT AND FUTURE END USER ANALYSIS, 2025–2034, (USD MILLION)
FIGURE 134 REST OF MEA TAXI AGGREGATOR APPS CURRENT AND FUTURE TYPE ANALYSIS, 2025–2034, (USD MILLION)
FIGURE 135 REST OF MEA TAXI AGGREGATOR APPS CURRENT AND FUTURE END USER ANALYSIS, 2025–2034, (USD MILLION)
FIGURE 136 U. S. MARKET SHARE ANALYSIS BY TYPE (2024)
FIGURE 137 U. S. MARKET SHARE ANALYSIS BY END USER (2024)
FIGURE 138 CANADA MARKET SHARE ANALYSIS BY TYPE (2024)
FIGURE 139 CANADA MARKET SHARE ANALYSIS BY END USER (2024)
FIGURE 140 MEXICO MARKET SHARE ANALYSIS BY TYPE (2024)
FIGURE 141 MEXICO MARKET SHARE ANALYSIS BY END USER (2024)
FIGURE 142 CHINA MARKET SHARE ANALYSIS BY TYPE (2024)
FIGURE 143 CHINA MARKET SHARE ANALYSIS BY END USER (2024)
FIGURE 144 JAPAN MARKET SHARE ANALYSIS BY TYPE (2024)
FIGURE 145 JAPAN MARKET SHARE ANALYSIS BY END USER (2024)
FIGURE 146 INDIA MARKET SHARE ANALYSIS BY TYPE (2024)
FIGURE 147 INDIA MARKET SHARE ANALYSIS BY END USER (2024)
FIGURE 148 SOUTH KOREA MARKET SHARE ANALYSIS BY TYPE (2024)
FIGURE 149 SOUTH KOREA MARKET SHARE ANALYSIS BY END USER (2024)
FIGURE 150 SAUDI ARABIA MARKET SHARE ANALYSIS BY TYPE (2024)
FIGURE 151 SAUDI ARABIA MARKET SHARE ANALYSIS BY END USER (2024)
FIGURE 152 UAE MARKET SHARE ANALYSIS BY TYPE (2024)
FIGURE 153 UAE MARKET SHARE ANALYSIS BY END USER (2024)
FIGURE 154 EGYPT MARKET SHARE ANALYSIS BY TYPE (2024)
FIGURE 155 EGYPT MARKET SHARE ANALYSIS BY END USER (2024)
FIGURE 156 NIGERIA MARKET SHARE ANALYSIS BY TYPE (2024)
FIGURE 157 NIGERIA MARKET SHARE ANALYSIS BY END USER (2024)
FIGURE 158 SOUTH AFRICA MARKET SHARE ANALYSIS BY TYPE (2024)
FIGURE 159 SOUTH AFRICA MARKET SHARE ANALYSIS BY END USER (2024)
FIGURE 160 GERMANY MARKET SHARE ANALYSIS BY TYPE (2024)
FIGURE 161 GERMANY MARKET SHARE ANALYSIS BY END USER (2024)
FIGURE 162 FRANCE MARKET SHARE ANALYSIS BY TYPE (2024)
FIGURE 163 FRANCE MARKET SHARE ANALYSIS BY END USER (2024)
FIGURE 164 UK MARKET SHARE ANALYSIS BY TYPE (2024)
FIGURE 165 UK MARKET SHARE ANALYSIS BY END USER (2024)
FIGURE 166 SPAIN MARKET SHARE ANALYSIS BY TYPE (2024)
FIGURE 167 SPAIN MARKET SHARE ANALYSIS BY END USER (2024)
FIGURE 168 ITALY MARKET SHARE ANALYSIS BY TYPE (2024)
FIGURE 169 ITALY MARKET SHARE ANALYSIS BY END USER (2024)
FIGURE 170 BRAZIL MARKET SHARE ANALYSIS BY TYPE (2024)
FIGURE 171 BRAZIL MARKET SHARE ANALYSIS BY END USER (2024)
FIGURE 172 ARGENTINA MARKET SHARE ANALYSIS BY TYPE (2024)
FIGURE 173 ARGENTINA MARKET SHARE ANALYSIS BY END USER (2024)
FIGURE 174 COLUMBIA MARKET SHARE ANALYSIS BY TYPE (2024)
FIGURE 175 COLUMBIA MARKET SHARE ANALYSIS BY END USER (2024)
FIGURE 176 GLOBAL TAXI AGGREGATOR APPS CURRENT AND FUTURE MARKET KEY COUNTRY LEVEL ANALYSIS, 2024–2034, (USD MILLION)
FIGURE 177 FINANCIAL OVERVIEW:
Key Players Analysis:
Uber Technologies, Inc.: Uber maintains global market leadership through its comprehensive platform spanning over 900 metropolitan areas worldwide. The company's competitive advantage lies in its diverse service portfolio including UberX, UberPOOL, UberEats, and freight services, creating multiple revenue streams and user touchpoints. Continuous technology innovation, including AI-powered routing and predictive analytics, enhances operational efficiency and user experience. Strategic partnerships with autonomous vehicle manufacturers and expansion into emerging markets support long-term growth objectives. Uber's platform-based business model enables rapid scaling and cross-service synergies while leveraging network effects to maintain market position.
Beijing Xiaoju Technology Co., Ltd. (Didi Chuxing): Didi Chuxing holds significant global market share with dominant presence in Asia-Pacific markets, particularly China where it serves over 550 million users. The company's strength lies in sophisticated AI algorithms for demand prediction, dynamic pricing, and route optimization, coupled with strong government relationships facilitating regulatory compliance. Comprehensive multi-modal service offerings including ride-hailing, bike-sharing, and food delivery create integrated mobility ecosystems. Despite generating the highest industry revenue of $19.7 billion, Didi faces regulatory challenges in international expansion. Investment in autonomous driving technology and electric vehicle integration positions the company for future market evolution.
Grab Holdings Inc.: Grab dominates Southeast Asian markets through its super-app strategy, integrating ride-hailing with financial services, food delivery, and digital payments. The company's competitive advantage stems from deep local market understanding, strategic government partnerships, and comprehensive ecosystem development. Regional focus enables cultural adaptation and regulatory compliance while building strong network effects. Expansion into financial technology and digital banking creates additional revenue streams and increases user engagement. Grab's IPO and subsequent capital raising support international expansion and technology development initiatives.
ANI Technologies Pvt. Ltd. (Ola): Ola leads the Indian taxi aggregator market through localized solutions, innovative features like SMS-based booking, and driver support programs including loan facilities. The company's competitive strength lies in understanding local market dynamics, offering services in multiple Indian languages, and providing flexible payment options including cash. Strategic expansion into international markets including Australia and the UK diversifies revenue sources. Investment in electric vehicle manufacturing and charging infrastructure supports sustainable mobility goals while reducing operational costs. Ola's focus on driver welfare and training programs enhances service quality and driver retention.
The rapid expansion of smartphone usage globally, coupled with accelerating urbanization, creates an ideal environment for taxi aggregator app adoption. With over 6.8 billion smartphone users worldwide, the accessibility of ride-hailing services has increased dramatically. Urban population growth, with over 68% of people expected to live in cities by 2050, generates substantial demand for efficient transportation solutions. Dense urban environments with traffic congestion and limited parking make taxi aggregator services attractive alternatives to private vehicle ownership. The convenience of booking rides through smartphones, combined with features like real-time tracking and cashless payments, appeals particularly to tech-savvy urban consumers seeking seamless mobility experiences.
Technological Advancements & AI Integration:
The integration of artificial intelligence, machine learning, and advanced analytics is revolutionizing taxi aggregator platforms through route optimization, predictive demand modeling, and personalized user experiences. AI-powered algorithms enable dynamic pricing, reduce wait times, and improve driver-passenger matching efficiency. Real-time data processing capabilities enhance service reliability through traffic pattern analysis and demand forecasting. Features like predictive maintenance, automated customer support, and intelligent routing systems reduce operational costs while improving service quality. The continuous evolution of mobile technology, including 5G connectivity and IoT integration, enables more sophisticated platform capabilities that drive user adoption and retention.
Restrain:
Regulatory Challenges & Compliance Complexity:
The taxi aggregator industry faces significant regulatory hurdles across different jurisdictions, with varying licensing requirements, safety standards, and operational restrictions. Government regulations regarding driver background checks, vehicle inspections, insurance requirements, and surge pricing policies create compliance complexities and operational costs. Some regions have implemented caps on the number of ride-hailing vehicles or restricted operating hours, limiting market growth potential. Legal disputes over driver classification, labor rights, and traditional taxi industry protection continue to create uncertainty. The fragmented regulatory landscape requires companies to adapt their business models for different markets, increasing operational complexity and legal costs while potentially limiting service expansion.
Intense Competition & Price Pressures:
The taxi aggregator market faces intense competition among established players and new entrants, leading to aggressive pricing strategies that pressure profit margins. Price wars and promotional campaigns, while benefiting consumers, strain company finances and sustainability. High customer acquisition costs due to competitive marketing spending reduce profitability, particularly in mature markets where customer switching is common. The low barriers to entry for new platforms create continuous competitive pressure, while driver supply constraints during peak demand periods affect service reliability. Market saturation in developed regions limits organic growth opportunities, forcing companies to expand into less profitable emerging markets or diversify service offerings to maintain revenue growth.
Opportunities:
Emerging Markets Expansion:
Developing countries in Asia-Pacific, Latin America, and Africa present substantial growth opportunities as smartphone penetration increases and urban populations expand. These markets often lack comprehensive public transportation infrastructure, creating demand for flexible mobility solutions. Rising middle-class populations with increasing disposable income drive adoption of convenient transportation services. Government investments in digital infrastructure and smart city initiatives support market development. Local partnerships with regional players, adaptation to local preferences, and culturally appropriate pricing strategies enable successful market entry. The total addressable market in emerging economies could exceed $200 billion by 2030, with countries like India, Brazil, and Indonesia leading adoption rates.
Integration of Electric & Autonomous Vehicles:
The transition towards sustainable transportation creates opportunities for taxi aggregator platforms to integrate electric vehicles, reducing operational costs and environmental impact. Government incentives for electric vehicle adoption, combined with decreasing battery costs, make EVs economically attractive for ride-hailing fleets. The development of autonomous vehicle technology represents a transformative opportunity to reduce the largest operational cost component – driver payments. Early partnerships with AV manufacturers and testing autonomous ride-hailing services in controlled environments position companies for future market leadership. Integration of charging infrastructure management and energy optimization systems create additional revenue streams while supporting sustainable mobility goals.
Trends:
AI-Powered Optimization & Predictive Analytics:
Taxi aggregator platforms are increasingly leveraging artificial intelligence and machine learning to optimize operations, enhance user experiences, and improve business efficiency. AI-powered route optimization reduces travel times and fuel consumption while predictive analytics enable better demand forecasting and dynamic pricing strategies. Machine learning algorithms analyze user behavior patterns to provide personalized recommendations and improve service delivery. Real-time data processing enables automated decision-making for driver allocation, surge pricing activation, and customer service responses. The integration of IoT sensors and smart city data feeds enhances traffic prediction and route planning capabilities, creating more efficient and reliable transportation networks.
Sustainable Mobility & Multi-Modal Integration:
Growing environmental consciousness is driving demand for sustainable transportation solutions, leading taxi aggregator platforms to integrate electric vehicles, promote ride-sharing, and offset carbon emissions. Multi-modal integration combines ride-hailing with public transportation, bike-sharing, and micro-mobility options to create comprehensive urban mobility ecosystems. Platforms are expanding beyond traditional taxi services to include delivery services, freight transportation, and logistics solutions. Subscription-based models offer unlimited rides or transportation credits, appealing to frequent users while providing predictable revenue streams. The convergence of mobility-as-a-service concepts enables seamless integration of various transportation modes through unified digital platforms.
Recent Development
In June 2025: Uber Technologies has officially rolled out its Senior Accounts program across the United States, representing a significant milestone in the company's commitment to inclusive transportation solutions for aging populations. This comprehensive initiative addresses the growing need for accessible mobility options as demographic projections indicate that nearly one in six people globally will be 60 or older by 2030.
In May 2025: SpotnRides, a company with over eight years of expertise in application development, has announced the release of their enhanced artificial intelligence-enabled taxi booking platform. This technological advancement represents a major milestone in the organization's continuous efforts to revolutionize urban transportation solutions and streamline ride reservation experiences.

 Aerospace And Defence
 Agriculture
 Automotive And Transportation
 Banking And Finance
 Business
 Chemicals And Materials
 Consumer And Retail
 Electronics And Semiconductors
 Food And Beverages
 Machinery & Equipments
 Manufacturing And Construction
 Medical Devices
 Others
 Pharmaceuticals And Healthcare
 Power And Energy
 Sports
 Technology

; Platform Technology (Android, iOS); Vehicle Type (Economy Cars, Executive Cars, SUVs/MUVs, Luxury Cars) Industry Region & Key Players-Industry Segment Overview, Market Dynamics, Competitive Strategies, Trends & Forecast 2025-2034")
; Platform Technology (Android, iOS); Vehicle Type (Economy Cars, Executive Cars, SUVs/MUVs, Luxury Cars) Industry Region & Key Players-Industry Segment Overview, Market Dynamics, Competitive Strategies, Trends & Forecast 2025-2034")
; Platform Technology (Android, iOS); Vehicle Type (Economy Cars, Executive Cars, SUVs/MUVs, Luxury Cars) Industry Region & Key Players-Industry Segment Overview, Market Dynamics, Competitive Strategies, Trends & Forecast 2025-2034")
; Platform Technology (Android, iOS); Vehicle Type (Economy Cars, Executive Cars, SUVs/MUVs, Luxury Cars) Industry Region & Key Players-Industry Segment Overview, Market Dynamics, Competitive Strategies, Trends & Forecast 2025-2034")

