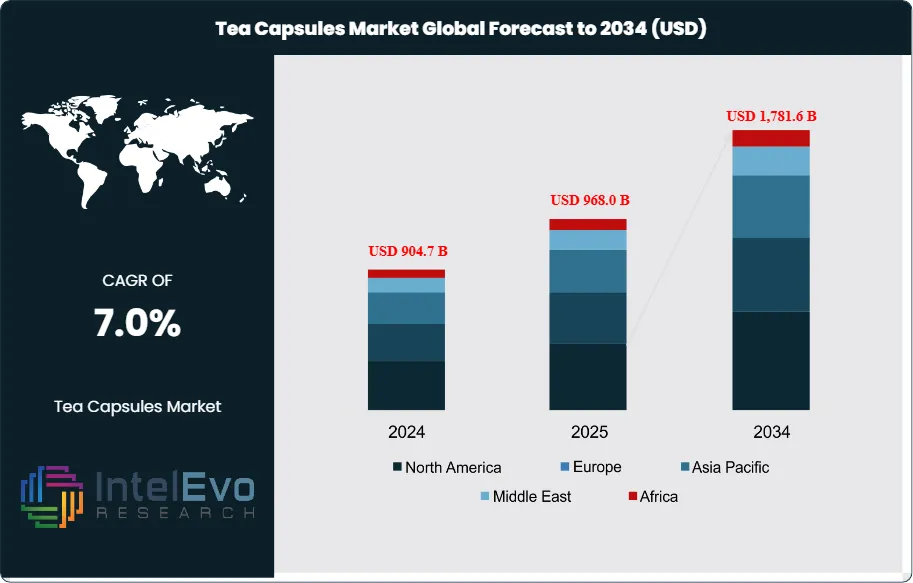
The Global Tea Capsules Market was valued at approximately USD 904.7 million in 2024 and is projected to reach nearly USD 1,781.6 million by 2034, supported by rising demand for convenient single-serve beverages and premium tea consumption trends. Based on the stated growth trajectory, the market size for 2025 is estimated at approximately USD 968.0 million. From 2026 onward, the market is expected to expand at a compound annual growth rate (CAGR) of approximately 7.0% during 2026–2034, ultimately reaching around USD 1,781.6 million by 2034.
Growth reflects the convergence of convenience, premiumization, and health-focused consumption within the broader hot beverages category. Tea capsules extend the installed base of single-serve coffee systems into tea drinking occasions, allowing brands to capture share from traditional loose and bagged formats. In 2024, single-serve formats already account for an estimated 18–20% of global at-home specialty tea spending, with capsules projected to exceed 25% by 2034 as adoption deepens in urban households and offices.
Demand-side momentum stems from rising preference for portion-controlled, consistently brewed beverages and expanding interest in green, herbal, and functional blends. Health-aware consumers increasingly favor teas positioned for antioxidant support, relaxation, and metabolic wellness, lifting the share of specialty and wellness-focused capsules to nearly 40% of segment revenue in 2024. On the supply side, leading manufacturers and private labels invest in capsule-compatible blends, origin-specific teas, and organic-certified offerings, while large tea producers integrate downstream into branded capsule portfolios. E-commerce and direct-to-consumer channels now contribute close to 30–32% of tea capsule sales, supported by subscription models and curated assortments.
Technology and automation reshape the value chain. Producers deploy automated filling and sealing lines to improve throughput and quality consistency, while AI-enabled demand forecasting optimizes inventory and reduces waste. Digital platforms use recommendation engines to personalize flavor discovery and cross-sell higher-margin specialty ranges. At the same time, regulators tighten oversight on food safety, labeling, and packaging waste. Extended producer responsibility rules and restrictions on non-recyclable materials accelerate innovation in compostable, biodegradable, and aluminum-recycling capsule formats. Key risks include volatile tea leaf prices, machine-compatibility constraints, increasing scrutiny of single-use packaging, and intensifying rivalry from both coffee capsules and ready-to-drink teas.
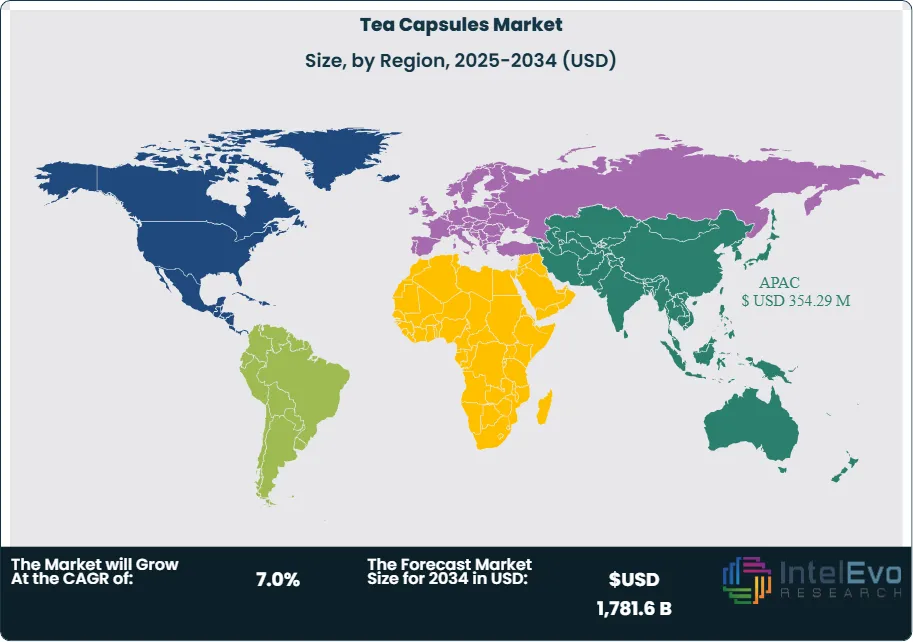
Regionally, Asia Pacific represents the largest tea consumption base, with India recognized as the leading tea-drinking nation in absolute terms and Turkey ranking among the highest in per capita intake. However, Europe currently leads in capsule penetration, accounting for roughly 35% of global tea capsule revenue in 2024, followed by North America at about 30% and Asia Pacific at nearly 25%. Expansion of modern retail, rapid growth of middle-income households, and strong tea-drinking traditions position Asia Pacific and parts of the Middle East as priority investment hotspots over the coming decade, particularly for brands that combine sustainable packaging, wellness-led formulations, and omnichannel distribution.
Key Takeaways
Market Growth: The global tea capsules market records revenue of 904.7 million USD, 2024 and will reach 1,781.6 million USD, 2034, growing at a 7.0% CAGR, 2024-2034.
Segment Dominance: Green tea capsules lead the product mix with a 42.6% share of global tea capsule revenue, 2024, reflecting strong preference for wellness-oriented formats.
Segment Dominance: Supermarkets and hypermarkets command 48.7% of distribution revenue, 2024, while the HoReCa application segment contributes 34.7% of global demand, 2024, anchoring volumes in organized retail and foodservice.
Driver: Convenience-led single-serve consumption and consistent brew quality support the 7.0% CAGR, 2024-2034, as households shift spending from loose and bagged tea formats. Growth in at-home machine installations gains momentum, supported by estimated: 60.0% household penetration of capsule-compatible brewers, 2034.
Restraint: Packaging waste concerns and price sensitivity limit faster adoption, as capsule products carry estimated: 15.0% price premium per cup versus conventional tea formats, 2024. Regulatory scrutiny on single-use materials in key markets could moderate volume expansion to an estimated: 6.0% annual growth in more restrictive jurisdictions, 2024-2034.
Opportunity: Manufacturers can capture incremental value by expanding herbal and functional blends, where herbs and spices already generate a 38.8% revenue share in end-use terms, 2024. Digital and direct-to-consumer models open new routes to market, with estimated: 35.0% of tea capsule sales transacting online, 2034.
Trend: Retailers and brands increasingly focus on sustainable and premium packaging, driving estimated: 50.0% of new product launches to feature recyclable or compostable capsules, 2030. Automation and data-driven inventory planning improve supply efficiency, cutting out-of-stock rates by an estimated: 20.0% in modern trade outlets, 2024-2034.
Regional Analysis: Asia-Pacific holds the largest regional share at 36.6% of global revenue, 2024, while Europe follows with a 28.8% share, 2024 and progresses at a 7.1% CAGR, 2024-2034. North America emerges as the fastest-growing region with an 8.2% CAGR, 2024-2034, lifting its contribution to an estimated: 30.0% of global market revenue, 2034.
By Type
The tea capsule market continues to diversify as consumers expect precision, consistency, and convenience in daily beverage routines. Green tea capsules gained the highest share in 2024 at 42.6 percent. This reflects rising interest in beverages linked to wellness, metabolism balance, and antioxidant intake. You see stronger demand in markets where health awareness is accelerating, including Asia Pacific, Europe, and North America. These capsules also benefit from steady adoption among first-time buyers who shift from loose-leaf formats to portioned servings.
Growth across other categories remains steady. Black tea capsules retain a strong base in regions where black tea is traditionally preferred. Herbal tea capsules attract buyers seeking caffeine-free alternatives with functional attributes. The category labelled “others” includes fruit blends and specialty teas that appeal to niche buyers looking for distinct flavors. As capsule machine penetration increases globally, all segments are expected to expand at rates between 6 and 9 percent annually through 2028.
The outlook suggests sustained interest in green and herbal formats as consumers prioritize predictable taste and reduced preparation time. Brands that introduce origin-specific teas or certified organic blends are expected to capture additional share in higher-income urban markets.
By Application
The HoReCa segment led global demand in 2024 with a 34.7 percent share. Hotels, restaurants, and cafes prefer tea capsules because they reduce preparation time and support consistent service quality. Capsule systems also help staff manage peak-hour demand without compromising flavor or presentation. These features have made capsules a preferred option in establishments that handle high turnover and require predictable beverage output.
Residential adoption has risen as machine prices decline and online retail expands. You see households adopting capsules for convenience, portion control, and flavor variety. Commercial offices also contribute to demand as employers install beverage stations to support staff preferences for quick tea options. Together, residential and commercial channels show an annual growth trend of 7 to 10 percent through 2029.
The overall application outlook remains positive. HoReCa is expected to maintain its lead as hospitality groups update service models, while residential demand expands with broader machine availability and subscription-based capsule purchases.
By End-Use
Residential buildings represent the fastest-expanding end-use category due to rising machine ownership and broader awareness of capsule-based beverages. Households view capsules as a clean and consistent brewing method that minimizes waste and reduces preparation steps. This segment is projected to grow at an annual rate of approximately 9 percent from 2025 to 2030.
Commercial buildings, including offices and coworking spaces, continue to integrate capsule systems to meet employee beverage expectations. These installations help reduce wait times and improve service reliability. Industrial facilities show slower adoption, although demand increases in locations offering staff cafeterias with automated beverage systems.
The market structure indicates that residential and commercial buildings will account for more than 60 percent of total volume by 2030. Retailers and machine manufacturers increasingly target these segments with bundled offerings and curated flavor options.
By Region
Asia Pacific held 36.6 percent of global revenue in 2024. The region’s long-standing tea culture, combined with rising urban spending power, supports rapid adoption of capsule formats. China, India, and Japan lead consumption due to growing interest in premium beverages and greater acceptance of automated brewing systems. Retail expansion and strong e-commerce penetration make capsules widely accessible.
Europe accounts for a substantial share as well, supported by established single-serve habits and growing demand for specialty teas. Europe posted a 2024 share of 28.8 percent and is projected to grow at a 7.1 percent annual rate through 2034. North America remains the fastest-expanding region with an expected CAGR of 8.2 percent as households shift from coffee-only capsule use to mixed beverage capsules.
Latin America and the Middle East & Africa show emerging potential as capsule machine prices fall and modern retail expands. These regions are expected to grow at annual rates between 6 and 9 percent, driven by urban population growth and rising interest in premium beverages.
By Type (Black Tea Capsules, Green Tea Capsule, Herbal Tea Capsule, Others), By Distribution Channel (Supermarkets/Hypermarkets, Specialty Stores, Online Retail, Other Distribution Channels), By End-Use (Herbs & Spices (Chamomile, Berries, Hibiscus, Pomegranate, Others)), By Application (HoReCa, Residential, Commercial, Others)
Research Methodology
Primary Research- 100 Interviews of Stakeholders
Secondary Research
Desk Research
Regional scope
North America (United States, Canada, Mexico)
Latin America (Brazil, Argentina, Columbia)
East Asia And Pacific (China, Japan, South Korea, Australia, Cambodia, Fiji, Indonesia)
Sea And South Asia (India, Singapore, Thailand, Taiwan, Malaysia)
Eastern Europe (Poland, Russia, Czech Republic, Romania)
Western Europe (Germany, U.K., France, Spain, Itlay)
Middle East & Africa (GCC Countries, Egypt, Nigeria, South Africa, Israel)
Competitive Landscape
Rene Coffee Pads Magmar, Plants Med Laboratories Pvt. Ltd., Bonhomia World, Italytrade SRL, LIPTON Teas and Infusions, Zoic Pharmaceuticals, Melitta Single Portions, T. Ronnefeldt KG, Nestlé S.A., Tea Château, Lexicare Pharma Pvt. Ltd., Red Espresso, AdvaCare Pharma, Other Key Players
Customization Scope
Customization for segments, region/country-level will be provided. Moreover, additional customization can be done based on the requirements.
Pricing and Purchase Options
Avail customized purchase options to meet your exact research needs. We have three licenses to opt for: Single User License, Multi-User License (Up to 5 Users), Corporate Use License (Unlimited User and Printable PDF).
TABLE OF CONTENTS
1. EXECUTIVE SUMMARY
1.1. MARKET SNAPSHOT
1.2. KEY FINDINGS & INSIGHTS
1.3. ANALYST RECOMMENDATIONS
1.4. FUTURE OUTLOOK
2. RESEARCH METHODOLOGY
2.1. MARKET DEFINITION & SCOPE
2.2. RESEARCH OBJECTIVES: PRIMARY & SECONDARY DATA SOURCES
2.3. DATA COLLECTION SOURCES
2.3.1. COVERAGE OF 100+ PRIMARY RESEARCH/CONSULTATION CALLS WITH INDUSTRY STAKEHOLDERS
FIGURE 17 NORTH AMERICA TEA CAPSULESCURRENT AND FUTURE TYPE ANALYSIS, 2025–2034, (USD MILLION)
FIGURE 18 NORTH AMERICA TEA CAPSULESCURRENT AND FUTURE END USER ANALYSIS, 2025–2034, (USD MILLION)
FIGURE 19 MARKET SHARE BY COUNTRY
FIGURE 20 LATIN AMERICA TEA CAPSULESCURRENT AND FUTURE TYPE ANALYSIS, 2025–2034, (USD MILLION)
FIGURE 21 LATIN AMERICA TEA CAPSULESCURRENT AND FUTURE END USER ANALYSIS, 2025–2034, (USD MILLION)
FIGURE 22 MARKET SHARE BY COUNTRY
FIGURE 23 EASTERN EUROPE TEA CAPSULESCURRENT AND FUTURE TYPE ANALYSIS, 2025–2034, (USD MILLION)
FIGURE 24 EASTERN EUROPE TEA CAPSULESCURRENT AND FUTURE END USER ANALYSIS, 2025–2034, (USD MILLION)
FIGURE 25 MARKET SHARE BY COUNTRY
FIGURE 26 WESTERN EUROPE TEA CAPSULESCURRENT AND FUTURE TYPE ANALYSIS, 2025–2034, (USD MILLION)
FIGURE 27 WESTERN EUROPE TEA CAPSULESCURRENT AND FUTURE END USER ANALYSIS, 2025–2034, (USD MILLION)
FIGURE 28 MARKET SHARE BY COUNTRY
FIGURE 29 EAST ASIA AND PACIFIC TEA CAPSULESCURRENT AND FUTURE TYPE ANALYSIS, 2025–2034, (USD MILLION)
FIGURE 30 EAST ASIA AND PACIFIC TEA CAPSULESCURRENT AND FUTURE END USER ANALYSIS, 2025–2034, (USD MILLION)
FIGURE 31 MARKET SHARE BY COUNTRY
FIGURE 32 SEA AND SOUTH ASIA TEA CAPSULESCURRENT AND FUTURE TYPE ANALYSIS, 2025–2034, (USD MILLION)
FIGURE 33 SEA AND SOUTH ASIA TEA CAPSULESCURRENT AND FUTURE END USER ANALYSIS, 2025–2034, (USD MILLION)
FIGURE 34 MARKET SHARE BY COUNTRY
FIGURE 35 MIDDLE EAST AND AFRICA TEA CAPSULESCURRENT AND FUTURE TYPE ANALYSIS, 2025–2034, (USD MILLION)
FIGURE 36 MIDDLE EAST AND AFRICA TEA CAPSULESCURRENT AND FUTURE END USER ANALYSIS, 2025–2034, (USD MILLION)
FIGURE 37 NORTH AMERICA TEA CAPSULESCURRENT AND FUTURE MARKET VOLUME SHARE REGIONAL ANALYSIS, 2025–2034, (USD MILLION)
FIGURE 38 U.S. TEA CAPSULESCURRENT AND FUTURE TYPE ANALYSIS, 2025–2034, (USD MILLION)
FIGURE 39 U.S. TEA CAPSULESCURRENT AND FUTURE END USER ANALYSIS, 2025–2034, (USD MILLION)
FIGURE 40 CANADA TEA CAPSULESCURRENT AND FUTURE TYPE ANALYSIS, 2025–2034, (USD MILLION)
FIGURE 41 CANADA TEA CAPSULESCURRENT AND FUTURE END USER ANALYSIS, 2025–2034, (USD MILLION)
FIGURE 42 LATIN AMERICA TEA CAPSULESCURRENT AND FUTURE MARKET VOLUME SHARE REGIONAL ANALYSIS, 2025–2034, (USD MILLION)
FIGURE 43 MEXICO TEA CAPSULESCURRENT AND FUTURE TYPE ANALYSIS, 2025–2034, (USD MILLION)
FIGURE 44 MEXICO TEA CAPSULESCURRENT AND FUTURE END USER ANALYSIS, 2025–2034, (USD MILLION)
FIGURE 45 BRAZIL TEA CAPSULESCURRENT AND FUTURE TYPE ANALYSIS, 2025–2034, (USD MILLION)
FIGURE 46 BRAZIL TEA CAPSULESCURRENT AND FUTURE END USER ANALYSIS, 2025–2034, (USD MILLION)
FIGURE 47 ARGENTINA TEA CAPSULESCURRENT AND FUTURE TYPE ANALYSIS, 2025–2034, (USD MILLION)
FIGURE 48 ARGENTINA TEA CAPSULESCURRENT AND FUTURE END USER ANALYSIS, 2025–2034, (USD MILLION)
FIGURE 49 COLUMBIA TEA CAPSULESCURRENT AND FUTURE TYPE ANALYSIS, 2025–2034, (USD MILLION)
FIGURE 50 COLUMBIA TEA CAPSULESCURRENT AND FUTURE END USER ANALYSIS, 2025–2034, (USD MILLION)
FIGURE 51 REST OF LATIN AMERICA TEA CAPSULESCURRENT AND FUTURE TYPE ANALYSIS, 2025–2034, (USD MILLION)
FIGURE 52 REST OF LATIN AMERICA TEA CAPSULESCURRENT AND FUTURE END USER ANALYSIS, 2025–2034, (USD MILLION)
FIGURE 53 EASTERN EUROPE TEA CAPSULESCURRENT AND FUTURE MARKET VOLUME SHARE REGIONAL ANALYSIS, 2025–2034, (USD MILLION)
FIGURE 54 POLAND TEA CAPSULESCURRENT AND FUTURE TYPE ANALYSIS, 2025–2034, (USD MILLION)
FIGURE 55 POLAND TEA CAPSULESCURRENT AND FUTURE END USER ANALYSIS, 2025–2034, (USD MILLION)
FIGURE 56 RUSSIA TEA CAPSULESCURRENT AND FUTURE TYPE ANALYSIS, 2025–2034, (USD MILLION)
FIGURE 57 RUSSIA TEA CAPSULESCURRENT AND FUTURE END USER ANALYSIS, 2025–2034, (USD MILLION)
FIGURE 58 CZECH REPUBLIC TEA CAPSULESCURRENT AND FUTURE TYPE ANALYSIS, 2025–2034, (USD MILLION)
FIGURE 59 CZECH REPUBLIC TEA CAPSULESCURRENT AND FUTURE END USER ANALYSIS, 2025–2034, (USD MILLION)
FIGURE 60 ROMANIA TEA CAPSULESCURRENT AND FUTURE TYPE ANALYSIS, 2025–2034, (USD MILLION)
FIGURE 61 ROMANIA TEA CAPSULESCURRENT AND FUTURE END USER ANALYSIS, 2025–2034, (USD MILLION)
FIGURE 62 REST OF EASTERN EUROPE TEA CAPSULESCURRENT AND FUTURE TYPE ANALYSIS, 2025–2034, (USD MILLION)
FIGURE 63 REST OF EASTERN EUROPE TEA CAPSULESCURRENT AND FUTURE END USER ANALYSIS, 2025–2034, (USD MILLION)
FIGURE 64 WESTERN EUROPE TEA CAPSULESCURRENT AND FUTURE MARKET VOLUME SHARE REGIONAL ANALYSIS, 2025–2034, (USD MILLION)
FIGURE 65 GERMANY TEA CAPSULESCURRENT AND FUTURE TYPE ANALYSIS, 2025–2034, (USD MILLION)
FIGURE 66 GERMANY TEA CAPSULESCURRENT AND FUTURE END USER ANALYSIS, 2025–2034, (USD MILLION)
FIGURE 67 FRANCE TEA CAPSULESCURRENT AND FUTURE TYPE ANALYSIS, 2025–2034, (USD MILLION)
FIGURE 68 FRANCE TEA CAPSULESCURRENT AND FUTURE END USER ANALYSIS, 2025–2034, (USD MILLION)
FIGURE 69 UK TEA CAPSULESCURRENT AND FUTURE TYPE ANALYSIS, 2025–2034, (USD MILLION)
FIGURE 70 UK TEA CAPSULESCURRENT AND FUTURE END USER ANALYSIS, 2025–2034, (USD MILLION)
FIGURE 71 SPAIN TEA CAPSULESCURRENT AND FUTURE TYPE ANALYSIS, 2025–2034, (USD MILLION)
FIGURE 72 SPAIN TEA CAPSULESCURRENT AND FUTURE END USER ANALYSIS, 2025–2034, (USD MILLION)
FIGURE 73 ITALY TEA CAPSULESCURRENT AND FUTURE TYPE ANALYSIS, 2025–2034, (USD MILLION)
FIGURE 74 ITALY TEA CAPSULESCURRENT AND FUTURE END USER ANALYSIS, 2025–2034, (USD MILLION)
FIGURE 75 REST OF WESTERN EUROPE TEA CAPSULESCURRENT AND FUTURE TYPE ANALYSIS, 2025–2034, (USD MILLION)
FIGURE 76 REST OF WESTERN EUROPE TEA CAPSULESCURRENT AND FUTURE END USER ANALYSIS, 2025–2034, (USD MILLION)
FIGURE 77 EAST ASIA AND PACIFIC TEA CAPSULESCURRENT AND FUTURE MARKET VOLUME SHARE REGIONAL ANALYSIS, 2025–2034, (USD MILLION)
FIGURE 78 CHINA TEA CAPSULESCURRENT AND FUTURE TYPE ANALYSIS, 2025–2034, (USD MILLION)
FIGURE 79 CHINA TEA CAPSULESCURRENT AND FUTURE END USER ANALYSIS, 2025–2034, (USD MILLION)
FIGURE 80 JAPAN TEA CAPSULESCURRENT AND FUTURE TYPE ANALYSIS, 2025–2034, (USD MILLION)
FIGURE 81 JAPAN TEA CAPSULESCURRENT AND FUTURE END USER ANALYSIS, 2025–2034, (USD MILLION)
FIGURE 82 AUSTRALIA TEA CAPSULESCURRENT AND FUTURE TYPE ANALYSIS, 2025–2034, (USD MILLION)
FIGURE 83 AUSTRALIA TEA CAPSULESCURRENT AND FUTURE END USER ANALYSIS, 2025–2034, (USD MILLION)
FIGURE 84 CAMBODIA TEA CAPSULESCURRENT AND FUTURE TYPE ANALYSIS, 2025–2034, (USD MILLION)
FIGURE 85 CAMBODIA TEA CAPSULESCURRENT AND FUTURE END USER ANALYSIS, 2025–2034, (USD MILLION)
FIGURE 86 FIJI TEA CAPSULESCURRENT AND FUTURE TYPE ANALYSIS, 2025–2034, (USD MILLION)
FIGURE 87 FIJI TEA CAPSULESCURRENT AND FUTURE END USER ANALYSIS, 2025–2034, (USD MILLION)
FIGURE 88 INDONESIA TEA CAPSULESCURRENT AND FUTURE TYPE ANALYSIS, 2025–2034, (USD MILLION)
FIGURE 89 INDONESIA TEA CAPSULESCURRENT AND FUTURE END USER ANALYSIS, 2025–2034, (USD MILLION)
FIGURE 90 SOUTH KOREA TEA CAPSULESCURRENT AND FUTURE TYPE ANALYSIS, 2025–2034, (USD MILLION)
FIGURE 91 SOUTH KOREA TEA CAPSULESCURRENT AND FUTURE END USER ANALYSIS, 2025–2034, (USD MILLION)
FIGURE 92 REST OF EAST ASIA AND PACIFIC TEA CAPSULESCURRENT AND FUTURE TYPE ANALYSIS, 2025–2034, (USD MILLION)
FIGURE 93 REST OF EAST ASIA AND PACIFIC TEA CAPSULESCURRENT AND FUTURE END USER ANALYSIS, 2025–2034, (USD MILLION)
FIGURE 94 SEA AND SOUTH ASIA TEA CAPSULESCURRENT AND FUTURE MARKET VOLUME SHARE REGIONAL ANALYSIS, 2025–2034, (USD MILLION)
FIGURE 95 BANGLADESH TEA CAPSULESCURRENT AND FUTURE TYPE ANALYSIS, 2025–2034, (USD MILLION)
FIGURE 96 BANGLADESH TEA CAPSULESCURRENT AND FUTURE END USER ANALYSIS, 2025–2034, (USD MILLION)
FIGURE 97 NEW ZEALAND TEA CAPSULESCURRENT AND FUTURE TYPE ANALYSIS, 2025–2034, (USD MILLION)
FIGURE 98 NEW ZEALAND TEA CAPSULESCURRENT AND FUTURE END USER ANALYSIS, 2025–2034, (USD MILLION)
FIGURE 99 INDIA TEA CAPSULESCURRENT AND FUTURE TYPE ANALYSIS, 2025–2034, (USD MILLION)
FIGURE 100 INDIA TEA CAPSULESCURRENT AND FUTURE END USER ANALYSIS, 2025–2034, (USD MILLION)
FIGURE 101 SINGAPORE TEA CAPSULESCURRENT AND FUTURE TYPE ANALYSIS, 2025–2034, (USD MILLION)
FIGURE 102 SINGAPORE TEA CAPSULESCURRENT AND FUTURE END USER ANALYSIS, 2025–2034, (USD MILLION)
FIGURE 103 THAILAND TEA CAPSULESCURRENT AND FUTURE TYPE ANALYSIS, 2025–2034, (USD MILLION)
FIGURE 104 THAILAND TEA CAPSULESCURRENT AND FUTURE END USER ANALYSIS, 2025–2034, (USD MILLION)
FIGURE 105 TAIWAN TEA CAPSULESCURRENT AND FUTURE TYPE ANALYSIS, 2025–2034, (USD MILLION)
FIGURE 106 TAIWAN TEA CAPSULESCURRENT AND FUTURE END USER ANALYSIS, 2025–2034, (USD MILLION)
FIGURE 107 MALAYSIA TEA CAPSULESCURRENT AND FUTURE TYPE ANALYSIS, 2025–2034, (USD MILLION)
FIGURE 108 MALAYSIA TEA CAPSULESCURRENT AND FUTURE END USER ANALYSIS, 2025–2034, (USD MILLION)
FIGURE 109 REST OF SEA AND SOUTH ASIA TEA CAPSULESCURRENT AND FUTURE TYPE ANALYSIS, 2025–2034, (USD MILLION)
FIGURE 110 REST OF SEA AND SOUTH ASIA TEA CAPSULESCURRENT AND FUTURE END USER ANALYSIS, 2025–2034, (USD MILLION)
FIGURE 111 MIDDLE EAST AND AFRICA TEA CAPSULESCURRENT AND FUTURE MARKET VOLUME SHARE REGIONAL ANALYSIS, 2025–2034, (USD MILLION)
FIGURE 112 GCC COUNTRIES TEA CAPSULESCURRENT AND FUTURE TYPE ANALYSIS, 2025–2034, (USD MILLION)
FIGURE 113 GCC COUNTRIES TEA CAPSULESCURRENT AND FUTURE END USER ANALYSIS, 2025–2034, (USD MILLION)
FIGURE 114 SAUDI ARABIA TEA CAPSULESCURRENT AND FUTURE TYPE ANALYSIS, 2025–2034, (USD MILLION)
FIGURE 115 SAUDI ARABIA TEA CAPSULESCURRENT AND FUTURE END USER ANALYSIS, 2025–2034, (USD MILLION)
FIGURE 116 UAE TEA CAPSULESCURRENT AND FUTURE TYPE ANALYSIS, 2025–2034, (USD MILLION)
FIGURE 117 UAE TEA CAPSULESCURRENT AND FUTURE END USER ANALYSIS, 2025–2034, (USD MILLION)
FIGURE 118 BAHRAIN TEA CAPSULESCURRENT AND FUTURE TYPE ANALYSIS, 2025–2034, (USD MILLION)
FIGURE 119 BAHRAIN TEA CAPSULESCURRENT AND FUTURE END USER ANALYSIS, 2025–2034, (USD MILLION)
FIGURE 120 KUWAIT TEA CAPSULESCURRENT AND FUTURE TYPE ANALYSIS, 2025–2034, (USD MILLION)
FIGURE 121 KUWAIT TEA CAPSULESCURRENT AND FUTURE END USER ANALYSIS, 2025–2034, (USD MILLION)
FIGURE 122 OMAN TEA CAPSULESCURRENT AND FUTURE TYPE ANALYSIS, 2025–2034, (USD MILLION)
FIGURE 123 OMAN TEA CAPSULESCURRENT AND FUTURE END USER ANALYSIS, 2025–2034, (USD MILLION)
FIGURE 124 QATAR TEA CAPSULESCURRENT AND FUTURE TYPE ANALYSIS, 2025–2034, (USD MILLION)
FIGURE 125 QATAR TEA CAPSULESCURRENT AND FUTURE END USER ANALYSIS, 2025–2034, (USD MILLION)
FIGURE 126 EGYPT TEA CAPSULESCURRENT AND FUTURE TYPE ANALYSIS, 2025–2034, (USD MILLION)
FIGURE 127 EGYPT TEA CAPSULESCURRENT AND FUTURE END USER ANALYSIS, 2025–2034, (USD MILLION)
FIGURE 128 NIGERIA TEA CAPSULESCURRENT AND FUTURE TYPE ANALYSIS, 2025–2034, (USD MILLION)
FIGURE 129 NIGERIA TEA CAPSULESCURRENT AND FUTURE END USER ANALYSIS, 2025–2034, (USD MILLION)
FIGURE 130 SOUTH AFRICA TEA CAPSULESCURRENT AND FUTURE TYPE ANALYSIS, 2025–2034, (USD MILLION)
FIGURE 131 SOUTH AFRICA TEA CAPSULESCURRENT AND FUTURE END USER ANALYSIS, 2025–2034, (USD MILLION)
FIGURE 132 ISRAEL TEA CAPSULESCURRENT AND FUTURE TYPE ANALYSIS, 2025–2034, (USD MILLION)
FIGURE 133 ISRAEL TEA CAPSULESCURRENT AND FUTURE END USER ANALYSIS, 2025–2034, (USD MILLION)
FIGURE 134 REST OF MEA TEA CAPSULESCURRENT AND FUTURE TYPE ANALYSIS, 2025–2034, (USD MILLION)
FIGURE 135 REST OF MEA TEA CAPSULESCURRENT AND FUTURE END USER ANALYSIS, 2025–2034, (USD MILLION)
FIGURE 136 U. S. MARKET SHARE ANALYSIS BY TYPE (2024)
FIGURE 137 U. S. MARKET SHARE ANALYSIS BY END USER (2024)
FIGURE 138 CANADA MARKET SHARE ANALYSIS BY TYPE (2024)
FIGURE 139 CANADA MARKET SHARE ANALYSIS BY END USER (2024)
FIGURE 140 MEXICO MARKET SHARE ANALYSIS BY TYPE (2024)
FIGURE 141 MEXICO MARKET SHARE ANALYSIS BY END USER (2024)
FIGURE 142 CHINA MARKET SHARE ANALYSIS BY TYPE (2024)
FIGURE 143 CHINA MARKET SHARE ANALYSIS BY END USER (2024)
FIGURE 144 JAPAN MARKET SHARE ANALYSIS BY TYPE (2024)
FIGURE 145 JAPAN MARKET SHARE ANALYSIS BY END USER (2024)
FIGURE 146 INDIA MARKET SHARE ANALYSIS BY TYPE (2024)
FIGURE 147 INDIA MARKET SHARE ANALYSIS BY END USER (2024)
FIGURE 148 SOUTH KOREA MARKET SHARE ANALYSIS BY TYPE (2024)
FIGURE 149 SOUTH KOREA MARKET SHARE ANALYSIS BY END USER (2024)
FIGURE 150 SAUDI ARABIA MARKET SHARE ANALYSIS BY TYPE (2024)
FIGURE 151 SAUDI ARABIA MARKET SHARE ANALYSIS BY END USER (2024)
FIGURE 152 UAE MARKET SHARE ANALYSIS BY TYPE (2024)
FIGURE 153 UAE MARKET SHARE ANALYSIS BY END USER (2024)
FIGURE 154 EGYPT MARKET SHARE ANALYSIS BY TYPE (2024)
FIGURE 155 EGYPT MARKET SHARE ANALYSIS BY END USER (2024)
FIGURE 156 NIGERIA MARKET SHARE ANALYSIS BY TYPE (2024)
FIGURE 157 NIGERIA MARKET SHARE ANALYSIS BY END USER (2024)
FIGURE 158 SOUTH AFRICA MARKET SHARE ANALYSIS BY TYPE (2024)
FIGURE 159 SOUTH AFRICA MARKET SHARE ANALYSIS BY END USER (2024)
FIGURE 160 GERMANY MARKET SHARE ANALYSIS BY TYPE (2024)
FIGURE 161 GERMANY MARKET SHARE ANALYSIS BY END USER (2024)
FIGURE 162 FRANCE MARKET SHARE ANALYSIS BY TYPE (2024)
FIGURE 163 FRANCE MARKET SHARE ANALYSIS BY END USER (2024)
FIGURE 164 UK MARKET SHARE ANALYSIS BY TYPE (2024)
FIGURE 165 UK MARKET SHARE ANALYSIS BY END USER (2024)
FIGURE 166 SPAIN MARKET SHARE ANALYSIS BY TYPE (2024)
FIGURE 167 SPAIN MARKET SHARE ANALYSIS BY END USER (2024)
FIGURE 168 ITALY MARKET SHARE ANALYSIS BY TYPE (2024)
FIGURE 169 ITALY MARKET SHARE ANALYSIS BY END USER (2024)
FIGURE 170 BRAZIL MARKET SHARE ANALYSIS BY TYPE (2024)
FIGURE 171 BRAZIL MARKET SHARE ANALYSIS BY END USER (2024)
FIGURE 172 ARGENTINA MARKET SHARE ANALYSIS BY TYPE (2024)
FIGURE 173 ARGENTINA MARKET SHARE ANALYSIS BY END USER (2024)
FIGURE 174 COLUMBIA MARKET SHARE ANALYSIS BY TYPE (2024)
FIGURE 175 COLUMBIA MARKET SHARE ANALYSIS BY END USER (2024)
FIGURE 176 GLOBAL TEA CAPSULESCURRENT AND FUTURE MARKET KEY COUNTRY LEVEL ANALYSIS, 2024–2034, (USD MILLION)
FIGURE 177 FINANCIAL OVERVIEW:
Key Player Analysis
ApTap Ltd.: ApTap Ltd. positions itself as a niche player in the tea capsules market through technology-driven subscription management tools that support retail partners and specialty beverage brands. The company strengthens its relevance by enabling automated billing, usage insights, and recurring purchase workflows that improve customer retention for capsule manufacturers. In 2025, ApTap expands integrations with e-commerce platforms and machine manufacturers to support higher reorder accuracy and reduce churn. This aligns with a market where more than 30 percent of tea capsule sales now occur through digital channels. The firm’s differentiator lies in its ability to link consumer behavior data with automated replenishment, which gives beverage brands clearer demand visibility and improves forecasting accuracy across regional markets.
ApTap’s strategic focus on API-led partnerships positions the company as a valuable enabler for smaller capsule brands seeking better customer lifetime value. The company invests in analytics features that help retailers understand flavor-specific demand trends and regional order frequency. These capabilities strengthen its competitive stance as capsule producers adopt digital tools that support subscription sales and personalized product recommendations.
Axio Digital Pvt. Ltd.: Axio Digital Pvt. Ltd. acts as a challenger in the broader retail and payments ecosystem that supports consumer goods categories such as tea capsules. The company provides financing and checkout solutions that increase conversion rates for capsule purchases in both online and offline channels. Axio’s installment-based payment structure appeals to machine buyers and high-frequency capsule consumers. Its involvement in the tea capsule value chain grows as premium capsules and branded assortments gain traction in markets like India and Southeast Asia.
In 2025, Axio expands partnerships with beverage retailers and household appliance brands to support integrated checkout flows and loyalty programs. The firm reports double-digit user growth across its payment platform, with more than 20 million active users engaging with its financing options across consumer packaged goods. Axio’s differentiator is its ability to reduce purchase friction for recurring beverage spend while providing merchants with real-time risk scoring and payment analytics.
Bill.com LLC: Bill.com LLC positions itself as a leader in financial automation for small and mid-sized businesses operating in the tea capsules supply chain. The company’s accounts payable and receivable automation tools support distributors, HoReCa suppliers, and specialty beverage retailers who require streamlined payment processes. In 2025, Bill.com expands machine-learning-based invoice categorization and multi-currency support, which benefits capsule manufacturers exporting to North America, Europe, and Asia Pacific. These sectors account for more than 80 percent of global tea capsule revenue.
The firm strengthens its market relevance through integrations with ERP and inventory systems used by beverage distributors. This reduces manual workload and improves order accuracy across seasonal capsule portfolios. Bill.com’s differentiator lies in its ability to reduce payment cycle times by up to 50 percent, which helps capsule suppliers manage working capital more effectively. Its platform scale and enterprise partnerships position it as a preferred financial operations provider for companies seeking predictable cash flow and better supply chain visibility.
Market Key Players
Rene Coffee Pads Magmar
Plants Med Laboratories Pvt. Ltd.
Bonhomia World
Italytrade SRL
LIPTON Teas and Infusions
Zoic Pharmaceuticals
Melitta Single Portions
T. Ronnefeldt KG
Nestlé S.A.
Tea Château
Lexicare Pharma Pvt. Ltd.
Red Espresso
AdvaCare Pharma
Other Key Players
Driver: The Wellness Revolution and Convenience
The Shift Toward Functional Hydration
By 2026, health and wellbeing will be the main drivers of consumer behavior in the beverage market. Shoppers are increasingly choosing tea capsules associated with specific health benefits, such as high antioxidant content, stress relief, and improved metabolic balance. This trend is especially noticeable in urban areas, where busy professionals seek routine wellness products that fit their fast-paced lives. Tea capsules fill this need by providing a consistent, high-quality brew that serves as a healthier alternative to sugary drinks or too much caffeine.
Dominance of Herbal and Green Varietals
This focus on wellness has led green and herbal tea capsules to make up over 40 percent of total category revenue. These capsules provide precise portion control and preserve the delicate qualities of herbal ingredients better than traditional bags, making them a common choice for many households. This strong demand is driving a market growth rate of about 7 percent annually through 2030. Brands are competing to launch innovative, health-focused blends. This means manufacturers need shorter development cycles to keep pace with the quickly changing health trends of the "self-care" generation.
Restraint: Environmental Volatility and Supply Risks
Impact of Climate Change on Yields
In 2026, climate variability has shifted from a long-term concern to an urgent operational challenge for the tea industry. Key tea-producing regions are dealing with rising temperatures, unpredictable rainfall, and serious soil degradation, all of which threaten reliable yields and leaf quality. For capsule manufacturers, these changes lead directly to raw material shortages and rising procurement costs. Uncertainty in seasonal harvests complicates efforts to provide the consistent flavor profiles that consumers expect from capsules.
Long-Term Supply Chain Fragility
The outlook for the coming decades poses a significant threat to market stability. It's expected that the suitability of traditional tea-growing regions will decrease by more than 20 percent by 2050. This creates a high-risk situation for supply issues and forces manufacturers to rethink their sourcing strategies and contract agreements. Companies face rising costs that they must either absorb or pass on to consumers, which could hurt the price competitiveness of premium tea capsules against other beverages.
Opportunity: Portfolio Diversification and Functional Blends
The Rise of Botanical and Specialty Infusions
Manufacturers are finding major growth opportunities by broadening their portfolios beyond traditional black and green teas to include specialized functional blends. Interest is rising in capsules that include ingredients like ginger, turmeric, and cinnamon, known for their anti-inflammatory and digestive properties. These products attract "proactive" consumers who see their drinks as health supplements. Offering these botanical extracts in convenient capsules allows companies to support premium pricing.
Personalization and Curated Flavor Sets
The specialty tea capsule market is expected to exceed USD 1.8 billion by 2034, fueled largely by the popularity of seasonal and limited-edition offerings. These curated selections encourage casual drinkers to try new products and help brands stand out in a crowded retail environment. By creating personalized subscription sets that align with individual flavor preferences or wellness goals, manufacturers can enhance customer loyalty and increase the lifetime value of their consumers in an age of frequent brand-switching.
Trend: Smart Brewing and Material Innovation
Advancements in Freshness and Extraction
In 2026, the tea capsule experience is being transformed by major advancements in material science and extraction methods. Producers are using improved sealing materials and multi-layer capsule designs that offer better barriers against oxygen and moisture. This keeps delicate tea leaves fresh far longer than standard packaging does. Additionally, new capsule shapes are designed to enhance water flow, ensuring that black, green, and herbal teas are extracted at their best pressure and saturation levels.
The Integration of Smart Appliances
The Internet of Things (IoT) has made its way into tea brewing, with the newest brewing systems offering full mobile connectivity. These smart devices let users adjust brewing temperatures and steeping times through smartphone apps, preventing delicate white tea from being ruined by boiling water. This push toward automation and precision not only enhances user satisfaction but also leads to hardware upgrades. As these connected systems become common, they provide manufacturers with valuable insights into consumer habits, enabling more focused marketing and product development.
Recent Developments
Dec 2024 – Nestlé Nespresso: Nespresso launched a new tea capsule portfolio under the “Nespresso Tea Collection” brand in Europe and Asia, with an initial lineup of 12 blends and an investment reported at around USD 40 million in product development and marketing. This move strengthens its position in the premium single-serve segment and intensifies competition for high-value urban consumers.
Feb 2025 – Tata Consumer Products: Tata Consumer Products announced a strategic partnership with a leading capsule machine manufacturer in India to co-brand tea capsule starter kits targeted at metropolitan households, aiming to reach 1 million households by 2027. The collaboration expands its distribution reach in Asia Pacific and accelerates machine-led tea consumption in a fast-growing market.
Apr 2025 – Unilever (Lipton): Unilever extended its Lipton-branded tea capsules into North America through leading supermarket chains and online marketplaces, covering more than 8,000 retail points and targeting incremental annual sales of USD 60 million. The expansion strengthens Lipton’s global footprint in single-serve formats and increases pressure on regional brands in the mid-price segment.
Jul 2025 – Keurig Dr Pepper: Keurig Dr Pepper introduced an upgraded brewing platform with enhanced tea extraction profiles and compatible capsules focused on herbal, green, and wellness blends, aiming for a 20 percent increase in tea capsule usage per installed machine. This technology push reinforces Keurig’s ecosystem strategy and locks in higher recurring capsule revenue across North America and selected European markets.
Sep 2025 – Twinings: Twinings opened a dedicated tea capsule production line in Poland with an annual capacity of 500 million capsules and a capital expenditure of approximately USD 55 million, focused on supplying Europe and the Middle East. The capacity expansion lowers production costs per unit and supports faster response to flavor trends and private-label contracts in regional markets.