Temperature Data-Loggers Market Size, Share & Forecast | 5.5% CAGR
Global Temperature Data-loggers Market Size, Share & Analysis By Type (Single Use, Reusable), By Product Type (USB, Thermocouple, RTD, Wireless, Thermistor), By End-User Industry (Healthcare and Life Sciences, Food and Beverage, Manufacturing, Agriculture, Logistics), Industry Regions & Key Players – Monitoring Trends & Forecast 2025–2034
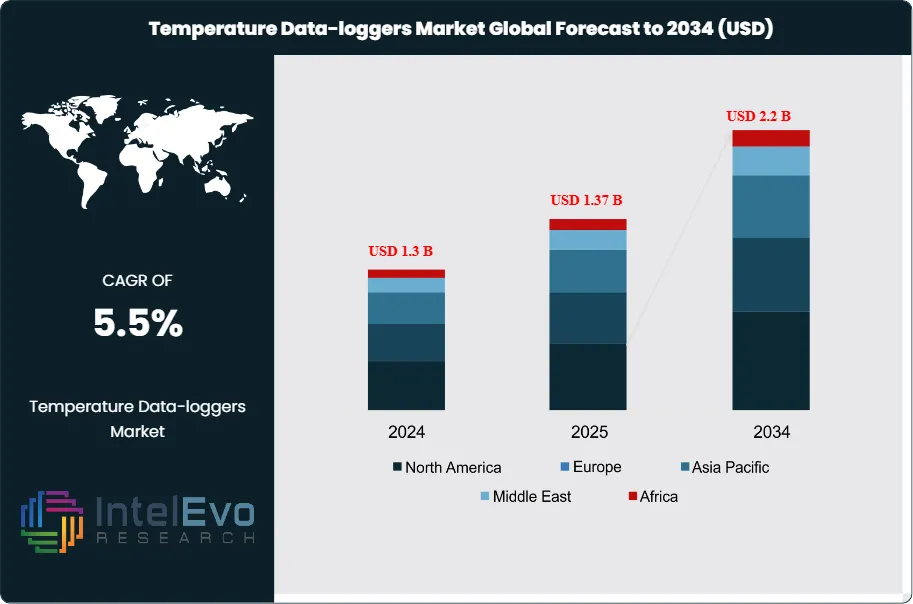
The Temperature Data-loggers Market, valued at USD 1.3 billion in 2024, is projected to reach USD 2.2 billion by 2034, expanding at a CAGR of 5.5% from 2025 to 2034, driven by stricter food safety and pharmaceutical compliance requirements, offering strategic opportunities for technology providers, logistics operators, and cold-chain stakeholders.
Temperature data-loggers play a pivotal role in monitoring and recording temperature variations across critical industries, ensuring regulatory compliance, product integrity, and operational efficiency. Their adoption has become increasingly vital in sectors such as pharmaceuticals, food and beverage, biotechnology, and transportation, where even minor temperature deviations can compromise product quality and safety. Rising global emphasis on cold chain logistics, particularly in vaccine distribution and perishable food exports, has further accelerated demand for reliable monitoring systems.
Market growth is fueled by several key drivers. Regulatory authorities such as the FDA, USDA, and WHO continue to enforce stringent guidelines to mitigate risks associated with foodborne illnesses and pharmaceutical spoilage, directly boosting the adoption of advanced temperature monitoring solutions. Additionally, the globalization of supply chains has increased the complexity of storage and transportation networks, creating a greater need for continuous, accurate, and tamper-proof data-logging systems. However, challenges such as high deployment costs in developing markets and data security concerns associated with cloud-enabled devices may limit adoption in certain regions.
Technological advancements are reshaping the competitive landscape. Modern data-loggers now integrate IoT connectivity, cloud storage, real-time alerts, and enhanced data accuracy, enabling proactive decision-making and predictive maintenance. The transition from traditional manual logging systems to automated, smart devices is helping businesses minimize losses, reduce compliance risks, and optimize logistics performance. These innovations are particularly valuable for pharmaceuticals, where maintaining strict temperature thresholds is critical for vaccine efficacy and biologic stability.
Regionally, North America and Europe lead the market due to stringent regulatory frameworks, advanced cold-chain infrastructure, and early adoption of digital monitoring technologies. Meanwhile, Asia-Pacific is emerging as a high-growth region, supported by rising pharmaceutical manufacturing, increasing exports of perishable goods, and rapid investment in cold-chain logistics. Latin America and the Middle East are also witnessing growing adoption, driven by expanding trade flows and greater emphasis on food safety.
Overall, the temperature data-loggers market is poised for steady expansion as industries increasingly prioritize safety, compliance, and real-time visibility in supply chain operations.
Market Growth: The Global Temperature Data-loggers Market is projected to expand from USD 1.3 billion in 2024 to USD 2.2 billion by 2034, advancing at a CAGR of 5.5%. Growth is underpinned by stricter regulatory compliance in food safety and pharmaceuticals, alongside rising demand for cold-chain monitoring.
Type: Reusable temperature data-loggers account for 63.4% of the market, favored for their cost-effectiveness and durability in long-term monitoring applications, particularly in logistics and healthcare supply chains.
Product Type: Thermocouple-based data-loggers lead with 26.3% market share, supported by their broad temperature range, high precision, and suitability for diverse industrial applications, including biopharma and food storage.
End Use: The healthcare and life sciences sector represents 31.2% of market demand, driven by stringent regulatory frameworks for vaccines, biologics, and sensitive pharmaceuticals requiring continuous temperature tracking.
Driver: Increasing global trade of perishable goods and vaccines is fueling investments in advanced data-loggers, with real-time monitoring solutions becoming standard across cold-chain logistics operations.
Restraint: High initial costs of advanced data-logging systems and limited adoption in cost-sensitive emerging markets continue to restrain wider deployment.
Opportunity: Integration of IoT, cloud analytics, and wireless connectivity in data-loggers presents high growth potential, enabling predictive insights and proactive interventions in supply chain management.
Trend: Rising adoption of smart, connected data-loggers with real-time alerts and automated reporting is transforming compliance management, reducing spoilage risks, and enhancing operational efficiency.
Regional Analysis: North America leads with 38.6% share, supported by advanced cold-chain infrastructure and stringent FDA/USDA guidelines. Europe, holding 29.8%, is emerging as a high-growth region due to rising pharmaceutical production and strong food export markets, while Asia-Pacific shows accelerating adoption fueled by expanding logistics and healthcare sectors.
Type Analysis
The temperature data-loggers market is primarily segmented into single-use and reusable devices, with reusable models commanding a clear lead. In 2025, reusable loggers represent over 63% of the global market, a dominance reinforced by their long lifecycle, cost efficiency, and ability to withstand demanding operating conditions. These devices are widely adopted across industries requiring long-term monitoring, such as pharmaceuticals, food transportation, and biotechnology, where continuous and accurate data collection is critical for compliance and product integrity. Their programmable nature and durability make them a preferred choice for enterprises seeking scalable, reliable monitoring solutions.
Single-use data-loggers, while less prevalent, continue to play a crucial role in time-sensitive and one-way logistics operations. These devices are especially valuable for the shipment of pharmaceuticals, clinical trial samples, and perishable goods where recovery of the device is impractical or uneconomical. Though positioned as a secondary segment, demand for disposable loggers is sustained by the rising complexity of global supply chains and the growing focus on preventing temperature-related spoilage. Collectively, both categories highlight the market’s versatility in addressing diverse operational needs across industries.
Product Type Analysis
By product type, thermocouple-based data-loggers remain the largest segment, accounting for approximately 26% of market share in 2025. Their popularity stems from exceptional accuracy, broad temperature range coverage, and fast response times, making them suitable for extreme industrial environments such as metal processing, chemical manufacturing, and heat treatment. These features enable thermocouples to meet stringent performance requirements in mission-critical applications where precision is non-negotiable.
Other product categories collectively contribute to market diversity. USB loggers are widely used for their ease of deployment and direct data retrieval, while RTD loggers are favored for stability and accuracy in moderate temperature ranges, particularly in healthcare and life sciences. Wireless devices, increasingly integrated with IoT ecosystems, provide remote monitoring capabilities essential for modern logistics and cold-chain management. Thermistors, though limited to narrower ranges, offer high accuracy for specialized applications. The presence of these varied product types reflects ongoing technological innovation, ensuring that the market continues to meet the specialized needs of both traditional industries and emerging digital supply chains.
End-User Industry Analysis
The healthcare and life sciences industry leads end-user adoption, representing over 31% of global revenue in 2025. This dominance is driven by stringent regulatory frameworks and the critical importance of temperature stability in pharmaceuticals, vaccines, and biologics. With the expansion of biologic therapies, global vaccination programs, and clinical research, reliable data-logging solutions have become indispensable for safeguarding product efficacy and patient safety. The sector’s heavy investment in automated, connected monitoring systems continues to fuel demand.
Beyond healthcare, adoption is broadening across food and beverage, logistics, manufacturing, and agriculture. The food sector relies on data-loggers to maintain safety and freshness across cold-chain networks, while logistics providers use them to ensure real-time visibility and compliance with international shipping standards. Manufacturers deploy these tools for process optimization and equipment monitoring, whereas agriculture uses them to manage environmental conditions for crops and livestock. This multi-industry reliance underscores the cross-sectoral importance of data-loggers as a backbone for quality assurance and regulatory compliance.
Regional Analysis
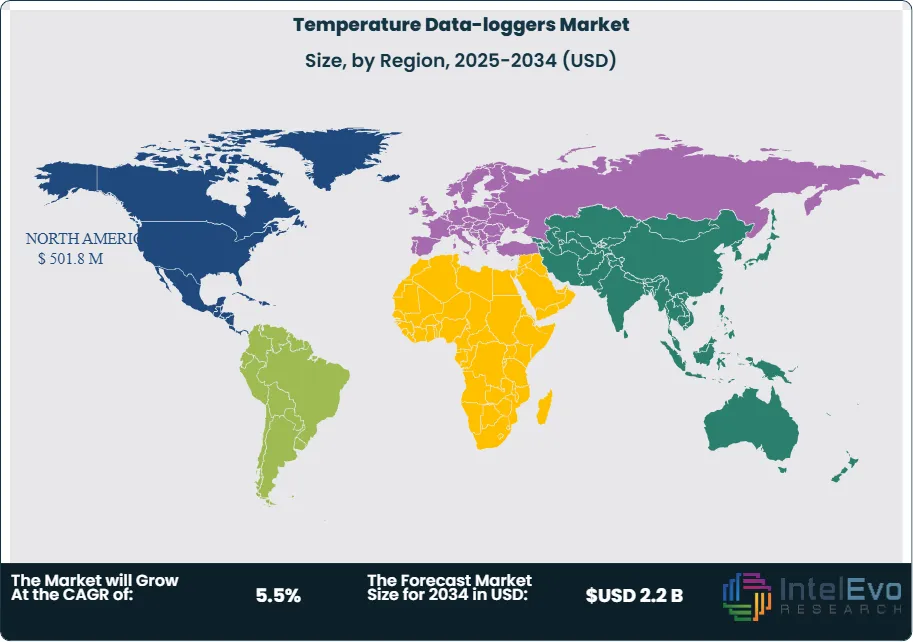
North America continues to dominate the global temperature data-loggers market in 2025, holding a 38.6% share. The region’s leadership is supported by robust healthcare infrastructure, strict FDA and USDA regulations, and advanced adoption of IoT- and cloud-enabled monitoring technologies. The strong presence of industry leaders such as Sensitech, Dickson, and Berlinger further strengthens the region’s competitive edge. High awareness of food safety and pharmaceutical quality control, combined with well-developed cold-chain logistics, drives sustained investment in monitoring technologies.
Europe follows closely, supported by the region’s expanding pharmaceutical manufacturing base and rising demand for perishable food exports. Stringent EU compliance standards reinforce adoption across healthcare, food safety, and logistics operations. Meanwhile, Asia-Pacific is emerging as a high-growth region, underpinned by expanding pharmaceutical exports from India and China, rising cold-chain investments in Southeast Asia, and the scaling of agricultural exports. Latin America and the Middle East also present increasing opportunities as global trade flows intensify and governments strengthen food safety and healthcare regulations. Collectively, these regional dynamics highlight a balanced mix of mature markets and emerging growth hubs, setting the stage for steady global expansion.
By Type (Single Use, Reusable), By Product Type (USB, Thermocouple, RTD, Wireless, Thermistor, Others), By End-User Industry (Healthcare and Life Sciences, Food and Beverage, Manufacturing, Agriculture, Logistics, Others)
Research Methodology
Primary Research- 100 Interviews of Stakeholders
Secondary Research
Desk Research
Regional scope
North America (United States, Canada, Mexico)
Latin America (Brazil, Argentina, Columbia)
East Asia And Pacific (China, Japan, South Korea, Australia, Cambodia, Fiji, Indonesia)
Sea And South Asia (India, Singapore, Thailand, Taiwan, Malaysia)
Eastern Europe (Poland, Russia, Czech Republic, Romania)
Western Europe (Germany, U.K., France, Spain, Itlay)
Middle East & Africa (GCC Countries, Egypt, Nigeria, South Africa, Israel)
Competitive Landscape
MadgeTech Inc., Rotronic AG, Cryopak, Onset Computer Corporation, TMI-Orion SA, Thermoworks Inc., NOVUS Automation Inc., Protimeter, Hioki EE Corporation, Softbox Systems Limited, Elpro-Buchs AG, Global Cold Chain Solutions Pty Limited, OMEGA Engineering Inc., Kimo Instruments, Testo SE & Co. KGaA, Lascar Electronics Limited
Customization Scope
Customization for segments, region/country-level will be provided. Moreover, additional customization can be done based on the requirements.
Pricing and Purchase Options
Avail customized purchase options to meet your exact research needs. We have three licenses to opt for: Single User License, Multi-User License (Up to 5 Users), Corporate Use License (Unlimited User and Printable PDF).
TABLE OF CONTENTS
1. EXECUTIVE SUMMARY
1.1. MARKET SNAPSHOT
1.2. KEY FINDINGS & INSIGHTS
1.3. ANALYST RECOMMENDATIONS
1.4. FUTURE OUTLOOK
2. RESEARCH METHODOLOGY
2.1. MARKET DEFINITION & SCOPE
2.2. RESEARCH OBJECTIVES: PRIMARY & SECONDARY DATA SOURCES
2.3. DATA COLLECTION SOURCES
2.3.1. COVERAGE OF 100+ PRIMARY RESEARCH/CONSULTATION CALLS WITH INDUSTRY STAKEHOLDERS
FIGURE 17 NORTH AMERICA TEMPERATURE DATA-LOGGERS CURRENT AND FUTURE TYPE ANALYSIS, 2025–2034, (USD MILLION)
FIGURE 18 NORTH AMERICA TEMPERATURE DATA-LOGGERS CURRENT AND FUTURE END-USER INDUSTRY ANALYSIS, 2025–2034, (USD MILLION)
FIGURE 19 MARKET SHARE BY COUNTRY
FIGURE 20 LATIN AMERICA TEMPERATURE DATA-LOGGERS CURRENT AND FUTURE TYPE ANALYSIS, 2025–2034, (USD MILLION)
FIGURE 21 LATIN AMERICA TEMPERATURE DATA-LOGGERS CURRENT AND FUTURE END-USER INDUSTRY ANALYSIS, 2025–2034, (USD MILLION)
FIGURE 22 MARKET SHARE BY COUNTRY
FIGURE 23 EASTERN EUROPE TEMPERATURE DATA-LOGGERS CURRENT AND FUTURE TYPE ANALYSIS, 2025–2034, (USD MILLION)
FIGURE 24 EASTERN EUROPE TEMPERATURE DATA-LOGGERS CURRENT AND FUTURE END-USER INDUSTRY ANALYSIS, 2025–2034, (USD MILLION)
FIGURE 25 MARKET SHARE BY COUNTRY
FIGURE 26 WESTERN EUROPE TEMPERATURE DATA-LOGGERS CURRENT AND FUTURE TYPE ANALYSIS, 2025–2034, (USD MILLION)
FIGURE 27 WESTERN EUROPE TEMPERATURE DATA-LOGGERS CURRENT AND FUTURE END-USER INDUSTRY ANALYSIS, 2025–2034, (USD MILLION)
FIGURE 28 MARKET SHARE BY COUNTRY
FIGURE 29 EAST ASIA AND PACIFIC TEMPERATURE DATA-LOGGERS CURRENT AND FUTURE TYPE ANALYSIS, 2025–2034, (USD MILLION)
FIGURE 30 EAST ASIA AND PACIFIC TEMPERATURE DATA-LOGGERS CURRENT AND FUTURE END-USER INDUSTRY ANALYSIS, 2025–2034, (USD MILLION)
FIGURE 31 MARKET SHARE BY COUNTRY
FIGURE 32 SEA AND SOUTH ASIA TEMPERATURE DATA-LOGGERS CURRENT AND FUTURE TYPE ANALYSIS, 2025–2034, (USD MILLION)
FIGURE 33 SEA AND SOUTH ASIA TEMPERATURE DATA-LOGGERS CURRENT AND FUTURE END-USER INDUSTRY ANALYSIS, 2025–2034, (USD MILLION)
FIGURE 34 MARKET SHARE BY COUNTRY
FIGURE 35 MIDDLE EAST AND AFRICA TEMPERATURE DATA-LOGGERS CURRENT AND FUTURE TYPE ANALYSIS, 2025–2034, (USD MILLION)
FIGURE 36 MIDDLE EAST AND AFRICA TEMPERATURE DATA-LOGGERS CURRENT AND FUTURE END-USER INDUSTRY ANALYSIS, 2025–2034, (USD MILLION)
FIGURE 37 NORTH AMERICA TEMPERATURE DATA-LOGGERS CURRENT AND FUTURE MARKET VOLUME SHARE REGIONAL ANALYSIS, 2025–2034, (USD MILLION)
FIGURE 38 U.S. TEMPERATURE DATA-LOGGERS CURRENT AND FUTURE TYPE ANALYSIS, 2025–2034, (USD MILLION)
FIGURE 39 U.S. TEMPERATURE DATA-LOGGERS CURRENT AND FUTURE END-USER INDUSTRY ANALYSIS, 2025–2034, (USD MILLION)
FIGURE 40 CANADA TEMPERATURE DATA-LOGGERS CURRENT AND FUTURE TYPE ANALYSIS, 2025–2034, (USD MILLION)
FIGURE 41 CANADA TEMPERATURE DATA-LOGGERS CURRENT AND FUTURE END-USER INDUSTRY ANALYSIS, 2025–2034, (USD MILLION)
FIGURE 42 LATIN AMERICA TEMPERATURE DATA-LOGGERS CURRENT AND FUTURE MARKET VOLUME SHARE REGIONAL ANALYSIS, 2025–2034, (USD MILLION)
FIGURE 43 MEXICO TEMPERATURE DATA-LOGGERS CURRENT AND FUTURE TYPE ANALYSIS, 2025–2034, (USD MILLION)
FIGURE 44 MEXICO TEMPERATURE DATA-LOGGERS CURRENT AND FUTURE END-USER INDUSTRY ANALYSIS, 2025–2034, (USD MILLION)
FIGURE 45 BRAZIL TEMPERATURE DATA-LOGGERS CURRENT AND FUTURE TYPE ANALYSIS, 2025–2034, (USD MILLION)
FIGURE 46 BRAZIL TEMPERATURE DATA-LOGGERS CURRENT AND FUTURE END-USER INDUSTRY ANALYSIS, 2025–2034, (USD MILLION)
FIGURE 47 ARGENTINA TEMPERATURE DATA-LOGGERS CURRENT AND FUTURE TYPE ANALYSIS, 2025–2034, (USD MILLION)
FIGURE 48 ARGENTINA TEMPERATURE DATA-LOGGERS CURRENT AND FUTURE END-USER INDUSTRY ANALYSIS, 2025–2034, (USD MILLION)
FIGURE 49 COLUMBIA TEMPERATURE DATA-LOGGERS CURRENT AND FUTURE TYPE ANALYSIS, 2025–2034, (USD MILLION)
FIGURE 50 COLUMBIA TEMPERATURE DATA-LOGGERS CURRENT AND FUTURE END-USER INDUSTRY ANALYSIS, 2025–2034, (USD MILLION)
FIGURE 51 REST OF LATIN AMERICA TEMPERATURE DATA-LOGGERS CURRENT AND FUTURE TYPE ANALYSIS, 2025–2034, (USD MILLION)
FIGURE 52 REST OF LATIN AMERICA TEMPERATURE DATA-LOGGERS CURRENT AND FUTURE END-USER INDUSTRY ANALYSIS, 2025–2034, (USD MILLION)
FIGURE 53 EASTERN EUROPE TEMPERATURE DATA-LOGGERS CURRENT AND FUTURE MARKET VOLUME SHARE REGIONAL ANALYSIS, 2025–2034, (USD MILLION)
FIGURE 54 POLAND TEMPERATURE DATA-LOGGERS CURRENT AND FUTURE TYPE ANALYSIS, 2025–2034, (USD MILLION)
FIGURE 55 POLAND TEMPERATURE DATA-LOGGERS CURRENT AND FUTURE END-USER INDUSTRY ANALYSIS, 2025–2034, (USD MILLION)
FIGURE 56 RUSSIA TEMPERATURE DATA-LOGGERS CURRENT AND FUTURE TYPE ANALYSIS, 2025–2034, (USD MILLION)
FIGURE 57 RUSSIA TEMPERATURE DATA-LOGGERS CURRENT AND FUTURE END-USER INDUSTRY ANALYSIS, 2025–2034, (USD MILLION)
FIGURE 58 CZECH REPUBLIC TEMPERATURE DATA-LOGGERS CURRENT AND FUTURE TYPE ANALYSIS, 2025–2034, (USD MILLION)
FIGURE 59 CZECH REPUBLIC TEMPERATURE DATA-LOGGERS CURRENT AND FUTURE END-USER INDUSTRY ANALYSIS, 2025–2034, (USD MILLION)
FIGURE 60 ROMANIA TEMPERATURE DATA-LOGGERS CURRENT AND FUTURE TYPE ANALYSIS, 2025–2034, (USD MILLION)
FIGURE 61 ROMANIA TEMPERATURE DATA-LOGGERS CURRENT AND FUTURE END-USER INDUSTRY ANALYSIS, 2025–2034, (USD MILLION)
FIGURE 62 REST OF EASTERN EUROPE TEMPERATURE DATA-LOGGERS CURRENT AND FUTURE TYPE ANALYSIS, 2025–2034, (USD MILLION)
FIGURE 63 REST OF EASTERN EUROPE TEMPERATURE DATA-LOGGERS CURRENT AND FUTURE END-USER INDUSTRY ANALYSIS, 2025–2034, (USD MILLION)
FIGURE 64 WESTERN EUROPE TEMPERATURE DATA-LOGGERS CURRENT AND FUTURE MARKET VOLUME SHARE REGIONAL ANALYSIS, 2025–2034, (USD MILLION)
FIGURE 65 GERMANY TEMPERATURE DATA-LOGGERS CURRENT AND FUTURE TYPE ANALYSIS, 2025–2034, (USD MILLION)
FIGURE 66 GERMANY TEMPERATURE DATA-LOGGERS CURRENT AND FUTURE END-USER INDUSTRY ANALYSIS, 2025–2034, (USD MILLION)
FIGURE 67 FRANCE TEMPERATURE DATA-LOGGERS CURRENT AND FUTURE TYPE ANALYSIS, 2025–2034, (USD MILLION)
FIGURE 68 FRANCE TEMPERATURE DATA-LOGGERS CURRENT AND FUTURE END-USER INDUSTRY ANALYSIS, 2025–2034, (USD MILLION)
FIGURE 69 UK TEMPERATURE DATA-LOGGERS CURRENT AND FUTURE TYPE ANALYSIS, 2025–2034, (USD MILLION)
FIGURE 70 UK TEMPERATURE DATA-LOGGERS CURRENT AND FUTURE END-USER INDUSTRY ANALYSIS, 2025–2034, (USD MILLION)
FIGURE 71 SPAIN TEMPERATURE DATA-LOGGERS CURRENT AND FUTURE TYPE ANALYSIS, 2025–2034, (USD MILLION)
FIGURE 72 SPAIN TEMPERATURE DATA-LOGGERS CURRENT AND FUTURE END-USER INDUSTRY ANALYSIS, 2025–2034, (USD MILLION)
FIGURE 73 ITALY TEMPERATURE DATA-LOGGERS CURRENT AND FUTURE TYPE ANALYSIS, 2025–2034, (USD MILLION)
FIGURE 74 ITALY TEMPERATURE DATA-LOGGERS CURRENT AND FUTURE END-USER INDUSTRY ANALYSIS, 2025–2034, (USD MILLION)
FIGURE 75 REST OF WESTERN EUROPE TEMPERATURE DATA-LOGGERS CURRENT AND FUTURE TYPE ANALYSIS, 2025–2034, (USD MILLION)
FIGURE 76 REST OF WESTERN EUROPE TEMPERATURE DATA-LOGGERS CURRENT AND FUTURE END-USER INDUSTRY ANALYSIS, 2025–2034, (USD MILLION)
FIGURE 77 EAST ASIA AND PACIFIC TEMPERATURE DATA-LOGGERS CURRENT AND FUTURE MARKET VOLUME SHARE REGIONAL ANALYSIS, 2025–2034, (USD MILLION)
FIGURE 78 CHINA TEMPERATURE DATA-LOGGERS CURRENT AND FUTURE TYPE ANALYSIS, 2025–2034, (USD MILLION)
FIGURE 79 CHINA TEMPERATURE DATA-LOGGERS CURRENT AND FUTURE END-USER INDUSTRY ANALYSIS, 2025–2034, (USD MILLION)
FIGURE 80 JAPAN TEMPERATURE DATA-LOGGERS CURRENT AND FUTURE TYPE ANALYSIS, 2025–2034, (USD MILLION)
FIGURE 81 JAPAN TEMPERATURE DATA-LOGGERS CURRENT AND FUTURE END-USER INDUSTRY ANALYSIS, 2025–2034, (USD MILLION)
FIGURE 82 AUSTRALIA TEMPERATURE DATA-LOGGERS CURRENT AND FUTURE TYPE ANALYSIS, 2025–2034, (USD MILLION)
FIGURE 83 AUSTRALIA TEMPERATURE DATA-LOGGERS CURRENT AND FUTURE END-USER INDUSTRY ANALYSIS, 2025–2034, (USD MILLION)
FIGURE 84 CAMBODIA TEMPERATURE DATA-LOGGERS CURRENT AND FUTURE TYPE ANALYSIS, 2025–2034, (USD MILLION)
FIGURE 85 CAMBODIA TEMPERATURE DATA-LOGGERS CURRENT AND FUTURE END-USER INDUSTRY ANALYSIS, 2025–2034, (USD MILLION)
FIGURE 86 FIJI TEMPERATURE DATA-LOGGERS CURRENT AND FUTURE TYPE ANALYSIS, 2025–2034, (USD MILLION)
FIGURE 87 FIJI TEMPERATURE DATA-LOGGERS CURRENT AND FUTURE END-USER INDUSTRY ANALYSIS, 2025–2034, (USD MILLION)
FIGURE 88 INDONESIA TEMPERATURE DATA-LOGGERS CURRENT AND FUTURE TYPE ANALYSIS, 2025–2034, (USD MILLION)
FIGURE 89 INDONESIA TEMPERATURE DATA-LOGGERS CURRENT AND FUTURE END-USER INDUSTRY ANALYSIS, 2025–2034, (USD MILLION)
FIGURE 90 SOUTH KOREA TEMPERATURE DATA-LOGGERS CURRENT AND FUTURE TYPE ANALYSIS, 2025–2034, (USD MILLION)
FIGURE 91 SOUTH KOREA TEMPERATURE DATA-LOGGERS CURRENT AND FUTURE END-USER INDUSTRY ANALYSIS, 2025–2034, (USD MILLION)
FIGURE 92 REST OF EAST ASIA AND PACIFIC TEMPERATURE DATA-LOGGERS CURRENT AND FUTURE TYPE ANALYSIS, 2025–2034, (USD MILLION)
FIGURE 93 REST OF EAST ASIA AND PACIFIC TEMPERATURE DATA-LOGGERS CURRENT AND FUTURE END-USER INDUSTRY ANALYSIS, 2025–2034, (USD MILLION)
FIGURE 94 SEA AND SOUTH ASIA TEMPERATURE DATA-LOGGERS CURRENT AND FUTURE MARKET VOLUME SHARE REGIONAL ANALYSIS, 2025–2034, (USD MILLION)
FIGURE 95 BANGLADESH TEMPERATURE DATA-LOGGERS CURRENT AND FUTURE TYPE ANALYSIS, 2025–2034, (USD MILLION)
FIGURE 96 BANGLADESH TEMPERATURE DATA-LOGGERS CURRENT AND FUTURE END-USER INDUSTRY ANALYSIS, 2025–2034, (USD MILLION)
FIGURE 97 NEW ZEALAND TEMPERATURE DATA-LOGGERS CURRENT AND FUTURE TYPE ANALYSIS, 2025–2034, (USD MILLION)
FIGURE 98 NEW ZEALAND TEMPERATURE DATA-LOGGERS CURRENT AND FUTURE END-USER INDUSTRY ANALYSIS, 2025–2034, (USD MILLION)
FIGURE 99 INDIA TEMPERATURE DATA-LOGGERS CURRENT AND FUTURE TYPE ANALYSIS, 2025–2034, (USD MILLION)
FIGURE 100 INDIA TEMPERATURE DATA-LOGGERS CURRENT AND FUTURE END-USER INDUSTRY ANALYSIS, 2025–2034, (USD MILLION)
FIGURE 101 SINGAPORE TEMPERATURE DATA-LOGGERS CURRENT AND FUTURE TYPE ANALYSIS, 2025–2034, (USD MILLION)
FIGURE 102 SINGAPORE TEMPERATURE DATA-LOGGERS CURRENT AND FUTURE END-USER INDUSTRY ANALYSIS, 2025–2034, (USD MILLION)
FIGURE 103 THAILAND TEMPERATURE DATA-LOGGERS CURRENT AND FUTURE TYPE ANALYSIS, 2025–2034, (USD MILLION)
FIGURE 104 THAILAND TEMPERATURE DATA-LOGGERS CURRENT AND FUTURE END-USER INDUSTRY ANALYSIS, 2025–2034, (USD MILLION)
FIGURE 105 TAIWAN TEMPERATURE DATA-LOGGERS CURRENT AND FUTURE TYPE ANALYSIS, 2025–2034, (USD MILLION)
FIGURE 106 TAIWAN TEMPERATURE DATA-LOGGERS CURRENT AND FUTURE END-USER INDUSTRY ANALYSIS, 2025–2034, (USD MILLION)
FIGURE 107 MALAYSIA TEMPERATURE DATA-LOGGERS CURRENT AND FUTURE TYPE ANALYSIS, 2025–2034, (USD MILLION)
FIGURE 108 MALAYSIA TEMPERATURE DATA-LOGGERS CURRENT AND FUTURE END-USER INDUSTRY ANALYSIS, 2025–2034, (USD MILLION)
FIGURE 109 REST OF SEA AND SOUTH ASIA TEMPERATURE DATA-LOGGERS CURRENT AND FUTURE TYPE ANALYSIS, 2025–2034, (USD MILLION)
FIGURE 110 REST OF SEA AND SOUTH ASIA TEMPERATURE DATA-LOGGERS CURRENT AND FUTURE END-USER INDUSTRY ANALYSIS, 2025–2034, (USD MILLION)
FIGURE 111 MIDDLE EAST AND AFRICA TEMPERATURE DATA-LOGGERS CURRENT AND FUTURE MARKET VOLUME SHARE REGIONAL ANALYSIS, 2025–2034, (USD MILLION)
FIGURE 112 GCC COUNTRIES TEMPERATURE DATA-LOGGERS CURRENT AND FUTURE TYPE ANALYSIS, 2025–2034, (USD MILLION)
FIGURE 113 GCC COUNTRIES TEMPERATURE DATA-LOGGERS CURRENT AND FUTURE END-USER INDUSTRY ANALYSIS, 2025–2034, (USD MILLION)
FIGURE 114 SAUDI ARABIA TEMPERATURE DATA-LOGGERS CURRENT AND FUTURE TYPE ANALYSIS, 2025–2034, (USD MILLION)
FIGURE 115 SAUDI ARABIA TEMPERATURE DATA-LOGGERS CURRENT AND FUTURE END-USER INDUSTRY ANALYSIS, 2025–2034, (USD MILLION)
FIGURE 116 UAE TEMPERATURE DATA-LOGGERS CURRENT AND FUTURE TYPE ANALYSIS, 2025–2034, (USD MILLION)
FIGURE 117 UAE TEMPERATURE DATA-LOGGERS CURRENT AND FUTURE END-USER INDUSTRY ANALYSIS, 2025–2034, (USD MILLION)
FIGURE 118 BAHRAIN TEMPERATURE DATA-LOGGERS CURRENT AND FUTURE TYPE ANALYSIS, 2025–2034, (USD MILLION)
FIGURE 119 BAHRAIN TEMPERATURE DATA-LOGGERS CURRENT AND FUTURE END-USER INDUSTRY ANALYSIS, 2025–2034, (USD MILLION)
FIGURE 120 KUWAIT TEMPERATURE DATA-LOGGERS CURRENT AND FUTURE TYPE ANALYSIS, 2025–2034, (USD MILLION)
FIGURE 121 KUWAIT TEMPERATURE DATA-LOGGERS CURRENT AND FUTURE END-USER INDUSTRY ANALYSIS, 2025–2034, (USD MILLION)
FIGURE 122 OMAN TEMPERATURE DATA-LOGGERS CURRENT AND FUTURE TYPE ANALYSIS, 2025–2034, (USD MILLION)
FIGURE 123 OMAN TEMPERATURE DATA-LOGGERS CURRENT AND FUTURE END-USER INDUSTRY ANALYSIS, 2025–2034, (USD MILLION)
FIGURE 124 QATAR TEMPERATURE DATA-LOGGERS CURRENT AND FUTURE TYPE ANALYSIS, 2025–2034, (USD MILLION)
FIGURE 125 QATAR TEMPERATURE DATA-LOGGERS CURRENT AND FUTURE END-USER INDUSTRY ANALYSIS, 2025–2034, (USD MILLION)
FIGURE 126 EGYPT TEMPERATURE DATA-LOGGERS CURRENT AND FUTURE TYPE ANALYSIS, 2025–2034, (USD MILLION)
FIGURE 127 EGYPT TEMPERATURE DATA-LOGGERS CURRENT AND FUTURE END-USER INDUSTRY ANALYSIS, 2025–2034, (USD MILLION)
FIGURE 128 NIGERIA TEMPERATURE DATA-LOGGERS CURRENT AND FUTURE TYPE ANALYSIS, 2025–2034, (USD MILLION)
FIGURE 129 NIGERIA TEMPERATURE DATA-LOGGERS CURRENT AND FUTURE END-USER INDUSTRY ANALYSIS, 2025–2034, (USD MILLION)
FIGURE 130 SOUTH AFRICA TEMPERATURE DATA-LOGGERS CURRENT AND FUTURE TYPE ANALYSIS, 2025–2034, (USD MILLION)
FIGURE 131 SOUTH AFRICA TEMPERATURE DATA-LOGGERS CURRENT AND FUTURE END-USER INDUSTRY ANALYSIS, 2025–2034, (USD MILLION)
FIGURE 132 ISRAEL TEMPERATURE DATA-LOGGERS CURRENT AND FUTURE TYPE ANALYSIS, 2025–2034, (USD MILLION)
FIGURE 133 ISRAEL TEMPERATURE DATA-LOGGERS CURRENT AND FUTURE END-USER INDUSTRY ANALYSIS, 2025–2034, (USD MILLION)
FIGURE 134 REST OF MEA TEMPERATURE DATA-LOGGERS CURRENT AND FUTURE TYPE ANALYSIS, 2025–2034, (USD MILLION)
FIGURE 135 REST OF MEA TEMPERATURE DATA-LOGGERS CURRENT AND FUTURE END-USER INDUSTRY ANALYSIS, 2025–2034, (USD MILLION)
FIGURE 136 U. S. MARKET SHARE ANALYSIS BY TYPE (2024)
FIGURE 137 U. S. MARKET SHARE ANALYSIS BY END-USER INDUSTRY (2024)
FIGURE 138 CANADA MARKET SHARE ANALYSIS BY TYPE (2024)
FIGURE 139 CANADA MARKET SHARE ANALYSIS BY END-USER INDUSTRY (2024)
FIGURE 140 MEXICO MARKET SHARE ANALYSIS BY TYPE (2024)
FIGURE 141 MEXICO MARKET SHARE ANALYSIS BY END-USER INDUSTRY (2024)
FIGURE 142 CHINA MARKET SHARE ANALYSIS BY TYPE (2024)
FIGURE 143 CHINA MARKET SHARE ANALYSIS BY END-USER INDUSTRY (2024)
FIGURE 144 JAPAN MARKET SHARE ANALYSIS BY TYPE (2024)
FIGURE 145 JAPAN MARKET SHARE ANALYSIS BY END-USER INDUSTRY (2024)
FIGURE 146 INDIA MARKET SHARE ANALYSIS BY TYPE (2024)
FIGURE 147 INDIA MARKET SHARE ANALYSIS BY END-USER INDUSTRY (2024)
FIGURE 148 SOUTH KOREA MARKET SHARE ANALYSIS BY TYPE (2024)
FIGURE 149 SOUTH KOREA MARKET SHARE ANALYSIS BY END-USER INDUSTRY (2024)
FIGURE 150 SAUDI ARABIA MARKET SHARE ANALYSIS BY TYPE (2024)
FIGURE 151 SAUDI ARABIA MARKET SHARE ANALYSIS BY END-USER INDUSTRY (2024)
FIGURE 152 UAE MARKET SHARE ANALYSIS BY TYPE (2024)
FIGURE 153 UAE MARKET SHARE ANALYSIS BY END-USER INDUSTRY (2024)
FIGURE 154 EGYPT MARKET SHARE ANALYSIS BY TYPE (2024)
FIGURE 155 EGYPT MARKET SHARE ANALYSIS BY END-USER INDUSTRY (2024)
FIGURE 156 NIGERIA MARKET SHARE ANALYSIS BY TYPE (2024)
FIGURE 157 NIGERIA MARKET SHARE ANALYSIS BY END-USER INDUSTRY (2024)
FIGURE 158 SOUTH AFRICA MARKET SHARE ANALYSIS BY TYPE (2024)
FIGURE 159 SOUTH AFRICA MARKET SHARE ANALYSIS BY END-USER INDUSTRY (2024)
FIGURE 160 GERMANY MARKET SHARE ANALYSIS BY TYPE (2024)
FIGURE 161 GERMANY MARKET SHARE ANALYSIS BY END-USER INDUSTRY (2024)
FIGURE 162 FRANCE MARKET SHARE ANALYSIS BY TYPE (2024)
FIGURE 163 FRANCE MARKET SHARE ANALYSIS BY END-USER INDUSTRY (2024)
FIGURE 164 UK MARKET SHARE ANALYSIS BY TYPE (2024)
FIGURE 165 UK MARKET SHARE ANALYSIS BY END-USER INDUSTRY (2024)
FIGURE 166 SPAIN MARKET SHARE ANALYSIS BY TYPE (2024)
FIGURE 167 SPAIN MARKET SHARE ANALYSIS BY END-USER INDUSTRY (2024)
FIGURE 168 ITALY MARKET SHARE ANALYSIS BY TYPE (2024)
FIGURE 169 ITALY MARKET SHARE ANALYSIS BY END-USER INDUSTRY (2024)
FIGURE 170 BRAZIL MARKET SHARE ANALYSIS BY TYPE (2024)
FIGURE 171 BRAZIL MARKET SHARE ANALYSIS BY END-USER INDUSTRY (2024)
FIGURE 172 ARGENTINA MARKET SHARE ANALYSIS BY TYPE (2024)
FIGURE 173 ARGENTINA MARKET SHARE ANALYSIS BY END-USER INDUSTRY (2024)
FIGURE 174 COLUMBIA MARKET SHARE ANALYSIS BY TYPE (2024)
FIGURE 175 COLUMBIA MARKET SHARE ANALYSIS BY END-USER INDUSTRY (2024)
FIGURE 176 GLOBAL TEMPERATURE DATA-LOGGERS CURRENT AND FUTURE MARKET KEY COUNTRY LEVEL ANALYSIS, 2024–2034, (USD MILLION)
FIGURE 177 FINANCIAL OVERVIEW:
Key Player Analysis
TMI-Orion SA: TMI-Orion SA positions itself as a specialist provider of advanced temperature and environmental monitoring solutions, particularly for extreme and mission-critical applications. By 2025, the company has strengthened its presence in sectors such as pharmaceuticals, life sciences, and food processing, where precision and compliance are non-negotiable. Its portfolio emphasizes rugged, high-performance loggers capable of withstanding sterilization processes and harsh conditions, differentiating it from competitors focused on standard cold-chain solutions. Recent efforts to integrate wireless data transmission and cloud-enabled analytics into its devices highlight its strategic alignment with the industry’s shift toward real-time monitoring and digital compliance reporting. This blend of durability and innovation has allowed TMI-Orion to remain a trusted partner for industries that demand accuracy in the most challenging environments.
OMEGA Engineering Inc.: OMEGA Engineering Inc. continues to hold a strong position as both a market leader and technology innovator in sensing, control, and monitoring solutions. Its data-loggers are widely adopted across industrial and commercial sectors, offering a comprehensive range from thermocouple-based to wireless and IoT-enabled devices. As of 2025, OMEGA’s strategic focus has been on expanding its smart monitoring ecosystem, combining advanced loggers with cloud-based platforms for predictive analytics and operational optimization. The company leverages its established reputation in industrial instrumentation to integrate AI-driven features that support predictive maintenance and compliance automation. This ability to provide end-to-end monitoring solutions—spanning sensors, loggers, and cloud interfaces—positions OMEGA as a key enabler of digital transformation in temperature-sensitive industries.
Cryopak: Cryopak has carved a niche as a leading provider of packaging and temperature monitoring solutions for cold chain logistics. By 2025, the company has expanded its reach through a combination of reusable and single-use data-loggers designed to ensure integrity across pharmaceutical, biotechnology, and food supply chains. Cryopak’s differentiator lies in its ability to integrate monitoring devices directly into insulated packaging systems, offering customers a streamlined, turnkey solution for shipment validation. The company’s recent investments in IoT-enabled and Bluetooth-compatible devices have strengthened its role in enabling real-time visibility for logistics providers. With global demand for biologics and vaccines on the rise, Cryopak is positioned as a critical player at the intersection of packaging innovation and data-driven temperature assurance.
Hioki EE Corporation: Hioki EE Corporation is recognized for its expertise in high-precision electronic measurement instruments, extending its strengths into advanced temperature data-loggers. By 2025, Hioki has increasingly targeted industrial and research applications requiring fine-grained accuracy, such as energy systems, electronics testing, and advanced manufacturing. The company differentiates itself through its focus on multi-channel loggers capable of handling complex data environments, appealing to enterprises engaged in high-volume testing and monitoring. Strategic enhancements in connectivity, including wireless and cloud integration, align Hioki with the broader industry movement toward digitalized, AI-supported monitoring systems. Its strong reputation in the precision measurement domain allows Hioki to appeal to customers prioritizing accuracy, reliability, and seamless integration with broader test and monitoring infrastructures.
Market Key Players
MadgeTech Inc.
Rotronic AG
Cryopak
Onset Computer Corporation
TMI-Orion SA
Thermoworks Inc.
NOVUS Automation Inc.
Protimeter
Hioki EE Corporation
Softbox Systems Limited
Elpro-Buchs AG
Global Cold Chain Solutions Pty Limited
OMEGA Engineering Inc.
Kimo Instruments
Testo SE & Co. KGaA
Lascar Electronics Limited
Driver
Cold Chain Expansion and Regulatory Push
As of 2025, the expansion of global cold chain logistics and the tightening of food and pharmaceutical safety regulations are the primary forces driving adoption of temperature data-loggers. Companies such as Nestlé, Pfizer, and DHL increasingly rely on these devices to ensure compliance with strict quality standards, safeguard perishable goods, and reduce costly spoilage. The integration of IoT-enabled loggers with real-time monitoring platforms further strengthens their role, allowing businesses to optimize supply chain visibility and make proactive operational decisions. This alignment of regulatory necessity with technological advancement continues to accelerate market growth.
Restraint
High Costs and Integration Challenges
Despite growing demand, the market faces significant challenges related to cost and system integration. Advanced reusable and IoT-connected loggers often require high upfront investment, which limits adoption among smaller logistics providers and emerging-market players. In addition, the lack of interoperability between devices from different manufacturers complicates large-scale deployment, creating inefficiencies in industries that operate across multiple geographies. Resistance to replacing legacy monitoring systems further slows the transition, underscoring the need for standardized protocols and more cost-effective solutions to broaden adoption.
Opportunity
Smart & Sustainable Data-Logger Solutions
A key opportunity in 2025 lies in the development of smart, connected data-loggers designed for sustainability and automation. Growing emphasis on reducing food waste, improving pharmaceutical supply chain resilience, and aligning with global ESG goals is prompting investment in advanced monitoring solutions. Vendors that integrate AI-driven analytics, predictive maintenance, and blockchain-based traceability into data-loggers can capture strong growth potential. For example, deploying AI-enhanced loggers in vaccine distribution can not only ensure compliance but also improve efficiency, offering strategic advantages for both technology providers and logistics operators.
Trend
Cloud-Connected and Digital Supply Chain Integration
A defining trend shaping the market in 2025 is the shift toward cloud-connected and wireless data-loggers integrated with digital supply chain ecosystems. These devices provide continuous data streams accessible via mobile applications and centralized dashboards, enabling real-time intervention when temperature deviations occur. Major logistics firms and healthcare providers are increasingly deploying these smart systems as part of broader digital transformation strategies. Coupled with rising adoption of blockchain for traceability and automation in compliance reporting, this trend marks the transition of temperature data-loggers from standalone tools to essential components of intelligent, data-driven supply chains.
Recent Developments
December 2024 – Cryopak: Rolled out the Phase 22 thermal shipping line specifically tailored for the transport of reptiles and amphibians, capable of maintaining ambient room temperature (68–75 °F) for up to 24 hours across varied climates. This specialized solution underscores Cryopak’s strategy of addressing niche verticals by integrating temperature monitoring into bespoke thermal packaging systems.
January 2025 – MadgeTech: Announced the NanoTemp125, a compact high-precision temperature data-logger (-40 °C to +125 °C, ±0.1 °C accuracy), optimized for tight spaces such as autoclave validation and pharmaceutical microenvironments. This launch enhances MadgeTech’s positioning in industries demanding both miniaturization and rigorous accuracy, reinforcing its appeal to regulated sectors that increasingly require reliability in constrained form factors.
January 2025 – Cryopak Digital: Expanded its iMINI Series, introducing both single-use and reusable configurations with upgraded software capabilities, remote access, and multi-threshold alarms. Targeted at biotech, clinical trials, and warehouse applications, this expansion broadens Cryopak’s portfolio in economical monitoring options with flexible deployment models for temperature-sensitive supply chains.
February 2025 – Tzone Digital Technology Co., Ltd.: Unveiled the TT19SI, a 4G wireless, real-time temperature and humidity logger with multi-parameter sensing (light, vibration, location), cloud integration, and up to 120 days battery life, introduced at Fruit Logistica Berlin. This product strengthens Tzone’s competitive edge in offering globally compatible, long-duration monitoring solutions suited for cold chains and logistics operations with remote visibility.