Thin Insulation Market Size | Growth to USD 10.1 Billion at 6.9% CAGR
Global Thin Insulation Market Size, Share & Analysis By Type (Sheets and Films, Vacuum Insulation Panels (VIP), Coatings, Foils, Foams), By Materials (Aerogels, Silica Aerogels, Metals, Plastic Foams, Fiberglass), By Thickness Range (Less Than 1 Inch, 1 Inch to 2 Inches, 2 Inches to 4 Inches, More Than 4 Inches), By Installation Method, By Application , By End User, Energy Efficiency Regulations, Thermal Performance Trends & Forecast 2025–2034
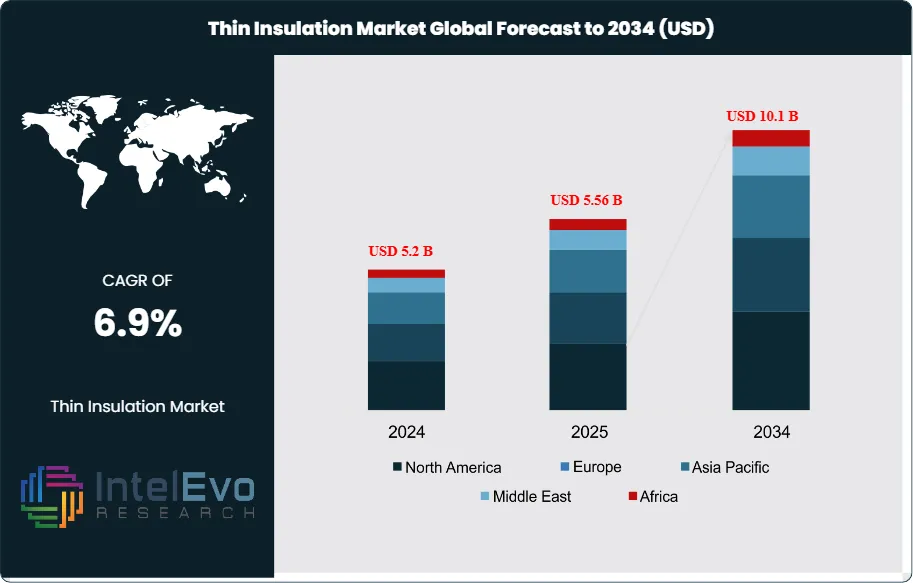
The Thin Insulation Market is estimated at USD 5.2 billion in 2024 and is on track to reach roughly USD 10.1 billion by 2034, implying a compound annual growth rate (CAGR) of 6.9% over 2025–2034. This trajectory reflects the sector’s pivotal role in addressing rising energy efficiency demands and space optimization challenges across industries such as construction, automotive, and electronics. Historically valued at USD 7.3 billion in 2021 and projected to hit USD 9.1 billion by 2026 at a CAGR of 4.5%, the market has transitioned from steady growth into a phase of accelerated adoption fueled by regulatory pressure, technological advancements, and sustainability imperatives.
Demand-side momentum is strongest in the construction industry, which accounted for nearly 45% of global thin insulation consumption in 2022, as building developers prioritize solutions that balance energy conservation with spatial efficiency. Automotive manufacturers, representing approximately 20% of market share, are increasingly deploying thin insulation for both thermal management and noise reduction in next-generation electric and hybrid vehicles. Supply-side dynamics further highlight the significance of China and Germany as key production hubs, with China alone exporting thin insulation materials valued at over USD 200 million to North America in 2022, underscoring the strategic role of global trade flows in meeting regional demand.
Regulatory frameworks have been instrumental in shaping adoption patterns. The European Union’s Energy Performance of Buildings Directive (EPBD) and the U.S. Department of Energy’s insulation standards are compelling both private and public stakeholders to invest in advanced insulation technologies. Complementing these mandates, policy-driven funding, such as the USD 500 million allocation under the U.S. Infrastructure Investment and Jobs Act for sustainable building solutions, is providing a tailwind for innovation and deployment.
Technological advancements are rapidly redefining product performance, with AI-driven design tools, nanomaterials, and advanced composites enabling thinner, more effective insulation with superior durability. Strategic collaborations and investments amplify this trend, as evidenced by the 2023 partnership between DuPont and Honeywell targeting next-generation automotive and aerospace applications, and Kingspan’s USD 100 million acquisition to strengthen market positioning.
Regionally, Western Europe and North America remain the largest consumers, while Asia-Pacific is emerging as a high-growth hotspot, driven by rapid urbanization and green infrastructure investments. For investors, opportunities lie in targeting markets where tightened building codes, electric vehicle penetration, and industrial automation converge to accelerate adoption, solidifying thin insulation’s status as a critical enabler of energy efficiency and sustainable growth.
Key Takeaways
Market Growth: The global Thin Insulation Market was valued at USD 5.2 billion in 2024 and is projected to reach USD 10.1 billion by 2034, expanding at a 6.9% CAGR (2025–2034). Growth is fueled by stricter building energy codes, demand for space-efficient insulation, and rising adoption in automotive and electronics sectors.
Product Type: Sheets and Films accounted for 34.4% of the market in 2023, benefiting from cost-effectiveness, easy installation, and adaptability across construction and industrial applications.
Material: Aerogels led the materials segment with a 28.7% share in 2023, driven by superior thermal resistance and adoption in aerospace, automotive, and oil & gas industries.
Thickness Range: The “Less Than 1 Inch” category represented 27.7% of global demand, underscoring its importance in space-constrained applications such as retrofitted buildings, vehicles, and consumer electronics.
Installation Method: Spray Insulation captured 34.5% share, offering enhanced energy efficiency and versatility for both residential and commercial construction projects.
Application: Building Thermal Insulation remained the leading application with a 37.5% share, reflecting tightening building energy standards and the growing push for nearly zero-energy buildings in the EU and North America.
End User: Building and Construction was the largest end-user segment, holding 35.6% share in 2023, as governments and private developers prioritize energy-efficient urban infrastructure.
Driver: Regulatory frameworks such as the EU Energy Performance of Buildings Directive (EPBD) and the U.S. DOE insulation standards are accelerating adoption, complemented by USD 500 million in U.S. federal funding for sustainable building materials.
Restraint: High production costs of advanced insulation materials, particularly aerogels, limit adoption in cost-sensitive markets, constraining penetration in low- and middle-income regions.
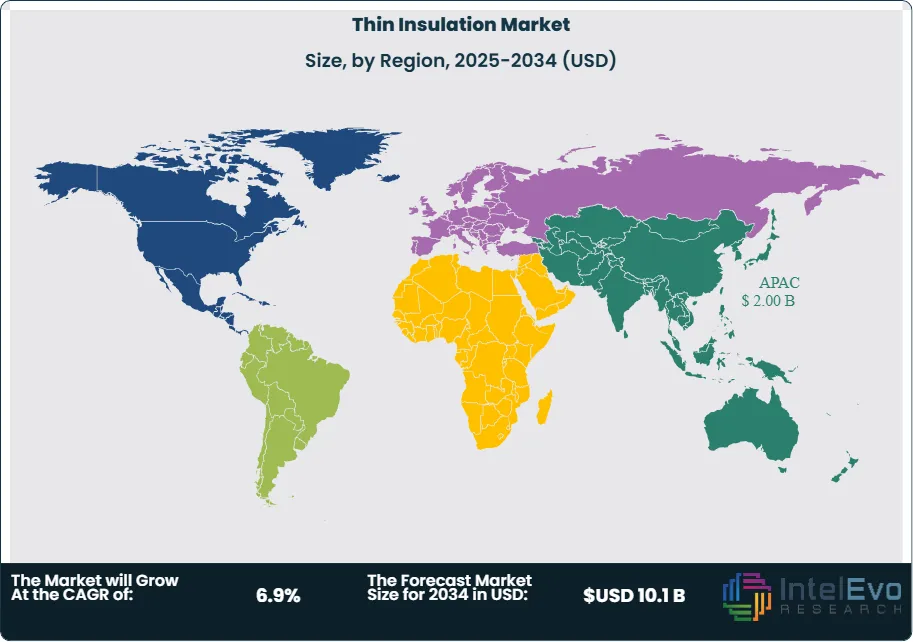
Opportunity: The Asia-Pacific market, valued at USD 1.1 billion in 2023 (38.5% share), is set for accelerated growth due to rapid urbanization, green building initiatives, and increasing EV adoption—making it a prime investment hotspot.
Trend: Ongoing R&D in nanomaterials, AI-driven insulation design, and lightweight composites is reshaping the market. Notable moves include the 2023 DuPont-Honeywell partnership targeting automotive insulation solutions and Kingspan’s USD 100 million acquisition to expand product portfolios.
Regional Analysis: Asia-Pacific leads the global market with 38.5% share, supported by infrastructure expansion and government-led energy efficiency mandates. Meanwhile, North America and Western Europe remain mature markets driven by regulatory compliance, while Latin America and the Middle East emerge as new demand frontiers due to industrial growth and construction investments.
Type Analysis
Sheets and Films remain the anchor of the thin insulation landscape, accounting for 34.4% of global revenues in 2023. Their dominance into 2025 and beyond is underpinned by broad use in building envelopes, HVAC duct wraps, and industrial equipment where millimeter-level build-up is critical. Performance improvements—multi-layer laminates, infrared (IR) modifiers, and low-emissivity surfaces—are extending service life and improving R-values per millimeter, supporting code compliance without structural redesign.
Vacuum Insulation Panels (VIP) are the fastest-rising type, used in high-efficiency façades, commercial refrigeration, and cold-chain packaging. While still a smaller revenue base than Sheets and Films, VIP adoption is expected to outpace the overall market growth through 2033 thanks to ultra-low thermal conductivity (λ ≈ 0.004–0.008 W/m·K) and shrinking total cost of ownership. Coatings and Foils continue to gain share in retrofit settings; reflective foils boost thermal resistance in hot climates, while sprayable thin-film coatings enable coverage on irregular substrates. Foams (including advanced rigid and flexible formats) retain relevance where structural rigidity and acoustic damping are required, with hybrid systems (foam + foil) increasingly specified to balance thermal and moisture performance.
Materials Analysis
Aerogels led the materials mix with a 28.7% share in 2023, reflecting their superior thermal resistance at minimal thickness and favorable weight-to-performance ratio. From 2025 onward, continued price rationalization and process yields in silica aerogels are widening use in façades, process piping, EV battery packs, and aerospace cabins. Silica Aerogels, the largest aerogel sub-class, are benefiting from improved hydrophobicity and dust-suppression treatments, enhancing installation productivity and safety.
Metals (foils) are entrenched in radiant barrier applications and as facer layers that augment vapor control. Plastic Foams—notably XPS/EPS variants and emerging low-GWP formulations—remain pivotal in cost-sensitive builds and logistics, while Fiberglass persists as a workhorse where fire performance and acoustic attenuation are prioritized. Across materials, formulation shifts toward low-emission binders and circular inputs (recycled content, solvent-free coatings) are becoming specification requirements in public tenders and green-building certifications.
Thickness Range Analysis
The “Less Than 1 Inch” category led with 27.7% share in 2023, reflecting its suitability for space-constrained retrofits and assemblies where cladding depth, mass, or door/window clearances cannot be compromised. This range is central to urban refurbishments and transport platforms (rolling stock, EVs) where every millimeter affects weight and aerodynamics.
Thickness bands from “1 Inch to 2 Inches” and “2 Inches to 4 Inches” are widely used in commercial envelopes and industrial assets to meet stricter U-values without redesigning wall sections. “More Than 4 Inches” remains a smaller niche but is essential for deep-cold environments—cold rooms, LNG handling, and certain pharmaceutical logistics—where peak thermal performance and condensation control trump footprint concerns.
Installation Method Analysis
Spray Insulation held the lead with a 34.5% share in 2023, driven by its ability to eliminate thermal bypass via continuous coverage and gap filling. In 2025+, building codes that emphasize airtightness and moisture management sustain spray systems in both new build and complex retrofits, especially where geometric complexity penalizes board-based solutions.
Board Insulation retains strong traction in façades, roofs, and equipment housings due to consistent thickness, dimensional stability, and faster QA/QC on site. Batts and Rolls remain competitive in cost-controlled residential projects and selective commercial interiors, especially when installers seek familiar methods with predictable labor times. Blown-In Insulation continues to rise in occupied retrofits, filling cavities and attics with minimal disruption while immediately improving energy intensity per square meter.
Application Analysis
Building Thermal Insulation was the largest application at 37.5% share in 2023, supported by tightening energy performance standards and net-zero pathways. From 2025 onward, thin solutions are increasingly specified in envelope upgrades (over-cladding, interior retrofits) where maintaining usable floor area and façade lines is critical. Performance stack-ups—combining thin reflective layers, aerogel blankets, and vapor control—are becoming standard in high-performance retrofits.
Thermal Packaging is a notable growth pocket, propelled by cold-chain expansion in pharmaceuticals and perishables, along with last-mile delivery. VIP and aerogel-lined shippers are used to meet hold-time targets while reducing package weight. Wires and Cables leverage thin insulation for heat resistance and dielectric performance in EVs and data centers, while Pipe Coatings in oil, gas, and chemicals support process efficiency and personnel protection, with thin formats enabling rapid maintenance cycles and reduced downtime.
End User Analysis
Building and Construction remained the top end user with 35.6% share in 2023, as developers pursue energy-use intensity reductions and green certifications across commercial offices, healthcare, and multifamily. The 2025+ outlook points to accelerated retrofit demand in aging building stock, where thin assemblies enable compliance without major structural rework.
Automotive is growing on the back of EV platform proliferation, using thin insulation for battery thermal management, cabin NVH, and occupant comfort—areas where grams and millimeters matter. Aerospace specifies aerogel and advanced foils for cabin comfort and systems protection while preserving range through weight savings. In Oil and Gas, thin, high-performance wraps and coatings mitigate heat loss and corrosion under insulation (CUI), improving asset life and process stability, especially in brownfield upgrades where space is constrained.
Regional Analysis
Asia Pacific leads the global market with 38.5% share (≈USD 1.1 billion in 2023) and is poised to widen its lead through 2030+ as China, India, and Southeast Asia intensify urban housing programs and industrial capacity additions. Local manufacturing of films, foils, and aerogel blankets, combined with rising green-building mandates, underpins sustained demand.
North America remains a high-value market driven by deep retrofit programs, building code convergence toward lower U-values, and cold-chain investments. Europe sustains premium specifications via the Energy Performance of Buildings framework and decarbonization funding, with Northern and Western Europe emphasizing envelope upgrades in social housing and public buildings. Latin America and the Middle East & Africa are emerging growth corridors: Latin America benefits from modernization of commercial stock and cold-chain build-out, while GCC countries deploy thin, reflective, and hybrid systems to combat high solar loads and advance national energy-efficiency agendas.
By Type (Sheets and Films, Vacuum Insulation Panels (VIP), Coatings, Foils, Foams, Others), By Materials (Aerogels, Silica Aerogels, Metals, Plastic Foams, Fiberglass, Others), By Thickness Range (Less Than 1 Inch, 1 Inch to 2 Inches, 2 Inches to 4 Inches, More Than 4 Inches), By Installation Method (Spray Insulation, Board Insulation, Batts and Rolls, Blown-In Insulation), By Application (Building Thermal Insulation, Thermal Packaging, Wires and Cables, Pipe Coatings, Others), By End User (Automotive, Aerospace, Building and Construction, Oil and Gas, Others)
Research Methodology
Primary Research- 100 Interviews of Stakeholders
Secondary Research
Desk Research
Regional scope
North America (United States, Canada, Mexico)
Latin America (Brazil, Argentina, Columbia)
East Asia And Pacific (China, Japan, South Korea, Australia, Cambodia, Fiji, Indonesia)
Sea And South Asia (India, Singapore, Thailand, Taiwan, Malaysia)
Eastern Europe (Poland, Russia, Czech Republic, Romania)
Western Europe (Germany, U.K., France, Spain, Itlay)
Middle East & Africa (GCC Countries, Egypt, Nigeria, South Africa, Israel)
Competitive Landscape
Kingspan Group, ContiTech AG, Rockwool Group, 3M, BNZ Materials, Inc., UNILIN Insulation, Owens Corning, Actis Insulation Ltd., Dow Chemical Company, Armacell International S.A., Huntsman International LLC, Saint-Gobain, BASF SE, Cabot Corporation, Celotax Saint Gobain, Johns Manville, A Berkshire Hathaway Company, Xtratherm
Customization Scope
Customization for segments, region/country-level will be provided. Moreover, additional customization can be done based on the requirements.
Pricing and Purchase Options
Avail customized purchase options to meet your exact research needs. We have three licenses to opt for: Single User License, Multi-User License (Up to 5 Users), Corporate Use License (Unlimited User and Printable PDF).
TABLE OF CONTENTS
1. EXECUTIVE SUMMARY
1.1. MARKET SNAPSHOT
1.2. KEY FINDINGS & INSIGHTS
1.3. ANALYST RECOMMENDATIONS
1.4. FUTURE OUTLOOK
2. RESEARCH METHODOLOGY
2.1. MARKET DEFINITION & SCOPE
2.2. RESEARCH OBJECTIVES: PRIMARY & SECONDARY DATA SOURCES
2.3. DATA COLLECTION SOURCES
2.3.1. COVERAGE OF 100+ PRIMARY RESEARCH/CONSULTATION CALLS WITH INDUSTRY STAKEHOLDERS
FIGURE 17 NORTH AMERICA THIN INSULATION CURRENT AND FUTURE TYPE ANALYSIS, 2025–2034, (USD MILLION)
FIGURE 18 NORTH AMERICA THIN INSULATION CURRENT AND FUTURE END USER ANALYSIS, 2025–2034, (USD MILLION)
FIGURE 19 MARKET SHARE BY COUNTRY
FIGURE 20 LATIN AMERICA THIN INSULATION CURRENT AND FUTURE TYPE ANALYSIS, 2025–2034, (USD MILLION)
FIGURE 21 LATIN AMERICA THIN INSULATION CURRENT AND FUTURE END USER ANALYSIS, 2025–2034, (USD MILLION)
FIGURE 22 MARKET SHARE BY COUNTRY
FIGURE 23 EASTERN EUROPE THIN INSULATION CURRENT AND FUTURE TYPE ANALYSIS, 2025–2034, (USD MILLION)
FIGURE 24 EASTERN EUROPE THIN INSULATION CURRENT AND FUTURE END USER ANALYSIS, 2025–2034, (USD MILLION)
FIGURE 25 MARKET SHARE BY COUNTRY
FIGURE 26 WESTERN EUROPE THIN INSULATION CURRENT AND FUTURE TYPE ANALYSIS, 2025–2034, (USD MILLION)
FIGURE 27 WESTERN EUROPE THIN INSULATION CURRENT AND FUTURE END USER ANALYSIS, 2025–2034, (USD MILLION)
FIGURE 28 MARKET SHARE BY COUNTRY
FIGURE 29 EAST ASIA AND PACIFIC THIN INSULATION CURRENT AND FUTURE TYPE ANALYSIS, 2025–2034, (USD MILLION)
FIGURE 30 EAST ASIA AND PACIFIC THIN INSULATION CURRENT AND FUTURE END USER ANALYSIS, 2025–2034, (USD MILLION)
FIGURE 31 MARKET SHARE BY COUNTRY
FIGURE 32 SEA AND SOUTH ASIA THIN INSULATION CURRENT AND FUTURE TYPE ANALYSIS, 2025–2034, (USD MILLION)
FIGURE 33 SEA AND SOUTH ASIA THIN INSULATION CURRENT AND FUTURE END USER ANALYSIS, 2025–2034, (USD MILLION)
FIGURE 34 MARKET SHARE BY COUNTRY
FIGURE 35 MIDDLE EAST AND AFRICA THIN INSULATION CURRENT AND FUTURE TYPE ANALYSIS, 2025–2034, (USD MILLION)
FIGURE 36 MIDDLE EAST AND AFRICA THIN INSULATION CURRENT AND FUTURE END USER ANALYSIS, 2025–2034, (USD MILLION)
FIGURE 37 NORTH AMERICA THIN INSULATION CURRENT AND FUTURE MARKET VOLUME SHARE REGIONAL ANALYSIS, 2025–2034, (USD MILLION)
FIGURE 38 U.S. THIN INSULATION CURRENT AND FUTURE TYPE ANALYSIS, 2025–2034, (USD MILLION)
FIGURE 39 U.S. THIN INSULATION CURRENT AND FUTURE END USER ANALYSIS, 2025–2034, (USD MILLION)
FIGURE 40 CANADA THIN INSULATION CURRENT AND FUTURE TYPE ANALYSIS, 2025–2034, (USD MILLION)
FIGURE 41 CANADA THIN INSULATION CURRENT AND FUTURE END USER ANALYSIS, 2025–2034, (USD MILLION)
FIGURE 42 LATIN AMERICA THIN INSULATION CURRENT AND FUTURE MARKET VOLUME SHARE REGIONAL ANALYSIS, 2025–2034, (USD MILLION)
FIGURE 43 MEXICO THIN INSULATION CURRENT AND FUTURE TYPE ANALYSIS, 2025–2034, (USD MILLION)
FIGURE 44 MEXICO THIN INSULATION CURRENT AND FUTURE END USER ANALYSIS, 2025–2034, (USD MILLION)
FIGURE 45 BRAZIL THIN INSULATION CURRENT AND FUTURE TYPE ANALYSIS, 2025–2034, (USD MILLION)
FIGURE 46 BRAZIL THIN INSULATION CURRENT AND FUTURE END USER ANALYSIS, 2025–2034, (USD MILLION)
FIGURE 47 ARGENTINA THIN INSULATION CURRENT AND FUTURE TYPE ANALYSIS, 2025–2034, (USD MILLION)
FIGURE 48 ARGENTINA THIN INSULATION CURRENT AND FUTURE END USER ANALYSIS, 2025–2034, (USD MILLION)
FIGURE 49 COLUMBIA THIN INSULATION CURRENT AND FUTURE TYPE ANALYSIS, 2025–2034, (USD MILLION)
FIGURE 50 COLUMBIA THIN INSULATION CURRENT AND FUTURE END USER ANALYSIS, 2025–2034, (USD MILLION)
FIGURE 51 REST OF LATIN AMERICA THIN INSULATION CURRENT AND FUTURE TYPE ANALYSIS, 2025–2034, (USD MILLION)
FIGURE 52 REST OF LATIN AMERICA THIN INSULATION CURRENT AND FUTURE END USER ANALYSIS, 2025–2034, (USD MILLION)
FIGURE 53 EASTERN EUROPE THIN INSULATION CURRENT AND FUTURE MARKET VOLUME SHARE REGIONAL ANALYSIS, 2025–2034, (USD MILLION)
FIGURE 54 POLAND THIN INSULATION CURRENT AND FUTURE TYPE ANALYSIS, 2025–2034, (USD MILLION)
FIGURE 55 POLAND THIN INSULATION CURRENT AND FUTURE END USER ANALYSIS, 2025–2034, (USD MILLION)
FIGURE 56 RUSSIA THIN INSULATION CURRENT AND FUTURE TYPE ANALYSIS, 2025–2034, (USD MILLION)
FIGURE 57 RUSSIA THIN INSULATION CURRENT AND FUTURE END USER ANALYSIS, 2025–2034, (USD MILLION)
FIGURE 58 CZECH REPUBLIC THIN INSULATION CURRENT AND FUTURE TYPE ANALYSIS, 2025–2034, (USD MILLION)
FIGURE 59 CZECH REPUBLIC THIN INSULATION CURRENT AND FUTURE END USER ANALYSIS, 2025–2034, (USD MILLION)
FIGURE 60 ROMANIA THIN INSULATION CURRENT AND FUTURE TYPE ANALYSIS, 2025–2034, (USD MILLION)
FIGURE 61 ROMANIA THIN INSULATION CURRENT AND FUTURE END USER ANALYSIS, 2025–2034, (USD MILLION)
FIGURE 62 REST OF EASTERN EUROPE THIN INSULATION CURRENT AND FUTURE TYPE ANALYSIS, 2025–2034, (USD MILLION)
FIGURE 63 REST OF EASTERN EUROPE THIN INSULATION CURRENT AND FUTURE END USER ANALYSIS, 2025–2034, (USD MILLION)
FIGURE 64 WESTERN EUROPE THIN INSULATION CURRENT AND FUTURE MARKET VOLUME SHARE REGIONAL ANALYSIS, 2025–2034, (USD MILLION)
FIGURE 65 GERMANY THIN INSULATION CURRENT AND FUTURE TYPE ANALYSIS, 2025–2034, (USD MILLION)
FIGURE 66 GERMANY THIN INSULATION CURRENT AND FUTURE END USER ANALYSIS, 2025–2034, (USD MILLION)
FIGURE 67 FRANCE THIN INSULATION CURRENT AND FUTURE TYPE ANALYSIS, 2025–2034, (USD MILLION)
FIGURE 68 FRANCE THIN INSULATION CURRENT AND FUTURE END USER ANALYSIS, 2025–2034, (USD MILLION)
FIGURE 69 UK THIN INSULATION CURRENT AND FUTURE TYPE ANALYSIS, 2025–2034, (USD MILLION)
FIGURE 70 UK THIN INSULATION CURRENT AND FUTURE END USER ANALYSIS, 2025–2034, (USD MILLION)
FIGURE 71 SPAIN THIN INSULATION CURRENT AND FUTURE TYPE ANALYSIS, 2025–2034, (USD MILLION)
FIGURE 72 SPAIN THIN INSULATION CURRENT AND FUTURE END USER ANALYSIS, 2025–2034, (USD MILLION)
FIGURE 73 ITALY THIN INSULATION CURRENT AND FUTURE TYPE ANALYSIS, 2025–2034, (USD MILLION)
FIGURE 74 ITALY THIN INSULATION CURRENT AND FUTURE END USER ANALYSIS, 2025–2034, (USD MILLION)
FIGURE 75 REST OF WESTERN EUROPE THIN INSULATION CURRENT AND FUTURE TYPE ANALYSIS, 2025–2034, (USD MILLION)
FIGURE 76 REST OF WESTERN EUROPE THIN INSULATION CURRENT AND FUTURE END USER ANALYSIS, 2025–2034, (USD MILLION)
FIGURE 77 EAST ASIA AND PACIFIC THIN INSULATION CURRENT AND FUTURE MARKET VOLUME SHARE REGIONAL ANALYSIS, 2025–2034, (USD MILLION)
FIGURE 78 CHINA THIN INSULATION CURRENT AND FUTURE TYPE ANALYSIS, 2025–2034, (USD MILLION)
FIGURE 79 CHINA THIN INSULATION CURRENT AND FUTURE END USER ANALYSIS, 2025–2034, (USD MILLION)
FIGURE 80 JAPAN THIN INSULATION CURRENT AND FUTURE TYPE ANALYSIS, 2025–2034, (USD MILLION)
FIGURE 81 JAPAN THIN INSULATION CURRENT AND FUTURE END USER ANALYSIS, 2025–2034, (USD MILLION)
FIGURE 82 AUSTRALIA THIN INSULATION CURRENT AND FUTURE TYPE ANALYSIS, 2025–2034, (USD MILLION)
FIGURE 83 AUSTRALIA THIN INSULATION CURRENT AND FUTURE END USER ANALYSIS, 2025–2034, (USD MILLION)
FIGURE 84 CAMBODIA THIN INSULATION CURRENT AND FUTURE TYPE ANALYSIS, 2025–2034, (USD MILLION)
FIGURE 85 CAMBODIA THIN INSULATION CURRENT AND FUTURE END USER ANALYSIS, 2025–2034, (USD MILLION)
FIGURE 86 FIJI THIN INSULATION CURRENT AND FUTURE TYPE ANALYSIS, 2025–2034, (USD MILLION)
FIGURE 87 FIJI THIN INSULATION CURRENT AND FUTURE END USER ANALYSIS, 2025–2034, (USD MILLION)
FIGURE 88 INDONESIA THIN INSULATION CURRENT AND FUTURE TYPE ANALYSIS, 2025–2034, (USD MILLION)
FIGURE 89 INDONESIA THIN INSULATION CURRENT AND FUTURE END USER ANALYSIS, 2025–2034, (USD MILLION)
FIGURE 90 SOUTH KOREA THIN INSULATION CURRENT AND FUTURE TYPE ANALYSIS, 2025–2034, (USD MILLION)
FIGURE 91 SOUTH KOREA THIN INSULATION CURRENT AND FUTURE END USER ANALYSIS, 2025–2034, (USD MILLION)
FIGURE 92 REST OF EAST ASIA AND PACIFIC THIN INSULATION CURRENT AND FUTURE TYPE ANALYSIS, 2025–2034, (USD MILLION)
FIGURE 93 REST OF EAST ASIA AND PACIFIC THIN INSULATION CURRENT AND FUTURE END USER ANALYSIS, 2025–2034, (USD MILLION)
FIGURE 94 SEA AND SOUTH ASIA THIN INSULATION CURRENT AND FUTURE MARKET VOLUME SHARE REGIONAL ANALYSIS, 2025–2034, (USD MILLION)
FIGURE 95 BANGLADESH THIN INSULATION CURRENT AND FUTURE TYPE ANALYSIS, 2025–2034, (USD MILLION)
FIGURE 96 BANGLADESH THIN INSULATION CURRENT AND FUTURE END USER ANALYSIS, 2025–2034, (USD MILLION)
FIGURE 97 NEW ZEALAND THIN INSULATION CURRENT AND FUTURE TYPE ANALYSIS, 2025–2034, (USD MILLION)
FIGURE 98 NEW ZEALAND THIN INSULATION CURRENT AND FUTURE END USER ANALYSIS, 2025–2034, (USD MILLION)
FIGURE 99 INDIA THIN INSULATION CURRENT AND FUTURE TYPE ANALYSIS, 2025–2034, (USD MILLION)
FIGURE 100 INDIA THIN INSULATION CURRENT AND FUTURE END USER ANALYSIS, 2025–2034, (USD MILLION)
FIGURE 101 SINGAPORE THIN INSULATION CURRENT AND FUTURE TYPE ANALYSIS, 2025–2034, (USD MILLION)
FIGURE 102 SINGAPORE THIN INSULATION CURRENT AND FUTURE END USER ANALYSIS, 2025–2034, (USD MILLION)
FIGURE 103 THAILAND THIN INSULATION CURRENT AND FUTURE TYPE ANALYSIS, 2025–2034, (USD MILLION)
FIGURE 104 THAILAND THIN INSULATION CURRENT AND FUTURE END USER ANALYSIS, 2025–2034, (USD MILLION)
FIGURE 105 TAIWAN THIN INSULATION CURRENT AND FUTURE TYPE ANALYSIS, 2025–2034, (USD MILLION)
FIGURE 106 TAIWAN THIN INSULATION CURRENT AND FUTURE END USER ANALYSIS, 2025–2034, (USD MILLION)
FIGURE 107 MALAYSIA THIN INSULATION CURRENT AND FUTURE TYPE ANALYSIS, 2025–2034, (USD MILLION)
FIGURE 108 MALAYSIA THIN INSULATION CURRENT AND FUTURE END USER ANALYSIS, 2025–2034, (USD MILLION)
FIGURE 109 REST OF SEA AND SOUTH ASIA THIN INSULATION CURRENT AND FUTURE TYPE ANALYSIS, 2025–2034, (USD MILLION)
FIGURE 110 REST OF SEA AND SOUTH ASIA THIN INSULATION CURRENT AND FUTURE END USER ANALYSIS, 2025–2034, (USD MILLION)
FIGURE 111 MIDDLE EAST AND AFRICA THIN INSULATION CURRENT AND FUTURE MARKET VOLUME SHARE REGIONAL ANALYSIS, 2025–2034, (USD MILLION)
FIGURE 112 GCC COUNTRIES THIN INSULATION CURRENT AND FUTURE TYPE ANALYSIS, 2025–2034, (USD MILLION)
FIGURE 113 GCC COUNTRIES THIN INSULATION CURRENT AND FUTURE END USER ANALYSIS, 2025–2034, (USD MILLION)
FIGURE 114 SAUDI ARABIA THIN INSULATION CURRENT AND FUTURE TYPE ANALYSIS, 2025–2034, (USD MILLION)
FIGURE 115 SAUDI ARABIA THIN INSULATION CURRENT AND FUTURE END USER ANALYSIS, 2025–2034, (USD MILLION)
FIGURE 116 UAE THIN INSULATION CURRENT AND FUTURE TYPE ANALYSIS, 2025–2034, (USD MILLION)
FIGURE 117 UAE THIN INSULATION CURRENT AND FUTURE END USER ANALYSIS, 2025–2034, (USD MILLION)
FIGURE 118 BAHRAIN THIN INSULATION CURRENT AND FUTURE TYPE ANALYSIS, 2025–2034, (USD MILLION)
FIGURE 119 BAHRAIN THIN INSULATION CURRENT AND FUTURE END USER ANALYSIS, 2025–2034, (USD MILLION)
FIGURE 120 KUWAIT THIN INSULATION CURRENT AND FUTURE TYPE ANALYSIS, 2025–2034, (USD MILLION)
FIGURE 121 KUWAIT THIN INSULATION CURRENT AND FUTURE END USER ANALYSIS, 2025–2034, (USD MILLION)
FIGURE 122 OMAN THIN INSULATION CURRENT AND FUTURE TYPE ANALYSIS, 2025–2034, (USD MILLION)
FIGURE 123 OMAN THIN INSULATION CURRENT AND FUTURE END USER ANALYSIS, 2025–2034, (USD MILLION)
FIGURE 124 QATAR THIN INSULATION CURRENT AND FUTURE TYPE ANALYSIS, 2025–2034, (USD MILLION)
FIGURE 125 QATAR THIN INSULATION CURRENT AND FUTURE END USER ANALYSIS, 2025–2034, (USD MILLION)
FIGURE 126 EGYPT THIN INSULATION CURRENT AND FUTURE TYPE ANALYSIS, 2025–2034, (USD MILLION)
FIGURE 127 EGYPT THIN INSULATION CURRENT AND FUTURE END USER ANALYSIS, 2025–2034, (USD MILLION)
FIGURE 128 NIGERIA THIN INSULATION CURRENT AND FUTURE TYPE ANALYSIS, 2025–2034, (USD MILLION)
FIGURE 129 NIGERIA THIN INSULATION CURRENT AND FUTURE END USER ANALYSIS, 2025–2034, (USD MILLION)
FIGURE 130 SOUTH AFRICA THIN INSULATION CURRENT AND FUTURE TYPE ANALYSIS, 2025–2034, (USD MILLION)
FIGURE 131 SOUTH AFRICA THIN INSULATION CURRENT AND FUTURE END USER ANALYSIS, 2025–2034, (USD MILLION)
FIGURE 132 ISRAEL THIN INSULATION CURRENT AND FUTURE TYPE ANALYSIS, 2025–2034, (USD MILLION)
FIGURE 133 ISRAEL THIN INSULATION CURRENT AND FUTURE END USER ANALYSIS, 2025–2034, (USD MILLION)
FIGURE 134 REST OF MEA THIN INSULATION CURRENT AND FUTURE TYPE ANALYSIS, 2025–2034, (USD MILLION)
FIGURE 135 REST OF MEA THIN INSULATION CURRENT AND FUTURE END USER ANALYSIS, 2025–2034, (USD MILLION)
FIGURE 136 U. S. MARKET SHARE ANALYSIS BY TYPE (2024)
FIGURE 137 U. S. MARKET SHARE ANALYSIS BY END USER (2024)
FIGURE 138 CANADA MARKET SHARE ANALYSIS BY TYPE (2024)
FIGURE 139 CANADA MARKET SHARE ANALYSIS BY END USER (2024)
FIGURE 140 MEXICO MARKET SHARE ANALYSIS BY TYPE (2024)
FIGURE 141 MEXICO MARKET SHARE ANALYSIS BY END USER (2024)
FIGURE 142 CHINA MARKET SHARE ANALYSIS BY TYPE (2024)
FIGURE 143 CHINA MARKET SHARE ANALYSIS BY END USER (2024)
FIGURE 144 JAPAN MARKET SHARE ANALYSIS BY TYPE (2024)
FIGURE 145 JAPAN MARKET SHARE ANALYSIS BY END USER (2024)
FIGURE 146 INDIA MARKET SHARE ANALYSIS BY TYPE (2024)
FIGURE 147 INDIA MARKET SHARE ANALYSIS BY END USER (2024)
FIGURE 148 SOUTH KOREA MARKET SHARE ANALYSIS BY TYPE (2024)
FIGURE 149 SOUTH KOREA MARKET SHARE ANALYSIS BY END USER (2024)
FIGURE 150 SAUDI ARABIA MARKET SHARE ANALYSIS BY TYPE (2024)
FIGURE 151 SAUDI ARABIA MARKET SHARE ANALYSIS BY END USER (2024)
FIGURE 152 UAE MARKET SHARE ANALYSIS BY TYPE (2024)
FIGURE 153 UAE MARKET SHARE ANALYSIS BY END USER (2024)
FIGURE 154 EGYPT MARKET SHARE ANALYSIS BY TYPE (2024)
FIGURE 155 EGYPT MARKET SHARE ANALYSIS BY END USER (2024)
FIGURE 156 NIGERIA MARKET SHARE ANALYSIS BY TYPE (2024)
FIGURE 157 NIGERIA MARKET SHARE ANALYSIS BY END USER (2024)
FIGURE 158 SOUTH AFRICA MARKET SHARE ANALYSIS BY TYPE (2024)
FIGURE 159 SOUTH AFRICA MARKET SHARE ANALYSIS BY END USER (2024)
FIGURE 160 GERMANY MARKET SHARE ANALYSIS BY TYPE (2024)
FIGURE 161 GERMANY MARKET SHARE ANALYSIS BY END USER (2024)
FIGURE 162 FRANCE MARKET SHARE ANALYSIS BY TYPE (2024)
FIGURE 163 FRANCE MARKET SHARE ANALYSIS BY END USER (2024)
FIGURE 164 UK MARKET SHARE ANALYSIS BY TYPE (2024)
FIGURE 165 UK MARKET SHARE ANALYSIS BY END USER (2024)
FIGURE 166 SPAIN MARKET SHARE ANALYSIS BY TYPE (2024)
FIGURE 167 SPAIN MARKET SHARE ANALYSIS BY END USER (2024)
FIGURE 168 ITALY MARKET SHARE ANALYSIS BY TYPE (2024)
FIGURE 169 ITALY MARKET SHARE ANALYSIS BY END USER (2024)
FIGURE 170 BRAZIL MARKET SHARE ANALYSIS BY TYPE (2024)
FIGURE 171 BRAZIL MARKET SHARE ANALYSIS BY END USER (2024)
FIGURE 172 ARGENTINA MARKET SHARE ANALYSIS BY TYPE (2024)
FIGURE 173 ARGENTINA MARKET SHARE ANALYSIS BY END USER (2024)
FIGURE 174 COLUMBIA MARKET SHARE ANALYSIS BY TYPE (2024)
FIGURE 175 COLUMBIA MARKET SHARE ANALYSIS BY END USER (2024)
FIGURE 176 GLOBAL THIN INSULATION CURRENT AND FUTURE MARKET KEY COUNTRY LEVEL ANALYSIS, 2024–2034, (USD MILLION)
FIGURE 177 FINANCIAL OVERVIEW:
Key Player Analysis
3M: Positioning: Innovator and fast-scaling challenger in thin, film-based building-envelope solutions. 3M leverages its materials science platform to target retrofit-heavy demand with low-e insulating window films that boost thermal performance without altering façade depth—critical for 2025 urban upgrade cycles. The company markets three-year simple payback in commercial settings for select film lines, strengthening ROI cases for asset owners under tighter energy-intensity targets.
Strategy & Differentiators: The portfolio centers on 3M™ Thinsulate™ Climate Control and other sun-control/low-e films that improve year-round comfort and reduce HVAC load, effectively enhancing window insulation value—often positioned as bringing single-pane performance closer to double-pane outcomes. A global installer ecosystem, strong warranty practices, and brand recognition improve specification confidence and project throughput. Expect continued emphasis on digitized energy audits and retrofit bundles with glass partners to expand share in the sheets & films segment (the market’s largest by type).
Actis Insulation Ltd.: Positioning: European innovator in reflective multifoil and hybrid thin insulation, with growing share in renovation and timber-frame construction. Actis’ flagship HControl Hybrid integrates thermal resistance with built-in vapor control, addressing airtightness and moisture risks in compact assemblies; the product’s core thermal resistance of ~1.9 m²K/W underpins competitive R-per-mm in constrained cavities.
Strategy & Differentiators: Actis scales through certification-led market entry (e.g., UK approvals) and a focused catalog—HYBRIS reflective systems and multifoils—for walls, roofs, and ceilings. The firm differentiates on installer productivity (lightweight, cut-to-fit rolls), compatibility with hybrid build-ups (foil + foam + airtight layers), and training programs that reduce performance gaps between modeled and as-built outcomes—an acute issue in 2025 retrofit programs across Western Europe.
Armacell International S.A.: Positioning: Leader in flexible equipment insulation, expanding its high-performance aerogel blanket franchise to address process-industry decarbonization and cold-chain growth. The ArmaGel family (e.g., HT for high temperatures and new XGC for cryogenic/dual-temperature service) targets demanding industrial specs, providing thermal efficiency with minimal thickness—vital where space, weight, and corrosion risks converge.
Strategy & Differentiators: In 2025, Armacell introduced ArmaGel XGC (ASTM C1728 Type I & IV), rated to −196 °C, supported by manufacturing in China and a new India facility—a footprint that tightens lead times for energy and LNG customers across APAC and the Middle East. ArmaGel’s low-dust handling, multi-thickness options (5–20 mm), and claims of superior thermal performance position Armacell to win brownfield upgrades where access constraints and CUI mitigation are decisive buying factors.
BASF SE:Positioning: Innovator with a science-led portfolio in thin, high-R aerogels, addressing premium building and industrial specifications. BASF’s SLENTITE® (polyurethane-based aerogel panel) and SLENTEX® (flexible mineral aerogel mat) are designed to deliver top-tier insulation at roughly half the thickness of conventional materials, enabling interior retrofits that preserve usable floor area—a 2025 priority in dense European cities.
Strategy & Differentiators: SLENTEX reports a declared thermal conductivity of ~19 mW/m·K, while SLENTITE emphasizes robust, dust-free handling and high compressive strength for easier fabrication and installation.
As of 2025, tightening building-energy regulations and corporate decarbonization targets are the primary catalysts for thin-insulation adoption. With buildings responsible for roughly 30–35% of global final energy use, policymakers are converging on lower U-values and airtightness standards (e.g., updated EU building directives and broader 2024/2025 IECC adoption in North America). Thin, high-R materials enable compliance without redesigning wall depths or sacrificing leasable floor area—an acute need in dense urban retrofits. The market is tracking at ~USD 3.3 billion in 2025, on pace to reach ~USD 5.0 billion by 2033 (≈6% CAGR, 2025–2033), with the step-up driven by envelope upgrades, cold-chain investments, and EV platform thermal management. Strategically, suppliers that bundle high-performance products with system-level engineering support (e.g., aerogel wraps + vapor control + detailing) are winning specifications and locking in multi-year frameworks with developers and OEMs.
Restraint:
High Installation Costs and Skill Gaps Limit Market Scalability
High installed costs and field-execution risks remain the main brakes on scale. Advanced thin solutions (VIPs, aerogels, multi-foil laminates) can carry 20–40% upfront premiums versus conventional insulation, pushing paybacks beyond 3–6 years in temperate markets unless paired with incentives. Performance is also sensitive to installation quality—punctures in VIPs or discontinuities in spray/foil layers can erode effective R-value by 15–30%, undermining modeled savings. In several emerging markets, scarce specialized labor and limited distributor training slow uptake, while end-of-life uncertainty for composite products invites procurement scrutiny. For investors, the implication is clear: capital should favor platforms with simplified install methods, verified field performance, and credible circularity roadmaps to mitigate specification risk and price pushback.
Opportunity:
Retrofits and Cold-Chain Logistics Unlock High-Growth Opportunities
Retrofit-heavy segments and temperature-critical logistics are poised to outgrow the core market. From 2025 onward, urban retrofits in Europe and Asia—where interior over-cladding must preserve floor space—are expected to expand at ~8–10% CAGR, supported by performance contracting and green-bond funding. In parallel, thermal packaging and commercial refrigeration (leveraging VIPs/aerogels) are set to rise at ~10–12% CAGR through 2030, potentially surpassing USD 1.2–1.4 billion as pharma cold chains, e-grocery, and last-mile delivery tighten hold-time KPIs. Automotive and battery ecosystems add a second growth flywheel: EV platforms increasingly specify thin, lightweight insulation for pack safety, cabin NVH, and heat-pump efficiency—creating multi-year volume visibility for tier-one suppliers that can meet OEM cost-down curves and low-GWP requirements.
Trend:
Digital, Circular, and Hybrid Innovations Redefine Market Trajectory
The next wave is defined by digitalized, circular, and hybrid solutions. On the product side, low-GWP formulations, recycled content facers, and EPD-backed aerogel blankets are moving from pilot to spec-grade, while hybrid stacks (foil + aerogel + vapor control) deliver higher R/mm and better moisture management. Equally important, data-driven insulation is scaling: sensorized envelopes and digital twins feed commissioning analytics, tightening the gap between modeled and actual performance by 5–10 percentage points in early deployments. Strategic moves—such as aerogel capacity expansions by leading specialty players, partnerships between building-material majors and IoT firms, and prefab façade systems that integrate thin insulation at the factory—are reshaping competition toward solution ecosystems rather than single SKUs, favoring firms that control both material IP and installation productivity.
Recent Developments
Dec 2024 – Kingspan Group: Kingspan acquired selected assets of TPF in France and completed multiple bolt-ons across Europe and LATAM, as detailed in its FY2024 preliminary statement; acquisitions completed in 2024 contributed €536.3 million of revenue in the post-acquisition period. Strategic impact: Broadens Kingspan’s insulation portfolio and accelerates regional scale ahead of 2025 retrofit demand.
Feb 2025 – Kingspan Group: Reported record 2024 performance and highlighted step-ups in insulation breadth (including stone wool capacity and natural insulation entry via Steico majority stake), reinforcing balance across product categories and geographies. Strategic impact: Strengthens competitive positioning in thin and hybrid insulation systems, supporting cross-sell into façade and roofing envelopes.
Mar 2025 – BASF: Announced a pilot with ABG FRANKFURT HOLDING and Sto using EPS insulation boards with recycled content, successfully validating performance and closing part of the EPS loop. Strategic impact: Enhances BASF’s sustainability credentials and aids specification wins where circularity and EPDs influence procurement.
Apr 2025 – Armacell: Launched ArmaGel® XGC, a next-generation cryogenic and dual-temperature aerogel blanket (ASTM C1728 Type I & IV) with manufacturing in China and a new facility in India, rated for service down to −196°C. Strategic impact: Expands Armacell’s high-performance thin insulation footprint in LNG, cold chain, and energy processing where thickness and weight are constrained.
May 2025 – Aspen Aerogels: Posted Q1 2025 revenue of USD 78.7 million (Thermal Barrier USD 48.9m; Energy Industrial USD 29.8m) and 29% gross margin, underscoring ongoing EV-thermal barrier adoption despite short-term volume variability. Strategic impact: Reinforces Aspen’s role in thin, lightweight insulation for EV safety and efficiency, with cash resources to fund capacity and program ramps.
Sep 2025 – BASF:Performance Materials confirmed REDcert2 certification across production sites following its January 2025 shift to renewable electricity in Europe—covering polyurethanes and specialty polymers relevant to advanced insulation systems. Strategic impact: Positions BASF as a low-carbon materials supplier, supporting thin-insulation specifications tied to ESG and low-embodied-carbon targets.