Tissue and Organ Transplantation Market Size, Share | CAGR 9.1%
Global Tissue and Organ Transplantation Market Size, Share & Industry Analysis By Product Type (Tissue Products, Solid Organs), By Transplant Type (Kidney, Liver, Heart, Lung, Pancreas, Cornea, Bone, Skin), By Donor Type (Living Donor, Deceased Donor), By End User (Hospitals, Transplant Centers, Research Institutes), By Technology & Preservation Method, Regional Outlook, Key Players, Market Dynamics, Regulatory Landscape, Innovation Trends & Forecast 2025–2034
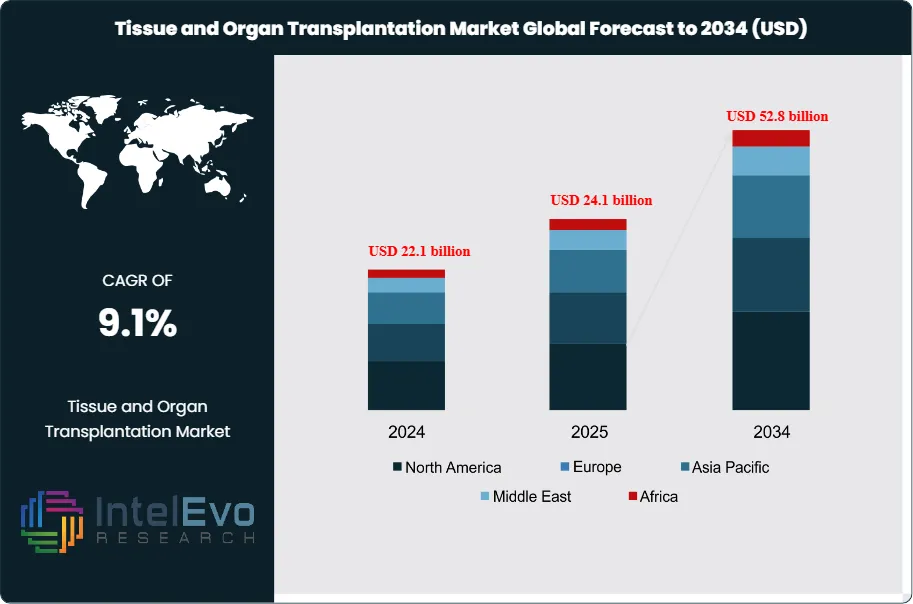
The Tissue And Organ Transplantation Market is estimated at USD 22.1 billion in 2024 and is projected to reach approximately USD 52.8 billion by 2034, registering a compound annual growth rate (CAGR) of 9.1% during 2025–2034. This sustained expansion is driven by the rising prevalence of chronic organ failure, increasing geriatric population, and steady growth in transplant waiting lists worldwide. Advances in immunosuppressive therapies, organ preservation technologies, and surgical techniques are improving transplant success rates and long-term outcomes. In parallel, government initiatives to strengthen organ donation frameworks and growing investments in regenerative medicine and tissue engineering are reinforcing long-term market momentum across both developed and emerging healthcare systems.
This growth reflects both the rising prevalence of chronic diseases that lead to organ failure and the expanding scope of medical technologies that support transplantation. Over the past decade, the market has shifted from a reliance on limited donor availability toward a broader ecosystem that includes advanced preservation techniques, improved surgical outcomes, and research into alternatives such as xenotransplantation and bioengineered tissues.
The demand side is driven by the increasing incidence of kidney, liver, and heart diseases, which together account for the majority of global transplant procedures. According to the World Health Organization, more than 130,000 solid organ transplants are performed annually, yet this meets less than 10% of global demand. The supply side remains constrained by donor shortages, with waiting lists in major economies such as the United States and Europe continuing to grow. This imbalance creates both a humanitarian challenge and a structural driver for investment in artificial organs, regenerative medicine, and digital platforms that improve donor-recipient matching.
Regulatory frameworks play a central role in shaping the market. Stringent oversight ensures ethical procurement and equitable allocation, but it also slows the pace of adoption for experimental approaches. Immunosuppressive therapies, which represent a significant share of post-transplant costs, remain essential but carry risks of infection and long-term complications. Pharmaceutical companies are investing in targeted immunomodulators that could reduce these risks and improve patient outcomes.
Technology is reshaping the sector. Artificial intelligence is being applied to predictive analytics for organ compatibility, while blockchain-based registries are under development to enhance transparency in allocation systems. Advances in cold perfusion and organ preservation are extending viable transport times, opening new opportunities for cross-border collaboration and reducing wastage rates.
Regionally, North America leads the market, supported by advanced healthcare infrastructure, strong reimbursement systems, and high awareness of organ donation. Europe follows closely, with robust regulatory frameworks and active research programs. Asia-Pacific is emerging as the fastest-growing region, driven by rising healthcare expenditure, government-led awareness campaigns, and expanding transplant centers in countries such as India and China. For investors, the most attractive opportunities lie in technologies that address the donor shortage, including bioartificial organs, 3D bioprinting, and regenerative therapies, which are expected to capture increasing capital flows over the next decade.
Key Takeaways
Market Growth: The global tissue and organ transplantation market was valued at USD 22.1 billion in 2024 and is projected to reach USD 52.8 billion by 2034, expanding at a CAGR of 9.1% from 2025 to 2034. Growth is driven by rising incidences of chronic organ failure, advancements in surgical techniques, and expanding donor awareness programs.
Type: Organ transplantation accounted for 71.6% of total revenue in 2023, supported by high demand for kidney, liver, and heart transplants. The segment continues to dominate due to the prevalence of end-stage organ diseases and improved survival rates post-surgery.
Product: Tissue products represented 43.2% of the market in 2023, with skin grafts for burn and wound management driving adoption. Demand is further supported by applications in reconstructive and orthopedic procedures.
Driver: Rising global demand for kidney transplants, which represent nearly 60% of all organ transplants performed annually, is a key growth catalyst. Advances in immunosuppressive therapies and organ preservation technologies are improving success rates and expanding patient eligibility.
Restraint: A persistent shortage of donor organs remains the most significant barrier, with global supply meeting less than 10% of demand. This gap results in extended waiting lists and limits the number of procedures performed each year.
Opportunity: Tissue transplantation is expected to record the fastest growth, supported by bioengineering research and regenerative medicine. Applications in wound healing and reconstructive surgery are projected to accelerate adoption, particularly in emerging healthcare markets.
Trend: Adoption of AI-driven donor-recipient matching and blockchain-based organ registries is gaining traction. Companies are investing in 3D bioprinting and bioartificial organ development, signaling a shift toward long-term alternatives to donor dependency.
Regional Analysis: North America led the market with a 38.6% share in 2023, supported by advanced healthcare infrastructure and strong regulatory oversight. Asia-Pacific is projected to post the highest CAGR through 2033, driven by rising healthcare expenditure, government-led awareness campaigns, and expanding transplant centers in India and China.
Type Analysis
Organ transplantation continues to dominate the global transplantation market in 2025, accounting for more than 70% of total revenue. The segment’s strength is linked to the rising prevalence of chronic kidney, liver, and heart diseases, which together represent the majority of global transplant demand. According to the Global Observatory on Donation and Transplantation, over 150,000 solid organ transplants are now performed annually, yet this still meets less than 15% of global need. Advances in surgical techniques, organ preservation, and donor-recipient matching have expanded eligibility and improved survival rates, reinforcing the segment’s leadership.
Tissue transplantation, while smaller in absolute value, is projected to grow at a faster pace through 2033. Applications in wound healing, reconstructive surgery, and orthopedic procedures are driving adoption. Skin grafts and bone grafts remain the most widely used, but research in bioengineered tissues and 3D bioprinting is accelerating. Clinical trials in Europe and Asia-Pacific are testing bioprinted cartilage and corneal tissues, signaling a shift toward scalable alternatives to donor-derived grafts. This segment is expected to capture a rising share of investment as regenerative medicine advances.
Product Type Analysis
Tissue products accounted for more than 43% of global revenue in 2025, supported by high demand for skin, bone, corneal, and vascular grafts. Burn treatment and reconstructive procedures remain the largest applications, particularly in Asia-Pacific where trauma-related cases are rising. The segment benefits from established clinical use and relatively lower regulatory hurdles compared to organ transplantation.
Immunosuppressive drugs are expected to record the fastest growth over the forecast period. Every organ transplant requires lifelong immunosuppression, and the global patient base continues to expand. Newer therapies, such as calcineurin inhibitor alternatives and biologics, are reducing infection risks and improving long-term graft survival. Companies including Novartis and Astellas are investing heavily in next-generation immunomodulators, positioning this segment for sustained double-digit growth.
Preservation solutions remain a critical enabler of successful transplantation. Advances in hypothermic and normothermic perfusion technologies are extending organ viability from hours to days, reducing wastage and enabling cross-border sharing. The segment is forecast to grow steadily as adoption of machine perfusion systems increases in North America and Europe.
End-Use Analysis
Hospitals remain the primary end-users, accounting for nearly 39% of global revenue in 2025. They serve as the central hubs for transplant surgeries, post-operative care, and long-term patient monitoring. Large academic hospitals in the United States, Germany, and Japan continue to lead in procedure volumes and clinical outcomes.
Transplant centers are gaining prominence, particularly in emerging markets. Dedicated facilities in India, China, and Brazil are expanding capacity to address growing demand, supported by government initiatives and international collaborations. These centers are expected to capture a rising share of procedures as specialized infrastructure improves.
Other healthcare providers, including specialty clinics and research institutions, contribute to the ecosystem by supporting tissue banking, donor screening, and experimental therapies. Their role is expanding as clinical trials in regenerative medicine and bioartificial organs move closer to commercialization.
Regional Analysis
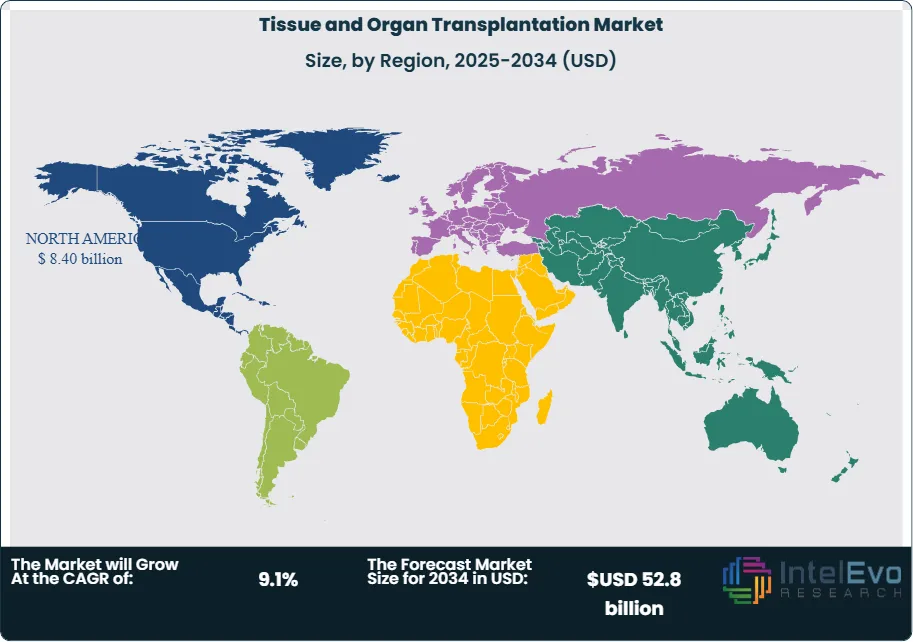
North America remains the largest regional market, representing more than 38% of global revenue in 2025. The region benefits from advanced healthcare infrastructure, high donor registration rates, and strong reimbursement frameworks. The United States alone performs over 40,000 organ transplants annually, supported by organizations such as UNOS and OPTN.
Europe follows closely, with Germany, Spain, and the UK leading in transplant volumes. Spain continues to report the world’s highest organ donation rate at over 45 donors per million population. The region’s strong regulatory framework and cross-border organ sharing through Eurotransplant enhance efficiency and outcomes.
Asia-Pacific is the fastest-growing region, projected to expand at a CAGR above 11% through 2033. Rising healthcare expenditure, government-led awareness campaigns, and expanding transplant centers in China and India are driving growth. However, donor shortages remain a constraint, creating opportunities for bioengineered tissues and artificial organ research.
Latin America and the Middle East & Africa represent smaller shares but are gradually expanding. Brazil leads in Latin America with a well-established public transplant system, while Saudi Arabia and South Africa are emerging hubs in their respective regions. These markets are expected to attract investment as healthcare infrastructure strengthens and awareness of organ donation increases.
Customization for segments, region/country-level will be provided. Moreover, additional customization can be done based on the requirements.
Pricing and Purchase Options
Avail customized purchase options to meet your exact research needs. We have three licenses to opt for: Single User License, Multi-User License (Up to 5 Users), Corporate Use License (Unlimited User and Printable PDF).
TABLE OF CONTENTS
1. EXECUTIVE SUMMARY
1.1. MARKET SNAPSHOT
1.2. KEY FINDINGS & INSIGHTS
1.3. ANALYST RECOMMENDATIONS
1.4. FUTURE OUTLOOK
2. RESEARCH METHODOLOGY
2.1. MARKET DEFINITION & SCOPE
2.2. RESEARCH OBJECTIVES: PRIMARY & SECONDARY DATA SOURCES
2.3. DATA COLLECTION SOURCES
2.3.1. COVERAGE OF 100+ PRIMARY RESEARCH/CONSULTATION CALLS WITH INDUSTRY STAKEHOLDERS
FIGURE 17 NORTH AMERICA TISSUE AND ORGAN TRANSPLANTATION CURRENT AND FUTURE TYPE ANALYSIS, 2025–2034, (USD MILLION)
FIGURE 18 NORTH AMERICA TISSUE AND ORGAN TRANSPLANTATION CURRENT AND FUTURE END USER ANALYSIS, 2025–2034, (USD MILLION)
FIGURE 19 MARKET SHARE BY COUNTRY
FIGURE 20 LATIN AMERICA TISSUE AND ORGAN TRANSPLANTATION CURRENT AND FUTURE TYPE ANALYSIS, 2025–2034, (USD MILLION)
FIGURE 21 LATIN AMERICA TISSUE AND ORGAN TRANSPLANTATION CURRENT AND FUTURE END USER ANALYSIS, 2025–2034, (USD MILLION)
FIGURE 22 MARKET SHARE BY COUNTRY
FIGURE 23 EASTERN EUROPE TISSUE AND ORGAN TRANSPLANTATION CURRENT AND FUTURE TYPE ANALYSIS, 2025–2034, (USD MILLION)
FIGURE 24 EASTERN EUROPE TISSUE AND ORGAN TRANSPLANTATION CURRENT AND FUTURE END USER ANALYSIS, 2025–2034, (USD MILLION)
FIGURE 25 MARKET SHARE BY COUNTRY
FIGURE 26 WESTERN EUROPE TISSUE AND ORGAN TRANSPLANTATION CURRENT AND FUTURE TYPE ANALYSIS, 2025–2034, (USD MILLION)
FIGURE 27 WESTERN EUROPE TISSUE AND ORGAN TRANSPLANTATION CURRENT AND FUTURE END USER ANALYSIS, 2025–2034, (USD MILLION)
FIGURE 28 MARKET SHARE BY COUNTRY
FIGURE 29 EAST ASIA AND PACIFIC TISSUE AND ORGAN TRANSPLANTATION CURRENT AND FUTURE TYPE ANALYSIS, 2025–2034, (USD MILLION)
FIGURE 30 EAST ASIA AND PACIFIC TISSUE AND ORGAN TRANSPLANTATION CURRENT AND FUTURE END USER ANALYSIS, 2025–2034, (USD MILLION)
FIGURE 31 MARKET SHARE BY COUNTRY
FIGURE 32 SEA AND SOUTH ASIA TISSUE AND ORGAN TRANSPLANTATION CURRENT AND FUTURE TYPE ANALYSIS, 2025–2034, (USD MILLION)
FIGURE 33 SEA AND SOUTH ASIA TISSUE AND ORGAN TRANSPLANTATION CURRENT AND FUTURE END USER ANALYSIS, 2025–2034, (USD MILLION)
FIGURE 34 MARKET SHARE BY COUNTRY
FIGURE 35 MIDDLE EAST AND AFRICA TISSUE AND ORGAN TRANSPLANTATION CURRENT AND FUTURE TYPE ANALYSIS, 2025–2034, (USD MILLION)
FIGURE 36 MIDDLE EAST AND AFRICA TISSUE AND ORGAN TRANSPLANTATION CURRENT AND FUTURE END USER ANALYSIS, 2025–2034, (USD MILLION)
FIGURE 37 NORTH AMERICA TISSUE AND ORGAN TRANSPLANTATION CURRENT AND FUTURE MARKET VOLUME SHARE REGIONAL ANALYSIS, 2025–2034, (USD MILLION)
FIGURE 38 U.S. TISSUE AND ORGAN TRANSPLANTATION CURRENT AND FUTURE TYPE ANALYSIS, 2025–2034, (USD MILLION)
FIGURE 39 U.S. TISSUE AND ORGAN TRANSPLANTATION CURRENT AND FUTURE END USER ANALYSIS, 2025–2034, (USD MILLION)
FIGURE 40 CANADA TISSUE AND ORGAN TRANSPLANTATION CURRENT AND FUTURE TYPE ANALYSIS, 2025–2034, (USD MILLION)
FIGURE 41 CANADA TISSUE AND ORGAN TRANSPLANTATION CURRENT AND FUTURE END USER ANALYSIS, 2025–2034, (USD MILLION)
FIGURE 42 LATIN AMERICA TISSUE AND ORGAN TRANSPLANTATION CURRENT AND FUTURE MARKET VOLUME SHARE REGIONAL ANALYSIS, 2025–2034, (USD MILLION)
FIGURE 43 MEXICO TISSUE AND ORGAN TRANSPLANTATION CURRENT AND FUTURE TYPE ANALYSIS, 2025–2034, (USD MILLION)
FIGURE 44 MEXICO TISSUE AND ORGAN TRANSPLANTATION CURRENT AND FUTURE END USER ANALYSIS, 2025–2034, (USD MILLION)
FIGURE 45 BRAZIL TISSUE AND ORGAN TRANSPLANTATION CURRENT AND FUTURE TYPE ANALYSIS, 2025–2034, (USD MILLION)
FIGURE 46 BRAZIL TISSUE AND ORGAN TRANSPLANTATION CURRENT AND FUTURE END USER ANALYSIS, 2025–2034, (USD MILLION)
FIGURE 47 ARGENTINA TISSUE AND ORGAN TRANSPLANTATION CURRENT AND FUTURE TYPE ANALYSIS, 2025–2034, (USD MILLION)
FIGURE 48 ARGENTINA TISSUE AND ORGAN TRANSPLANTATION CURRENT AND FUTURE END USER ANALYSIS, 2025–2034, (USD MILLION)
FIGURE 49 COLUMBIA TISSUE AND ORGAN TRANSPLANTATION CURRENT AND FUTURE TYPE ANALYSIS, 2025–2034, (USD MILLION)
FIGURE 50 COLUMBIA TISSUE AND ORGAN TRANSPLANTATION CURRENT AND FUTURE END USER ANALYSIS, 2025–2034, (USD MILLION)
FIGURE 51 REST OF LATIN AMERICA TISSUE AND ORGAN TRANSPLANTATION CURRENT AND FUTURE TYPE ANALYSIS, 2025–2034, (USD MILLION)
FIGURE 52 REST OF LATIN AMERICA TISSUE AND ORGAN TRANSPLANTATION CURRENT AND FUTURE END USER ANALYSIS, 2025–2034, (USD MILLION)
FIGURE 53 EASTERN EUROPE TISSUE AND ORGAN TRANSPLANTATION CURRENT AND FUTURE MARKET VOLUME SHARE REGIONAL ANALYSIS, 2025–2034, (USD MILLION)
FIGURE 54 POLAND TISSUE AND ORGAN TRANSPLANTATION CURRENT AND FUTURE TYPE ANALYSIS, 2025–2034, (USD MILLION)
FIGURE 55 POLAND TISSUE AND ORGAN TRANSPLANTATION CURRENT AND FUTURE END USER ANALYSIS, 2025–2034, (USD MILLION)
FIGURE 56 RUSSIA TISSUE AND ORGAN TRANSPLANTATION CURRENT AND FUTURE TYPE ANALYSIS, 2025–2034, (USD MILLION)
FIGURE 57 RUSSIA TISSUE AND ORGAN TRANSPLANTATION CURRENT AND FUTURE END USER ANALYSIS, 2025–2034, (USD MILLION)
FIGURE 58 CZECH REPUBLIC TISSUE AND ORGAN TRANSPLANTATION CURRENT AND FUTURE TYPE ANALYSIS, 2025–2034, (USD MILLION)
FIGURE 59 CZECH REPUBLIC TISSUE AND ORGAN TRANSPLANTATION CURRENT AND FUTURE END USER ANALYSIS, 2025–2034, (USD MILLION)
FIGURE 60 ROMANIA TISSUE AND ORGAN TRANSPLANTATION CURRENT AND FUTURE TYPE ANALYSIS, 2025–2034, (USD MILLION)
FIGURE 61 ROMANIA TISSUE AND ORGAN TRANSPLANTATION CURRENT AND FUTURE END USER ANALYSIS, 2025–2034, (USD MILLION)
FIGURE 62 REST OF EASTERN EUROPE TISSUE AND ORGAN TRANSPLANTATION CURRENT AND FUTURE TYPE ANALYSIS, 2025–2034, (USD MILLION)
FIGURE 63 REST OF EASTERN EUROPE TISSUE AND ORGAN TRANSPLANTATION CURRENT AND FUTURE END USER ANALYSIS, 2025–2034, (USD MILLION)
FIGURE 64 WESTERN EUROPE TISSUE AND ORGAN TRANSPLANTATION CURRENT AND FUTURE MARKET VOLUME SHARE REGIONAL ANALYSIS, 2025–2034, (USD MILLION)
FIGURE 65 GERMANY TISSUE AND ORGAN TRANSPLANTATION CURRENT AND FUTURE TYPE ANALYSIS, 2025–2034, (USD MILLION)
FIGURE 66 GERMANY TISSUE AND ORGAN TRANSPLANTATION CURRENT AND FUTURE END USER ANALYSIS, 2025–2034, (USD MILLION)
FIGURE 67 FRANCE TISSUE AND ORGAN TRANSPLANTATION CURRENT AND FUTURE TYPE ANALYSIS, 2025–2034, (USD MILLION)
FIGURE 68 FRANCE TISSUE AND ORGAN TRANSPLANTATION CURRENT AND FUTURE END USER ANALYSIS, 2025–2034, (USD MILLION)
FIGURE 69 UK TISSUE AND ORGAN TRANSPLANTATION CURRENT AND FUTURE TYPE ANALYSIS, 2025–2034, (USD MILLION)
FIGURE 70 UK TISSUE AND ORGAN TRANSPLANTATION CURRENT AND FUTURE END USER ANALYSIS, 2025–2034, (USD MILLION)
FIGURE 71 SPAIN TISSUE AND ORGAN TRANSPLANTATION CURRENT AND FUTURE TYPE ANALYSIS, 2025–2034, (USD MILLION)
FIGURE 72 SPAIN TISSUE AND ORGAN TRANSPLANTATION CURRENT AND FUTURE END USER ANALYSIS, 2025–2034, (USD MILLION)
FIGURE 73 ITALY TISSUE AND ORGAN TRANSPLANTATION CURRENT AND FUTURE TYPE ANALYSIS, 2025–2034, (USD MILLION)
FIGURE 74 ITALY TISSUE AND ORGAN TRANSPLANTATION CURRENT AND FUTURE END USER ANALYSIS, 2025–2034, (USD MILLION)
FIGURE 75 REST OF WESTERN EUROPE TISSUE AND ORGAN TRANSPLANTATION CURRENT AND FUTURE TYPE ANALYSIS, 2025–2034, (USD MILLION)
FIGURE 76 REST OF WESTERN EUROPE TISSUE AND ORGAN TRANSPLANTATION CURRENT AND FUTURE END USER ANALYSIS, 2025–2034, (USD MILLION)
FIGURE 77 EAST ASIA AND PACIFIC TISSUE AND ORGAN TRANSPLANTATION CURRENT AND FUTURE MARKET VOLUME SHARE REGIONAL ANALYSIS, 2025–2034, (USD MILLION)
FIGURE 78 CHINA TISSUE AND ORGAN TRANSPLANTATION CURRENT AND FUTURE TYPE ANALYSIS, 2025–2034, (USD MILLION)
FIGURE 79 CHINA TISSUE AND ORGAN TRANSPLANTATION CURRENT AND FUTURE END USER ANALYSIS, 2025–2034, (USD MILLION)
FIGURE 80 JAPAN TISSUE AND ORGAN TRANSPLANTATION CURRENT AND FUTURE TYPE ANALYSIS, 2025–2034, (USD MILLION)
FIGURE 81 JAPAN TISSUE AND ORGAN TRANSPLANTATION CURRENT AND FUTURE END USER ANALYSIS, 2025–2034, (USD MILLION)
FIGURE 82 AUSTRALIA TISSUE AND ORGAN TRANSPLANTATION CURRENT AND FUTURE TYPE ANALYSIS, 2025–2034, (USD MILLION)
FIGURE 83 AUSTRALIA TISSUE AND ORGAN TRANSPLANTATION CURRENT AND FUTURE END USER ANALYSIS, 2025–2034, (USD MILLION)
FIGURE 84 CAMBODIA TISSUE AND ORGAN TRANSPLANTATION CURRENT AND FUTURE TYPE ANALYSIS, 2025–2034, (USD MILLION)
FIGURE 85 CAMBODIA TISSUE AND ORGAN TRANSPLANTATION CURRENT AND FUTURE END USER ANALYSIS, 2025–2034, (USD MILLION)
FIGURE 86 FIJI TISSUE AND ORGAN TRANSPLANTATION CURRENT AND FUTURE TYPE ANALYSIS, 2025–2034, (USD MILLION)
FIGURE 87 FIJI TISSUE AND ORGAN TRANSPLANTATION CURRENT AND FUTURE END USER ANALYSIS, 2025–2034, (USD MILLION)
FIGURE 88 INDONESIA TISSUE AND ORGAN TRANSPLANTATION CURRENT AND FUTURE TYPE ANALYSIS, 2025–2034, (USD MILLION)
FIGURE 89 INDONESIA TISSUE AND ORGAN TRANSPLANTATION CURRENT AND FUTURE END USER ANALYSIS, 2025–2034, (USD MILLION)
FIGURE 90 SOUTH KOREA TISSUE AND ORGAN TRANSPLANTATION CURRENT AND FUTURE TYPE ANALYSIS, 2025–2034, (USD MILLION)
FIGURE 91 SOUTH KOREA TISSUE AND ORGAN TRANSPLANTATION CURRENT AND FUTURE END USER ANALYSIS, 2025–2034, (USD MILLION)
FIGURE 92 REST OF EAST ASIA AND PACIFIC TISSUE AND ORGAN TRANSPLANTATION CURRENT AND FUTURE TYPE ANALYSIS, 2025–2034, (USD MILLION)
FIGURE 93 REST OF EAST ASIA AND PACIFIC TISSUE AND ORGAN TRANSPLANTATION CURRENT AND FUTURE END USER ANALYSIS, 2025–2034, (USD MILLION)
FIGURE 94 SEA AND SOUTH ASIA TISSUE AND ORGAN TRANSPLANTATION CURRENT AND FUTURE MARKET VOLUME SHARE REGIONAL ANALYSIS, 2025–2034, (USD MILLION)
FIGURE 95 BANGLADESH TISSUE AND ORGAN TRANSPLANTATION CURRENT AND FUTURE TYPE ANALYSIS, 2025–2034, (USD MILLION)
FIGURE 96 BANGLADESH TISSUE AND ORGAN TRANSPLANTATION CURRENT AND FUTURE END USER ANALYSIS, 2025–2034, (USD MILLION)
FIGURE 97 NEW ZEALAND TISSUE AND ORGAN TRANSPLANTATION CURRENT AND FUTURE TYPE ANALYSIS, 2025–2034, (USD MILLION)
FIGURE 98 NEW ZEALAND TISSUE AND ORGAN TRANSPLANTATION CURRENT AND FUTURE END USER ANALYSIS, 2025–2034, (USD MILLION)
FIGURE 99 INDIA TISSUE AND ORGAN TRANSPLANTATION CURRENT AND FUTURE TYPE ANALYSIS, 2025–2034, (USD MILLION)
FIGURE 100 INDIA TISSUE AND ORGAN TRANSPLANTATION CURRENT AND FUTURE END USER ANALYSIS, 2025–2034, (USD MILLION)
FIGURE 101 SINGAPORE TISSUE AND ORGAN TRANSPLANTATION CURRENT AND FUTURE TYPE ANALYSIS, 2025–2034, (USD MILLION)
FIGURE 102 SINGAPORE TISSUE AND ORGAN TRANSPLANTATION CURRENT AND FUTURE END USER ANALYSIS, 2025–2034, (USD MILLION)
FIGURE 103 THAILAND TISSUE AND ORGAN TRANSPLANTATION CURRENT AND FUTURE TYPE ANALYSIS, 2025–2034, (USD MILLION)
FIGURE 104 THAILAND TISSUE AND ORGAN TRANSPLANTATION CURRENT AND FUTURE END USER ANALYSIS, 2025–2034, (USD MILLION)
FIGURE 105 TAIWAN TISSUE AND ORGAN TRANSPLANTATION CURRENT AND FUTURE TYPE ANALYSIS, 2025–2034, (USD MILLION)
FIGURE 106 TAIWAN TISSUE AND ORGAN TRANSPLANTATION CURRENT AND FUTURE END USER ANALYSIS, 2025–2034, (USD MILLION)
FIGURE 107 MALAYSIA TISSUE AND ORGAN TRANSPLANTATION CURRENT AND FUTURE TYPE ANALYSIS, 2025–2034, (USD MILLION)
FIGURE 108 MALAYSIA TISSUE AND ORGAN TRANSPLANTATION CURRENT AND FUTURE END USER ANALYSIS, 2025–2034, (USD MILLION)
FIGURE 109 REST OF SEA AND SOUTH ASIA TISSUE AND ORGAN TRANSPLANTATION CURRENT AND FUTURE TYPE ANALYSIS, 2025–2034, (USD MILLION)
FIGURE 110 REST OF SEA AND SOUTH ASIA TISSUE AND ORGAN TRANSPLANTATION CURRENT AND FUTURE END USER ANALYSIS, 2025–2034, (USD MILLION)
FIGURE 111 MIDDLE EAST AND AFRICA TISSUE AND ORGAN TRANSPLANTATION CURRENT AND FUTURE MARKET VOLUME SHARE REGIONAL ANALYSIS, 2025–2034, (USD MILLION)
FIGURE 112 GCC COUNTRIES TISSUE AND ORGAN TRANSPLANTATION CURRENT AND FUTURE TYPE ANALYSIS, 2025–2034, (USD MILLION)
FIGURE 113 GCC COUNTRIES TISSUE AND ORGAN TRANSPLANTATION CURRENT AND FUTURE END USER ANALYSIS, 2025–2034, (USD MILLION)
FIGURE 114 SAUDI ARABIA TISSUE AND ORGAN TRANSPLANTATION CURRENT AND FUTURE TYPE ANALYSIS, 2025–2034, (USD MILLION)
FIGURE 115 SAUDI ARABIA TISSUE AND ORGAN TRANSPLANTATION CURRENT AND FUTURE END USER ANALYSIS, 2025–2034, (USD MILLION)
FIGURE 116 UAE TISSUE AND ORGAN TRANSPLANTATION CURRENT AND FUTURE TYPE ANALYSIS, 2025–2034, (USD MILLION)
FIGURE 117 UAE TISSUE AND ORGAN TRANSPLANTATION CURRENT AND FUTURE END USER ANALYSIS, 2025–2034, (USD MILLION)
FIGURE 118 BAHRAIN TISSUE AND ORGAN TRANSPLANTATION CURRENT AND FUTURE TYPE ANALYSIS, 2025–2034, (USD MILLION)
FIGURE 119 BAHRAIN TISSUE AND ORGAN TRANSPLANTATION CURRENT AND FUTURE END USER ANALYSIS, 2025–2034, (USD MILLION)
FIGURE 120 KUWAIT TISSUE AND ORGAN TRANSPLANTATION CURRENT AND FUTURE TYPE ANALYSIS, 2025–2034, (USD MILLION)
FIGURE 121 KUWAIT TISSUE AND ORGAN TRANSPLANTATION CURRENT AND FUTURE END USER ANALYSIS, 2025–2034, (USD MILLION)
FIGURE 122 OMAN TISSUE AND ORGAN TRANSPLANTATION CURRENT AND FUTURE TYPE ANALYSIS, 2025–2034, (USD MILLION)
FIGURE 123 OMAN TISSUE AND ORGAN TRANSPLANTATION CURRENT AND FUTURE END USER ANALYSIS, 2025–2034, (USD MILLION)
FIGURE 124 QATAR TISSUE AND ORGAN TRANSPLANTATION CURRENT AND FUTURE TYPE ANALYSIS, 2025–2034, (USD MILLION)
FIGURE 125 QATAR TISSUE AND ORGAN TRANSPLANTATION CURRENT AND FUTURE END USER ANALYSIS, 2025–2034, (USD MILLION)
FIGURE 126 EGYPT TISSUE AND ORGAN TRANSPLANTATION CURRENT AND FUTURE TYPE ANALYSIS, 2025–2034, (USD MILLION)
FIGURE 127 EGYPT TISSUE AND ORGAN TRANSPLANTATION CURRENT AND FUTURE END USER ANALYSIS, 2025–2034, (USD MILLION)
FIGURE 128 NIGERIA TISSUE AND ORGAN TRANSPLANTATION CURRENT AND FUTURE TYPE ANALYSIS, 2025–2034, (USD MILLION)
FIGURE 129 NIGERIA TISSUE AND ORGAN TRANSPLANTATION CURRENT AND FUTURE END USER ANALYSIS, 2025–2034, (USD MILLION)
FIGURE 130 SOUTH AFRICA TISSUE AND ORGAN TRANSPLANTATION CURRENT AND FUTURE TYPE ANALYSIS, 2025–2034, (USD MILLION)
FIGURE 131 SOUTH AFRICA TISSUE AND ORGAN TRANSPLANTATION CURRENT AND FUTURE END USER ANALYSIS, 2025–2034, (USD MILLION)
FIGURE 132 ISRAEL TISSUE AND ORGAN TRANSPLANTATION CURRENT AND FUTURE TYPE ANALYSIS, 2025–2034, (USD MILLION)
FIGURE 133 ISRAEL TISSUE AND ORGAN TRANSPLANTATION CURRENT AND FUTURE END USER ANALYSIS, 2025–2034, (USD MILLION)
FIGURE 134 REST OF MEA TISSUE AND ORGAN TRANSPLANTATION CURRENT AND FUTURE TYPE ANALYSIS, 2025–2034, (USD MILLION)
FIGURE 135 REST OF MEA TISSUE AND ORGAN TRANSPLANTATION CURRENT AND FUTURE END USER ANALYSIS, 2025–2034, (USD MILLION)
FIGURE 136 U. S. MARKET SHARE ANALYSIS BY TYPE (2024)
FIGURE 137 U. S. MARKET SHARE ANALYSIS BY END USER (2024)
FIGURE 138 CANADA MARKET SHARE ANALYSIS BY TYPE (2024)
FIGURE 139 CANADA MARKET SHARE ANALYSIS BY END USER (2024)
FIGURE 140 MEXICO MARKET SHARE ANALYSIS BY TYPE (2024)
FIGURE 141 MEXICO MARKET SHARE ANALYSIS BY END USER (2024)
FIGURE 142 CHINA MARKET SHARE ANALYSIS BY TYPE (2024)
FIGURE 143 CHINA MARKET SHARE ANALYSIS BY END USER (2024)
FIGURE 144 JAPAN MARKET SHARE ANALYSIS BY TYPE (2024)
FIGURE 145 JAPAN MARKET SHARE ANALYSIS BY END USER (2024)
FIGURE 146 INDIA MARKET SHARE ANALYSIS BY TYPE (2024)
FIGURE 147 INDIA MARKET SHARE ANALYSIS BY END USER (2024)
FIGURE 148 SOUTH KOREA MARKET SHARE ANALYSIS BY TYPE (2024)
FIGURE 149 SOUTH KOREA MARKET SHARE ANALYSIS BY END USER (2024)
FIGURE 150 SAUDI ARABIA MARKET SHARE ANALYSIS BY TYPE (2024)
FIGURE 151 SAUDI ARABIA MARKET SHARE ANALYSIS BY END USER (2024)
FIGURE 152 UAE MARKET SHARE ANALYSIS BY TYPE (2024)
FIGURE 153 UAE MARKET SHARE ANALYSIS BY END USER (2024)
FIGURE 154 EGYPT MARKET SHARE ANALYSIS BY TYPE (2024)
FIGURE 155 EGYPT MARKET SHARE ANALYSIS BY END USER (2024)
FIGURE 156 NIGERIA MARKET SHARE ANALYSIS BY TYPE (2024)
FIGURE 157 NIGERIA MARKET SHARE ANALYSIS BY END USER (2024)
FIGURE 158 SOUTH AFRICA MARKET SHARE ANALYSIS BY TYPE (2024)
FIGURE 159 SOUTH AFRICA MARKET SHARE ANALYSIS BY END USER (2024)
FIGURE 160 GERMANY MARKET SHARE ANALYSIS BY TYPE (2024)
FIGURE 161 GERMANY MARKET SHARE ANALYSIS BY END USER (2024)
FIGURE 162 FRANCE MARKET SHARE ANALYSIS BY TYPE (2024)
FIGURE 163 FRANCE MARKET SHARE ANALYSIS BY END USER (2024)
FIGURE 164 UK MARKET SHARE ANALYSIS BY TYPE (2024)
FIGURE 165 UK MARKET SHARE ANALYSIS BY END USER (2024)
FIGURE 166 SPAIN MARKET SHARE ANALYSIS BY TYPE (2024)
FIGURE 167 SPAIN MARKET SHARE ANALYSIS BY END USER (2024)
FIGURE 168 ITALY MARKET SHARE ANALYSIS BY TYPE (2024)
FIGURE 169 ITALY MARKET SHARE ANALYSIS BY END USER (2024)
FIGURE 170 BRAZIL MARKET SHARE ANALYSIS BY TYPE (2024)
FIGURE 171 BRAZIL MARKET SHARE ANALYSIS BY END USER (2024)
FIGURE 172 ARGENTINA MARKET SHARE ANALYSIS BY TYPE (2024)
FIGURE 173 ARGENTINA MARKET SHARE ANALYSIS BY END USER (2024)
FIGURE 174 COLUMBIA MARKET SHARE ANALYSIS BY TYPE (2024)
FIGURE 175 COLUMBIA MARKET SHARE ANALYSIS BY END USER (2024)
FIGURE 176 GLOBAL TISSUE AND ORGAN TRANSPLANTATION CURRENT AND FUTURE MARKET KEY COUNTRY LEVEL ANALYSIS, 2024–2034, (USD MILLION)
FIGURE 177 FINANCIAL OVERVIEW:
Key Player Analysis
Cryolife Inc.: Cryolife positions as a leader in cardiac and vascular preservation solutions within transplantation-adjacent markets. Its portfolio includes preserved human cardiac and vascular tissues, aortic repair devices, and cryopreservation services used across transplant centers and cardiovascular surgery programs. In 2025, the company is focusing on perfusion-compatible preservation media and expanding tissue banking capacity to meet rising demand. Reported double-digit growth in preserved graft shipments and expanded supply agreements with large hospital systems strengthen its footprint in North America and Europe.
Strategically, Cryolife is investing in R&D for extended viability grafts and digital traceability tools that integrate with hospital EMRs. Partnerships with organ procurement organizations and accreditation bodies reinforce compliance and quality. Differentiators include long-standing regulatory certifications, robust donor screening protocols, and a diversified cardiac-focused catalog. The company’s emphasis on cost control and reliable logistics supports adoption by high-volume centers, positioning it well as machine perfusion adoption increases across transplant networks.
Folio Biosciences: Folio Biosciences is a niche player specializing in tissue products and biologics for wound healing, reconstructive surgery, and ophthalmic use. The portfolio spans skin substitutes, decellularized dermal matrices, and corneal tissue products used in high-throughput clinical settings. In 2025, management is prioritizing scale-up of GMP manufacturing and regional tissue bank partnerships to address growing demand in Asia-Pacific and the Middle East. The company reports strong order growth from burn centers and ophthalmology networks, with tissue product revenue growing at a high single-digit CAGR.
Strategic moves center on process automation, traceability, and cold-chain reliability. Folio is piloting AI-supported donor screening and QC analytics to reduce variability and improve lot release times. Differentiators include rapid fulfillment, competitive pricing, and flexible product formats suitable for both inpatient and ambulatory care. Its distribution strength in emerging markets and tight alignment with clinical guidelines make it a preferred supplier where access to donor-derived grafts is constrained.
Atthrex: Atthrex operates as a challenger in musculoskeletal transplantation and orthopedic augmentation, focusing on bone grafts, allograft matrices, and fixation systems used in reconstructive procedures. The company targets high-growth applications in spine, sports medicine, and trauma, where tissue augmentation reduces complications and speeds recovery. In 2025, Atthrex is expanding surgeon education programs and launching data-backed outcomes registries to support adoption. Revenue from tissue augmentation kits is tracking high single-digit growth, aided by hospital purchasing contracts and bundled pricing.
The firm is investing in bioactive coatings, sterilization improvements, and standardized graft processing to enhance integration and reduce infection risks. Strategic partnerships with tissue banks and robotics vendors align its portfolio with minimally invasive techniques. Differentiators include surgeon-centric product ecosystems, strong relationships with orthopedic departments, and evidence-based marketing. Atthrex’s ability to pair implants with tissue solutions positions it competitively in procedure-driven markets that value predictable outcomes and cost efficiency.
Abbvie Inc.: AbbVie is a leader in immunology with growing relevance to transplantation through targeted immunosuppressive and immunomodulatory therapies. While the company’s core revenue base is broader, its pipeline in calcineurin-sparing regimens and biologics for graft maintenance is increasingly important to transplant centers seeking lower infection and nephrotoxicity profiles. In 2025, AbbVie is pursuing label expansions, real-world evidence studies, and payer engagement to improve access. The company reports steady mid-single-digit growth in immunology and is investing in companion diagnostics to personalize dosing and monitor rejection risk.
Strategically, AbbVie is integrating AI-driven pharmacovigilance and patient monitoring to support long-term graft survival. Partnerships with academic transplant programs and registry collaborators enhance clinical data depth. Differentiators include robust manufacturing capacity, global market access, and disciplined pricing strategies tailored to hospital formularies. For you as an investor, AbbVie’s scale, regulatory expertise, and data-backed outcomes provide a defensible position as centers shift to precision immunosuppression and value-based care.
As of 2025, the global tissue and organ transplantation market is growing at a rate of 9.5% per year, mainly due to fast advancements in medical and surgical technologies. Innovations like normothermic and hypothermic machine perfusion are changing how we preserve organs by extending their viability from a few hours to several days. This progress significantly lowers organ waste and allows for long-distance and cross-border transplants. At the same time, better surgical robotics and minimally invasive techniques are improving success rates and reducing complications after surgery.
Rising Awareness and Expansion of Donor Registries
Another major factor is the continued rise in awareness about organ donation and increased registration. Government campaigns, digital donor registries, and opt-out donation policies in parts of Europe have expanded the number of donors and improved efficiency in procurement. Better immunology and targeted immunosuppressive therapies are also enhancing graft survival and patient outcomes, increasing physicians' confidence in transplantation as a long-term solution. Together, these factors are boosting procedural volumes and supporting revenue growth for hospitals, transplant centers, and associated technology providers.
Restraint
Persistent Organ Supply and Demand Imbalance
Despite these technological advancements, there remains a critical shortage of donor organs. Less than 15% of patients on organ transplant waiting lists get organs each year, leading to long wait times and high mortality rates. This imbalance directly limits the number of procedures, hindering market growth even in areas with advanced healthcare systems. The lack of compatible donors is especially severe for heart, lung, and liver transplants, where clinical urgency is highest.
High Costs and Regulatory Complexity
Cost barriers also limit adoption, particularly in developing regions. In the United States, the average cost of a single organ transplant can surpass USD 400,000, including surgery, hospitalization, and lifelong immunosuppressive therapy. Limited insurance coverage and reimbursement differences restrict access in lower-income countries. Additionally, ethical concerns, regulatory scrutiny, and long approval times slow the adoption of experimental solutions such as xenotransplantation and stem cell-derived tissues, creating uncertainty for manufacturers and investors.
Opportunity
Emergence of Xenotransplantation and Genetic Engineering
The most promising growth opportunity lies in technologies aimed at overcoming donor shortages. Xenotransplantation, supported by CRISPR-based genetic modification of animal organs, is moving closer to clinical use. Early-stage trials in the United States and China have shown short-term functional success, indicating potential commercialization in the next decade. If approved, xenotransplantation could lead to a multi-billion-dollar expansion by greatly increasing the availability of organs.
Growth of Regenerative Medicine and Medical Tourism
Regenerative medicine and 3D bioprinting represent another area of rapid growth. Bioengineered tissues, stem cell-based grafts, and lab-grown organs are advancing from research to early clinical applications, with the overall regenerative medicine market expected to exceed USD 10 billion by 2030. At the same time, transplant tourism is growing in Asia-Pacific and Latin America, where lower costs and shorter waiting times attract international patients. These trends create varied revenue opportunities beyond traditional donor-based transplantation.
Trend
Digitalization of Transplant Ecosystems
Digital integration is changing transplantation workflows in 2025. Artificial intelligence is increasingly used for matching donors and recipients, assessing risk, and predictive analytics, which improves allocation accuracy and post-transplant results. AI-based monitoring platforms allow for early detection of graft rejection and complications, reducing hospital readmissions and long-term treatment costs. These tools are becoming essential to modern transplant programs.
Shift Toward Personalized and Transparent Transplant Care
Personalized medicine is becoming a key trend, with genomic profiling guiding immunosuppressive treatments and boosting long-term graft survival. At the same time, blockchain-based registries are being tested to improve transparency in organ allocation and fight illegal trafficking. Collaborative international research networks are speeding up innovation by sharing data, biobanks, and clinical insights. Together, these trends indicate a move toward more precise, accountable, and technology-driven transplantation systems, reshaping competitive advantages in the market.
Recent Developments
Feb 2025 – Terumo Corporation: Made a strategic investment in OrganOx, a University of Oxford spinout company specializing in organ preservation technology. This initial partnership and financial backing paved the way for a full acquisition later in the year, signaling Terumo's early strategic interest in the advanced organ preservation market.
Aug 2025 – Terumo Medical Corporation: Announced a definitive agreement to acquire OrganOx in a landmark deal valued at approximately $1.5 billion. The acquisition brings OrganOx's 'metra' platform, a system for normothermic machine perfusion that has been shown to reduce liver discard rates by half, into Terumo's portfolio. This transaction marks Terumo’s formal entry into the organ transplant sector, positioning the company to address critical organ shortages by improving the viability and transport of donor organs.