Trampoline Park Market Size & CAGR 2025–2034 | CAGR 16.2%
Global Trampoline Park Market Size, Share & Indoor Entertainment Analysis By Park Type (Indoor, Hybrid), By Revenue Stream (Tickets, Parties, Fitness), By Age Group, Franchise Expansion Trends, Regional Outlook, Key Operators & Forecast 2025–2034
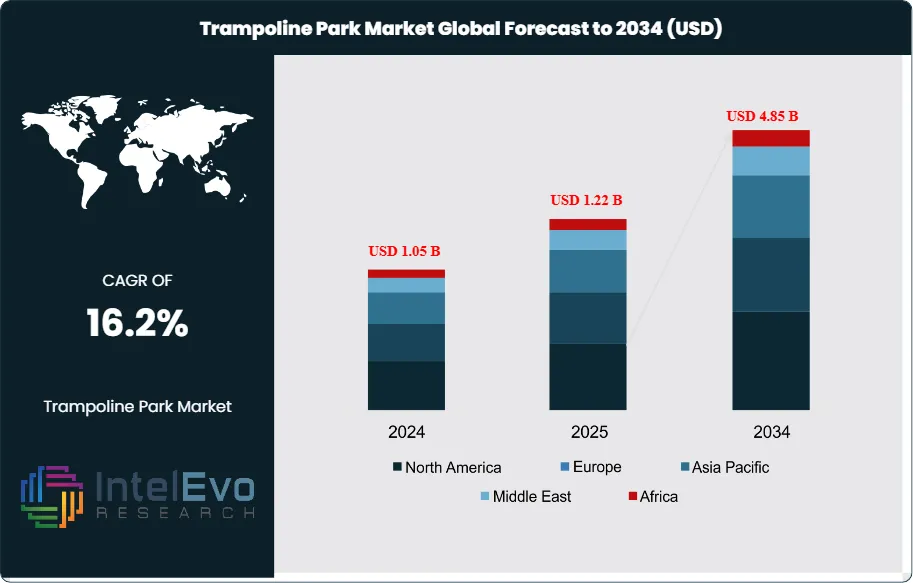
The Trampoline Park Market is estimated at USD 1.05 billion in 2024 and is projected to reach approximately USD 4.85 billion by 2034, registering a robust CAGR of about 16.2% during 2025–2034. This strong growth trajectory is supported by rising consumer preference for experience-based entertainment, increasing urban youth populations, and the expansion of family-oriented indoor recreation venues. The market is further benefiting from franchise-led rollouts, integration of fitness and wellness programs, and growing demand for safe, weather-independent leisure activities across North America, Europe, and emerging Asia-Pacific markets.
The sector has scaled from a niche entertainment format to a mainstream indoor leisure choice. You see steady capacity additions in urban and suburban catchments as operators co-locate with malls and family entertainment centers. Revenue models have widened. Day tickets, party packages, memberships, and corporate bookings diversify cash flows. Average ticket prices range from USD 12 to USD 25 across major markets, with weekend utilization typically more than twice weekday levels.
Demand grows on two fronts. Parents and schools seek active recreation that counters screen time and supports fitness. Young adults value social, group-based activities. Operators report strong party bookings, often contributing roughly one-third of location revenue. The pipeline benefits from a stable capex-to-payback equation in mid-size parks. Risks remain clear. Safety and liability shape public perception and insurance costs. Published data place injury rates at 1.14 per 1,000 jumper hours, with higher incidence among children. Compliance matters. Australian research shows a 0.72 percent monthly reduction in injury rates among parks adhering to formal safety guidelines. Standards such as ASTM F2970 in the United States and PAS 5000 in the United Kingdom guide design, operations, and inspections. Consistent execution reduces severe incidents and protects brand trust.
Technology now underpins throughput, safety, and yield. Online booking, timed sessions, and variable pricing smooth peaks and raise utilization. RFID wristbands and cashless POS tighten access control and spend capture. Computer vision and AI-assisted monitoring help staff enforce rules in real time and analyze near-miss patterns. Mobile waivers, digital leaderboards, and gamified scoring increase engagement and repeat visits. You should view these tools as core operating infrastructure, not add-ons.
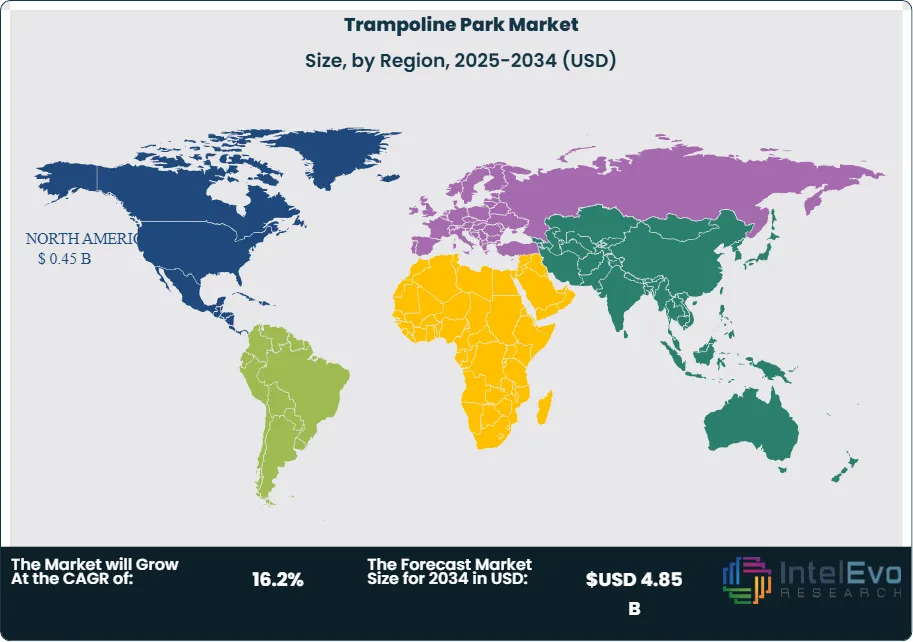
Regional dynamics set the investment map. North America leads with an estimated 40 to 45 percent revenue share in 2023, supported by large-format sites and strong party economics. Europe follows at roughly 25 to 30 percent, with ongoing safety standard adoption. Asia Pacific is the fastest-growing region, with double-digit growth led by China, India, and Southeast Asia. The Middle East expands through mall-led destinations. Watch secondary cities in North America and Europe, and tier 2 locations in Asia, where rents are lower and catchments remain underpenetrated.
Key Takeaways
Market Growth: The market stands at USD 1.05 billion in 2024 and will reach USD USD 4.85 billion by 2034. You should plan for a 16.2% CAGR driven by indoor entertainment demand, party packages, and group bookings.
Type: Indoor parks hold a 90.4% share. All‑weather operations, mall co-location, and controlled safety environments sustain higher utilization and repeat visits.
End User: Adults account for 60.6% of spend. Corporate events, fitness sessions, and social group outings lift average basket sizes versus child-only visits.
Driver: Structured safety standards and better operations support growth. Parks adhering to formal guidelines recorded a 0.72% monthly decline in injury rates, improving consumer confidence and insurance outcomes.
Restraint: Safety incidents and liability remain material. Injury rates average 1.14 per 1,000 jumper hours, with higher incidence among children, which pressures premiums and risk management costs.
Opportunity: Asia Pacific offers the fastest scale-up with an estimated 16–18% CAGR to 2033. The region could exceed USD 1.1 billion by 2033 as tier 2 city openings accelerate and family entertainment centers expand.
Trend: Digital tools are reshaping throughput and yield. Online booking and timed sessions lift weekend utilization; RFID access and AI monitoring improve rule enforcement and reduce severe incidents.
Regional Analysis: North America leads with 42.5% revenue share in 2023 on strong party economics and large-format sites. Europe follows at roughly 25–30%, while Asia Pacific outpaces peers in growth; the Middle East expands via mall-anchored destinations.
Type Analysis
Indoor parks remain the core of the market. They held 90.4% share in 2023 and continue to exceed 89% in 2025 as openings concentrate in malls and family entertainment centers. Year-round climate control, standardized layouts, and multi-attraction formats widen appeal across age groups. You see stronger weekend throughput and higher party conversion. Party and group events typically account for 25% to 35% of site revenue, which anchors cash flow in mature locations.
Operators invest in safety systems and digital tools to protect that position. ASTM F2970 and PAS 5000 guide design and operations. Parks that implement formal protocols have recorded a 0.72% monthly decline in injury rates, which lowers risk and supports insurance terms. Booking engines, timed sessions, and cashless payments raise utilization and basket sizes. Leading chains include Sky Zone, Urban Air, Flip Out, and Bounce Inc.
Outdoor parks remain a niche. Weather dependence and shorter seasons cap utilization. Share stays in the single digits, with better traction in warm climates such as the U.S. Sun Belt and the GCC. Growth focuses on seasonal pop-ups and municipal partnerships. Capital needs are lower, but yields vary with climate and footfall.
End-User Analysis
Adults lead demand and spending. They accounted for 60.6% share in 2023 and remain the largest cohort in 2025 as corporate events, fitness sessions, and social group outings expand. Adult visits drive higher average spend through all-access passes, food and beverage, and premium attractions. Operators that program adult-only hours and corporate packages see stronger weekday monetization.
Children form a sizable second segment anchored by birthdays, school groups, and camps. Injury incidence averages 1.14 per 1,000 jumper hours, with a higher share among children. Consistent supervision, age-zoned courts, and staffed rules enforcement reduce severe incidents. As safety compliance improves, parent confidence rises and repeat bookings increase. You should align pricing and programming to family peak times and school calendars.
Regional Analysis
North America remains the largest market with about 42.5% revenue share in 2023 and a similar range in 2025. The region benefits from large-format sites, strong party economics, and high card penetration that supports cashless spend capture. Europe follows with roughly 25% to 30% share as safety standards spread and retail landlords back active anchors to stabilize traffic. Consolidation continues as multi-site operators standardize layouts and procurement.
Asia Pacific delivers the fastest growth through 2033, with an estimated 16% to 18% CAGR driven by China, India, and Southeast Asia. Rising middle-class spending and mall pipeline growth support new builds in tier 2 cities. The Middle East grows via mall-anchored destinations in the UAE and Saudi Arabia. Latin America expands in Mexico and Brazil with franchise-led models. In 2025, the global market approaches USD 1.24 billion, and the long-term path to USD 3.49 billion by 2033 remains intact if new openings maintain safety and throughput discipline. You should watch secondary U.S. metros, Central and Eastern Europe, and India’s tier 2 cities for attractive entry economics.
By Type, (Indoor, Outdoor), By End-User, (Adults, Children)
Research Methodology
Primary Research- 100 Interviews of Stakeholders
Secondary Research
Desk Research
Regional scope
North America (United States, Canada, Mexico)
Latin America (Brazil, Argentina, Columbia)
East Asia And Pacific (China, Japan, South Korea, Australia, Cambodia, Fiji, Indonesia)
Sea And South Asia (India, Singapore, Thailand, Taiwan, Malaysia)
Eastern Europe (Poland, Russia, Czech Republic, Romania)
Western Europe (Germany, U.K., France, Spain, Itlay)
Middle East & Africa (GCC Countries, Egypt, Nigeria, South Africa, Israel)
Competitive Landscape
ABB, Cottrell Paper Company Inc., Teijin Limited, Yantai Metastar Special Paper Co. Ltd., DuPont Inc., Delfortgroup AG, Weidmann Electrical Technology AG, 3M Company, Miki Tokushu Paper Mfg. Co. Ltd., Nitto Denko Corporation, Dow, Von Roll Holding AG
Customization Scope
Customization for segments, region/country-level will be provided. Moreover, additional customization can be done based on the requirements.
Pricing and Purchase Options
Avail customized purchase options to meet your exact research needs. We have three licenses to opt for: Single User License, Multi-User License (Up to 5 Users), Corporate Use License (Unlimited User and Printable PDF).
TABLE OF CONTENTS
1. EXECUTIVE SUMMARY
1.1. MARKET SNAPSHOT
1.2. KEY FINDINGS & INSIGHTS
1.3. ANALYST RECOMMENDATIONS
1.4. FUTURE OUTLOOK
2. RESEARCH METHODOLOGY
2.1. MARKET DEFINITION & SCOPE
2.2. RESEARCH OBJECTIVES: PRIMARY & SECONDARY DATA SOURCES
2.3. DATA COLLECTION SOURCES
2.3.1. COVERAGE OF 100+ PRIMARY RESEARCH/CONSULTATION CALLS WITH INDUSTRY STAKEHOLDERS
FIGURE 17 NORTH AMERICA TRAMPOLINE PARK CURRENT AND FUTURE TYPE ANALYSIS, 2025–2034, (USD MILLION)
FIGURE 18 NORTH AMERICA TRAMPOLINE PARK CURRENT AND FUTURE END USER ANALYSIS, 2025–2034, (USD MILLION)
FIGURE 19 MARKET SHARE BY COUNTRY
FIGURE 20 LATIN AMERICA TRAMPOLINE PARK CURRENT AND FUTURE TYPE ANALYSIS, 2025–2034, (USD MILLION)
FIGURE 21 LATIN AMERICA TRAMPOLINE PARK CURRENT AND FUTURE END USER ANALYSIS, 2025–2034, (USD MILLION)
FIGURE 22 MARKET SHARE BY COUNTRY
FIGURE 23 EASTERN EUROPE TRAMPOLINE PARK CURRENT AND FUTURE TYPE ANALYSIS, 2025–2034, (USD MILLION)
FIGURE 24 EASTERN EUROPE TRAMPOLINE PARK CURRENT AND FUTURE END USER ANALYSIS, 2025–2034, (USD MILLION)
FIGURE 25 MARKET SHARE BY COUNTRY
FIGURE 26 WESTERN EUROPE TRAMPOLINE PARK CURRENT AND FUTURE TYPE ANALYSIS, 2025–2034, (USD MILLION)
FIGURE 27 WESTERN EUROPE TRAMPOLINE PARK CURRENT AND FUTURE END USER ANALYSIS, 2025–2034, (USD MILLION)
FIGURE 28 MARKET SHARE BY COUNTRY
FIGURE 29 EAST ASIA AND PACIFIC TRAMPOLINE PARK CURRENT AND FUTURE TYPE ANALYSIS, 2025–2034, (USD MILLION)
FIGURE 30 EAST ASIA AND PACIFIC TRAMPOLINE PARK CURRENT AND FUTURE END USER ANALYSIS, 2025–2034, (USD MILLION)
FIGURE 31 MARKET SHARE BY COUNTRY
FIGURE 32 SEA AND SOUTH ASIA TRAMPOLINE PARK CURRENT AND FUTURE TYPE ANALYSIS, 2025–2034, (USD MILLION)
FIGURE 33 SEA AND SOUTH ASIA TRAMPOLINE PARK CURRENT AND FUTURE END USER ANALYSIS, 2025–2034, (USD MILLION)
FIGURE 34 MARKET SHARE BY COUNTRY
FIGURE 35 MIDDLE EAST AND AFRICA TRAMPOLINE PARK CURRENT AND FUTURE TYPE ANALYSIS, 2025–2034, (USD MILLION)
FIGURE 36 MIDDLE EAST AND AFRICA TRAMPOLINE PARK CURRENT AND FUTURE END USER ANALYSIS, 2025–2034, (USD MILLION)
FIGURE 37 NORTH AMERICA TRAMPOLINE PARK CURRENT AND FUTURE MARKET VOLUME SHARE REGIONAL ANALYSIS, 2025–2034, (USD MILLION)
FIGURE 38 U.S. TRAMPOLINE PARK CURRENT AND FUTURE TYPE ANALYSIS, 2025–2034, (USD MILLION)
FIGURE 39 U.S. TRAMPOLINE PARK CURRENT AND FUTURE END USER ANALYSIS, 2025–2034, (USD MILLION)
FIGURE 40 CANADA TRAMPOLINE PARK CURRENT AND FUTURE TYPE ANALYSIS, 2025–2034, (USD MILLION)
FIGURE 41 CANADA TRAMPOLINE PARK CURRENT AND FUTURE END USER ANALYSIS, 2025–2034, (USD MILLION)
FIGURE 42 LATIN AMERICA TRAMPOLINE PARK CURRENT AND FUTURE MARKET VOLUME SHARE REGIONAL ANALYSIS, 2025–2034, (USD MILLION)
FIGURE 43 MEXICO TRAMPOLINE PARK CURRENT AND FUTURE TYPE ANALYSIS, 2025–2034, (USD MILLION)
FIGURE 44 MEXICO TRAMPOLINE PARK CURRENT AND FUTURE END USER ANALYSIS, 2025–2034, (USD MILLION)
FIGURE 45 BRAZIL TRAMPOLINE PARK CURRENT AND FUTURE TYPE ANALYSIS, 2025–2034, (USD MILLION)
FIGURE 46 BRAZIL TRAMPOLINE PARK CURRENT AND FUTURE END USER ANALYSIS, 2025–2034, (USD MILLION)
FIGURE 47 ARGENTINA TRAMPOLINE PARK CURRENT AND FUTURE TYPE ANALYSIS, 2025–2034, (USD MILLION)
FIGURE 48 ARGENTINA TRAMPOLINE PARK CURRENT AND FUTURE END USER ANALYSIS, 2025–2034, (USD MILLION)
FIGURE 49 COLUMBIA TRAMPOLINE PARK CURRENT AND FUTURE TYPE ANALYSIS, 2025–2034, (USD MILLION)
FIGURE 50 COLUMBIA TRAMPOLINE PARK CURRENT AND FUTURE END USER ANALYSIS, 2025–2034, (USD MILLION)
FIGURE 51 REST OF LATIN AMERICA TRAMPOLINE PARK CURRENT AND FUTURE TYPE ANALYSIS, 2025–2034, (USD MILLION)
FIGURE 52 REST OF LATIN AMERICA TRAMPOLINE PARK CURRENT AND FUTURE END USER ANALYSIS, 2025–2034, (USD MILLION)
FIGURE 53 EASTERN EUROPE TRAMPOLINE PARK CURRENT AND FUTURE MARKET VOLUME SHARE REGIONAL ANALYSIS, 2025–2034, (USD MILLION)
FIGURE 54 POLAND TRAMPOLINE PARK CURRENT AND FUTURE TYPE ANALYSIS, 2025–2034, (USD MILLION)
FIGURE 55 POLAND TRAMPOLINE PARK CURRENT AND FUTURE END USER ANALYSIS, 2025–2034, (USD MILLION)
FIGURE 56 RUSSIA TRAMPOLINE PARK CURRENT AND FUTURE TYPE ANALYSIS, 2025–2034, (USD MILLION)
FIGURE 57 RUSSIA TRAMPOLINE PARK CURRENT AND FUTURE END USER ANALYSIS, 2025–2034, (USD MILLION)
FIGURE 58 CZECH REPUBLIC TRAMPOLINE PARK CURRENT AND FUTURE TYPE ANALYSIS, 2025–2034, (USD MILLION)
FIGURE 59 CZECH REPUBLIC TRAMPOLINE PARK CURRENT AND FUTURE END USER ANALYSIS, 2025–2034, (USD MILLION)
FIGURE 60 ROMANIA TRAMPOLINE PARK CURRENT AND FUTURE TYPE ANALYSIS, 2025–2034, (USD MILLION)
FIGURE 61 ROMANIA TRAMPOLINE PARK CURRENT AND FUTURE END USER ANALYSIS, 2025–2034, (USD MILLION)
FIGURE 62 REST OF EASTERN EUROPE TRAMPOLINE PARK CURRENT AND FUTURE TYPE ANALYSIS, 2025–2034, (USD MILLION)
FIGURE 63 REST OF EASTERN EUROPE TRAMPOLINE PARK CURRENT AND FUTURE END USER ANALYSIS, 2025–2034, (USD MILLION)
FIGURE 64 WESTERN EUROPE TRAMPOLINE PARK CURRENT AND FUTURE MARKET VOLUME SHARE REGIONAL ANALYSIS, 2025–2034, (USD MILLION)
FIGURE 65 GERMANY TRAMPOLINE PARK CURRENT AND FUTURE TYPE ANALYSIS, 2025–2034, (USD MILLION)
FIGURE 66 GERMANY TRAMPOLINE PARK CURRENT AND FUTURE END USER ANALYSIS, 2025–2034, (USD MILLION)
FIGURE 67 FRANCE TRAMPOLINE PARK CURRENT AND FUTURE TYPE ANALYSIS, 2025–2034, (USD MILLION)
FIGURE 68 FRANCE TRAMPOLINE PARK CURRENT AND FUTURE END USER ANALYSIS, 2025–2034, (USD MILLION)
FIGURE 69 UK TRAMPOLINE PARK CURRENT AND FUTURE TYPE ANALYSIS, 2025–2034, (USD MILLION)
FIGURE 70 UK TRAMPOLINE PARK CURRENT AND FUTURE END USER ANALYSIS, 2025–2034, (USD MILLION)
FIGURE 71 SPAIN TRAMPOLINE PARK CURRENT AND FUTURE TYPE ANALYSIS, 2025–2034, (USD MILLION)
FIGURE 72 SPAIN TRAMPOLINE PARK CURRENT AND FUTURE END USER ANALYSIS, 2025–2034, (USD MILLION)
FIGURE 73 ITALY TRAMPOLINE PARK CURRENT AND FUTURE TYPE ANALYSIS, 2025–2034, (USD MILLION)
FIGURE 74 ITALY TRAMPOLINE PARK CURRENT AND FUTURE END USER ANALYSIS, 2025–2034, (USD MILLION)
FIGURE 75 REST OF WESTERN EUROPE TRAMPOLINE PARK CURRENT AND FUTURE TYPE ANALYSIS, 2025–2034, (USD MILLION)
FIGURE 76 REST OF WESTERN EUROPE TRAMPOLINE PARK CURRENT AND FUTURE END USER ANALYSIS, 2025–2034, (USD MILLION)
FIGURE 77 EAST ASIA AND PACIFIC TRAMPOLINE PARK CURRENT AND FUTURE MARKET VOLUME SHARE REGIONAL ANALYSIS, 2025–2034, (USD MILLION)
FIGURE 78 CHINA TRAMPOLINE PARK CURRENT AND FUTURE TYPE ANALYSIS, 2025–2034, (USD MILLION)
FIGURE 79 CHINA TRAMPOLINE PARK CURRENT AND FUTURE END USER ANALYSIS, 2025–2034, (USD MILLION)
FIGURE 80 JAPAN TRAMPOLINE PARK CURRENT AND FUTURE TYPE ANALYSIS, 2025–2034, (USD MILLION)
FIGURE 81 JAPAN TRAMPOLINE PARK CURRENT AND FUTURE END USER ANALYSIS, 2025–2034, (USD MILLION)
FIGURE 82 AUSTRALIA TRAMPOLINE PARK CURRENT AND FUTURE TYPE ANALYSIS, 2025–2034, (USD MILLION)
FIGURE 83 AUSTRALIA TRAMPOLINE PARK CURRENT AND FUTURE END USER ANALYSIS, 2025–2034, (USD MILLION)
FIGURE 84 CAMBODIA TRAMPOLINE PARK CURRENT AND FUTURE TYPE ANALYSIS, 2025–2034, (USD MILLION)
FIGURE 85 CAMBODIA TRAMPOLINE PARK CURRENT AND FUTURE END USER ANALYSIS, 2025–2034, (USD MILLION)
FIGURE 86 FIJI TRAMPOLINE PARK CURRENT AND FUTURE TYPE ANALYSIS, 2025–2034, (USD MILLION)
FIGURE 87 FIJI TRAMPOLINE PARK CURRENT AND FUTURE END USER ANALYSIS, 2025–2034, (USD MILLION)
FIGURE 88 INDONESIA TRAMPOLINE PARK CURRENT AND FUTURE TYPE ANALYSIS, 2025–2034, (USD MILLION)
FIGURE 89 INDONESIA TRAMPOLINE PARK CURRENT AND FUTURE END USER ANALYSIS, 2025–2034, (USD MILLION)
FIGURE 90 SOUTH KOREA TRAMPOLINE PARK CURRENT AND FUTURE TYPE ANALYSIS, 2025–2034, (USD MILLION)
FIGURE 91 SOUTH KOREA TRAMPOLINE PARK CURRENT AND FUTURE END USER ANALYSIS, 2025–2034, (USD MILLION)
FIGURE 92 REST OF EAST ASIA AND PACIFIC TRAMPOLINE PARK CURRENT AND FUTURE TYPE ANALYSIS, 2025–2034, (USD MILLION)
FIGURE 93 REST OF EAST ASIA AND PACIFIC TRAMPOLINE PARK CURRENT AND FUTURE END USER ANALYSIS, 2025–2034, (USD MILLION)
FIGURE 94 SEA AND SOUTH ASIA TRAMPOLINE PARK CURRENT AND FUTURE MARKET VOLUME SHARE REGIONAL ANALYSIS, 2025–2034, (USD MILLION)
FIGURE 95 BANGLADESH TRAMPOLINE PARK CURRENT AND FUTURE TYPE ANALYSIS, 2025–2034, (USD MILLION)
FIGURE 96 BANGLADESH TRAMPOLINE PARK CURRENT AND FUTURE END USER ANALYSIS, 2025–2034, (USD MILLION)
FIGURE 97 NEW ZEALAND TRAMPOLINE PARK CURRENT AND FUTURE TYPE ANALYSIS, 2025–2034, (USD MILLION)
FIGURE 98 NEW ZEALAND TRAMPOLINE PARK CURRENT AND FUTURE END USER ANALYSIS, 2025–2034, (USD MILLION)
FIGURE 99 INDIA TRAMPOLINE PARK CURRENT AND FUTURE TYPE ANALYSIS, 2025–2034, (USD MILLION)
FIGURE 100 INDIA TRAMPOLINE PARK CURRENT AND FUTURE END USER ANALYSIS, 2025–2034, (USD MILLION)
FIGURE 101 SINGAPORE TRAMPOLINE PARK CURRENT AND FUTURE TYPE ANALYSIS, 2025–2034, (USD MILLION)
FIGURE 102 SINGAPORE TRAMPOLINE PARK CURRENT AND FUTURE END USER ANALYSIS, 2025–2034, (USD MILLION)
FIGURE 103 THAILAND TRAMPOLINE PARK CURRENT AND FUTURE TYPE ANALYSIS, 2025–2034, (USD MILLION)
FIGURE 104 THAILAND TRAMPOLINE PARK CURRENT AND FUTURE END USER ANALYSIS, 2025–2034, (USD MILLION)
FIGURE 105 TAIWAN TRAMPOLINE PARK CURRENT AND FUTURE TYPE ANALYSIS, 2025–2034, (USD MILLION)
FIGURE 106 TAIWAN TRAMPOLINE PARK CURRENT AND FUTURE END USER ANALYSIS, 2025–2034, (USD MILLION)
FIGURE 107 MALAYSIA TRAMPOLINE PARK CURRENT AND FUTURE TYPE ANALYSIS, 2025–2034, (USD MILLION)
FIGURE 108 MALAYSIA TRAMPOLINE PARK CURRENT AND FUTURE END USER ANALYSIS, 2025–2034, (USD MILLION)
FIGURE 109 REST OF SEA AND SOUTH ASIA TRAMPOLINE PARK CURRENT AND FUTURE TYPE ANALYSIS, 2025–2034, (USD MILLION)
FIGURE 110 REST OF SEA AND SOUTH ASIA TRAMPOLINE PARK CURRENT AND FUTURE END USER ANALYSIS, 2025–2034, (USD MILLION)
FIGURE 111 MIDDLE EAST AND AFRICA TRAMPOLINE PARK CURRENT AND FUTURE MARKET VOLUME SHARE REGIONAL ANALYSIS, 2025–2034, (USD MILLION)
FIGURE 112 GCC COUNTRIES TRAMPOLINE PARK CURRENT AND FUTURE TYPE ANALYSIS, 2025–2034, (USD MILLION)
FIGURE 113 GCC COUNTRIES TRAMPOLINE PARK CURRENT AND FUTURE END USER ANALYSIS, 2025–2034, (USD MILLION)
FIGURE 114 SAUDI ARABIA TRAMPOLINE PARK CURRENT AND FUTURE TYPE ANALYSIS, 2025–2034, (USD MILLION)
FIGURE 115 SAUDI ARABIA TRAMPOLINE PARK CURRENT AND FUTURE END USER ANALYSIS, 2025–2034, (USD MILLION)
FIGURE 116 UAE TRAMPOLINE PARK CURRENT AND FUTURE TYPE ANALYSIS, 2025–2034, (USD MILLION)
FIGURE 117 UAE TRAMPOLINE PARK CURRENT AND FUTURE END USER ANALYSIS, 2025–2034, (USD MILLION)
FIGURE 118 BAHRAIN TRAMPOLINE PARK CURRENT AND FUTURE TYPE ANALYSIS, 2025–2034, (USD MILLION)
FIGURE 119 BAHRAIN TRAMPOLINE PARK CURRENT AND FUTURE END USER ANALYSIS, 2025–2034, (USD MILLION)
FIGURE 120 KUWAIT TRAMPOLINE PARK CURRENT AND FUTURE TYPE ANALYSIS, 2025–2034, (USD MILLION)
FIGURE 121 KUWAIT TRAMPOLINE PARK CURRENT AND FUTURE END USER ANALYSIS, 2025–2034, (USD MILLION)
FIGURE 122 OMAN TRAMPOLINE PARK CURRENT AND FUTURE TYPE ANALYSIS, 2025–2034, (USD MILLION)
FIGURE 123 OMAN TRAMPOLINE PARK CURRENT AND FUTURE END USER ANALYSIS, 2025–2034, (USD MILLION)
FIGURE 124 QATAR TRAMPOLINE PARK CURRENT AND FUTURE TYPE ANALYSIS, 2025–2034, (USD MILLION)
FIGURE 125 QATAR TRAMPOLINE PARK CURRENT AND FUTURE END USER ANALYSIS, 2025–2034, (USD MILLION)
FIGURE 126 EGYPT TRAMPOLINE PARK CURRENT AND FUTURE TYPE ANALYSIS, 2025–2034, (USD MILLION)
FIGURE 127 EGYPT TRAMPOLINE PARK CURRENT AND FUTURE END USER ANALYSIS, 2025–2034, (USD MILLION)
FIGURE 128 NIGERIA TRAMPOLINE PARK CURRENT AND FUTURE TYPE ANALYSIS, 2025–2034, (USD MILLION)
FIGURE 129 NIGERIA TRAMPOLINE PARK CURRENT AND FUTURE END USER ANALYSIS, 2025–2034, (USD MILLION)
FIGURE 130 SOUTH AFRICA TRAMPOLINE PARK CURRENT AND FUTURE TYPE ANALYSIS, 2025–2034, (USD MILLION)
FIGURE 131 SOUTH AFRICA TRAMPOLINE PARK CURRENT AND FUTURE END USER ANALYSIS, 2025–2034, (USD MILLION)
FIGURE 132 ISRAEL TRAMPOLINE PARK CURRENT AND FUTURE TYPE ANALYSIS, 2025–2034, (USD MILLION)
FIGURE 133 ISRAEL TRAMPOLINE PARK CURRENT AND FUTURE END USER ANALYSIS, 2025–2034, (USD MILLION)
FIGURE 134 REST OF MEA TRAMPOLINE PARK CURRENT AND FUTURE TYPE ANALYSIS, 2025–2034, (USD MILLION)
FIGURE 135 REST OF MEA TRAMPOLINE PARK CURRENT AND FUTURE END USER ANALYSIS, 2025–2034, (USD MILLION)
FIGURE 136 U. S. MARKET SHARE ANALYSIS BY TYPE (2024)
FIGURE 137 U. S. MARKET SHARE ANALYSIS BY END USER (2024)
FIGURE 138 CANADA MARKET SHARE ANALYSIS BY TYPE (2024)
FIGURE 139 CANADA MARKET SHARE ANALYSIS BY END USER (2024)
FIGURE 140 MEXICO MARKET SHARE ANALYSIS BY TYPE (2024)
FIGURE 141 MEXICO MARKET SHARE ANALYSIS BY END USER (2024)
FIGURE 142 CHINA MARKET SHARE ANALYSIS BY TYPE (2024)
FIGURE 143 CHINA MARKET SHARE ANALYSIS BY END USER (2024)
FIGURE 144 JAPAN MARKET SHARE ANALYSIS BY TYPE (2024)
FIGURE 145 JAPAN MARKET SHARE ANALYSIS BY END USER (2024)
FIGURE 146 INDIA MARKET SHARE ANALYSIS BY TYPE (2024)
FIGURE 147 INDIA MARKET SHARE ANALYSIS BY END USER (2024)
FIGURE 148 SOUTH KOREA MARKET SHARE ANALYSIS BY TYPE (2024)
FIGURE 149 SOUTH KOREA MARKET SHARE ANALYSIS BY END USER (2024)
FIGURE 150 SAUDI ARABIA MARKET SHARE ANALYSIS BY TYPE (2024)
FIGURE 151 SAUDI ARABIA MARKET SHARE ANALYSIS BY END USER (2024)
FIGURE 152 UAE MARKET SHARE ANALYSIS BY TYPE (2024)
FIGURE 153 UAE MARKET SHARE ANALYSIS BY END USER (2024)
FIGURE 154 EGYPT MARKET SHARE ANALYSIS BY TYPE (2024)
FIGURE 155 EGYPT MARKET SHARE ANALYSIS BY END USER (2024)
FIGURE 156 NIGERIA MARKET SHARE ANALYSIS BY TYPE (2024)
FIGURE 157 NIGERIA MARKET SHARE ANALYSIS BY END USER (2024)
FIGURE 158 SOUTH AFRICA MARKET SHARE ANALYSIS BY TYPE (2024)
FIGURE 159 SOUTH AFRICA MARKET SHARE ANALYSIS BY END USER (2024)
FIGURE 160 GERMANY MARKET SHARE ANALYSIS BY TYPE (2024)
FIGURE 161 GERMANY MARKET SHARE ANALYSIS BY END USER (2024)
FIGURE 162 FRANCE MARKET SHARE ANALYSIS BY TYPE (2024)
FIGURE 163 FRANCE MARKET SHARE ANALYSIS BY END USER (2024)
FIGURE 164 UK MARKET SHARE ANALYSIS BY TYPE (2024)
FIGURE 165 UK MARKET SHARE ANALYSIS BY END USER (2024)
FIGURE 166 SPAIN MARKET SHARE ANALYSIS BY TYPE (2024)
FIGURE 167 SPAIN MARKET SHARE ANALYSIS BY END USER (2024)
FIGURE 168 ITALY MARKET SHARE ANALYSIS BY TYPE (2024)
FIGURE 169 ITALY MARKET SHARE ANALYSIS BY END USER (2024)
FIGURE 170 BRAZIL MARKET SHARE ANALYSIS BY TYPE (2024)
FIGURE 171 BRAZIL MARKET SHARE ANALYSIS BY END USER (2024)
FIGURE 172 ARGENTINA MARKET SHARE ANALYSIS BY TYPE (2024)
FIGURE 173 ARGENTINA MARKET SHARE ANALYSIS BY END USER (2024)
FIGURE 174 COLUMBIA MARKET SHARE ANALYSIS BY TYPE (2024)
FIGURE 175 COLUMBIA MARKET SHARE ANALYSIS BY END USER (2024)
FIGURE 176 GLOBAL TRAMPOLINE PARK CURRENT AND FUTURE MARKET KEY COUNTRY LEVEL ANALYSIS, 2024–2034, (USD MILLION)
FIGURE 177 FINANCIAL OVERVIEW:
Key Player Analysis
Fun Spot Mfg: Positioned as a leader in trampoline and adventure park manufacturing with a broad portfolio spanning indoor playgrounds, ninja courses, ropes courses, climbing walls, ziplines, and full FEC fit-outs for global clients as of 2025. The company brings over 40 years of category experience, U.S. headquarters in Hartwell, Georgia, and a 51–200 employee footprint, which supports design, installation, and aftermarket parts at scale. In 2025, Fun Spot partnered with Pleyo to introduce interactive, connected gameplay systems like Pleyo Court and Pleyo Mini in U.S. parks, aligning with demand for tech-enabled engagement and repeat visitation.
Strategically, Fun Spot positions around turnkey delivery and compliance with evolving safety and operations expectations, reinforced by IAAPA marketplace presence and multi-attraction integration for higher yield per square foot. The partnership model with interactive platforms targets time-on-attraction and party conversion, giving you a route to lift revenue per visit through connected play without major footprint changes.
Playcraft Limited: Positioned as a challenger focused on UK and European projects across softplay, trampoline parks, ninja warrior courses, climbing walls, and sensory rooms with in-house manufacturing and fit-out capabilities. Brand communications and project showcases indicate a bespoke equipment approach under the Playcraft Group, serving leisure operators that seek integrated active entertainment anchors. The company operates in a UK market that has seen over 150 parks open since 2014, creating a mature buyer base that values compliance and site reconfiguration to sustain footfall.
Playcraft differentiates through full-scope delivery for indoor active venues, enabling you to refresh or expand with modular trampolines, ninja elements, and sensory spaces to widen audience reach beyond core jump products. The group’s UK base supports faster install cycles and aftercare within Europe, a practical edge for operators navigating maintenance and inspection schedules.
HAJUMP: Positioned as a niche player with European manufacturing, designing and installing trampoline parks since 2001, with all steel, frames, beds, padding, and springs produced in Belgium and deployed across Europe and the Middle East. The company highlights TÜV and Apave labeling and EU material sourcing, addressing operator needs for documented quality and lifecycle durability. HAJUMP’s offer spans single to multi-bed systems and trailer-based mobile formats, giving you configuration options from permanent parks to seasonal or event-led deployments.
HAJUMP and its Hadek-branded channels emphasize worldwide installation and after-sales support, including claims of early open-air implementations in Europe, which suit climates and sites seeking outdoor footprints. The firm’s positioning targets owners prioritizing EU-origin components and standardized certification, with catalog breadth that fits both new builds and retrofits.
Shock: Positioned as an innovator with patented gas shock–attenuating trampoline structures fabricated in the United States, designed by operators to reduce impact forces on pads and bedrails and to simplify maintenance access. The portfolio carries U.S. Patent No. 9,717,940 B1 and protections across Europe, China, Japan, Canada, Mexico, and other markets, and is promoted as compliant with ASTM and PAS safety standards. The design uses German-engineered gas shocks, pivoting bed rails, and shock-absorbing mounts to mitigate g-force on landings, addressing insurance and incident concerns central to 2025 operator priorities.
Shock advances commercial readiness through IAAPA marketplace participation and ecosystem ties with venue management and POS providers, supporting your shift to cashless transactions and reservation-led throughput. The firm stresses rapid installation and custom layouts, giving investors and operators a safety-forward option that aligns with audit requirements and repeat-visit programming in current market conditions.
Market Key Players:
ABB
Cottrell Paper Company Inc.
Teijin Limited
Yantai Metastar Special Paper Co. Ltd.
DuPont Inc.
Delfortgroup AG
Weidmann Electrical Technology AG
3M Company
Miki Tokushu Paper Mfg. Co. Ltd.
Nitto Denko Corporation
Dow
Von Roll Holding AG
Driver
Indoor, Year-Round Entertainment Fuels Demand
As of 2025, trampoline park demand is increasingly concentrated in indoor, all-weather venues that combine physical activity with social interaction. The market reaches approximately USD 1.23 billion in 2025 and remains on track for a 13.9% CAGR through 2033. Indoor parks dominate the format, accounting for nearly 90% of total revenue, as operators benefit from predictable footfall and insulation from seasonal weather disruptions.
Adult Participation and Event Monetization Expand Revenue
Adults now drive about 60.6% of total spending through corporate events, fitness programs, and organized group outings. Party bookings alone contribute an estimated 25–35% of site-level revenue. Digital enablers such as online reservations, timed entry, and dynamic pricing significantly boost weekend utilization—often exceeding weekday traffic by more than two times—creating opportunities to upsell memberships, premium attractions, and food & beverage offerings.
Restraint
Rising Costs and Liability Risks Pressure Margins
Operating costs remain a major constraint. Injury incidence averages 1.14 per 1,000 jumper hours, with higher exposure among younger participants. Insurance premiums and safety compliance requirements can consume 8–12% of total revenue in some regions, directly compressing margins. Fixed expenses such as energy and mall-based rents further intensify cost pressure.
Seasonality and Claims Volatility Impact Profitability
Demand volatility persists due to school calendars and seasonal preference for outdoor activities, particularly during summer months. Many operators report EBITDA compression of 200–300 basis points following insurance premium renewals or isolated safety incidents. To protect profitability, you must enforce strict safety protocols, maintain optimal staff-to-guest ratios, and invest in preventive maintenance to limit claims and pricing disruptions.
Opportunity
Asia Pacific Expansion Drives High-Growth Potential
Asia Pacific represents the strongest growth runway, with the region projected to compound at 16–18% CAGR through 2033. China, India, and Southeast Asia are adding mall-anchored trampoline parks in tier-2 cities, supported by rising disposable incomes and urban youth populations. If current development pipelines hold, regional revenue could exceed USD 1.1 billion by 2033.
Membership Models and Certification Unlock Margin Upside
Product and pricing innovation provide additional upside. Memberships and all-access passes can represent 20–30% of transactions once parks reach scale, stabilizing cash flows. Certified parks often command pricing premiums of 5–8% versus local competitors. Expansion into secondary U.S. metros, Central and Eastern Europe, and GCC markets—where rents are lower and competition is limited—offers attractive unit economics.
Operators are increasingly standardizing safety and operational practices using formal frameworks such as ASTM F2970 and PAS 5000. Parks that fully implement these standards report a monthly decline of approximately 0.72% in injury rates, strengthening insurer confidence and reinforcing brand credibility with families, schools, and corporate clients.
Digital Operations and AI Enhance Yield Management
Digital adoption is now mainstream, with over 80% of leading chains using online booking systems and cashless POS platforms. Advanced tools such as computer vision and AI-assisted monitoring are deployed in 15–25% of large parks, improving rule enforcement and near-miss detection. Treating telemetry, audits, and revenue management systems as core infrastructure is becoming essential to maximizing utilization while minimizing incident risk.
Recent Developments
Dec 2024 – Altitude Trampoline Park: Entered South Florida with the opening of Coral Springs, marking the brand’s first site in the region and setting up a broader state expansion pipeline. The move strengthens Altitude’s foothold in high-income suburban corridors and builds brand awareness ahead of multiple 2025 openings.
Feb 2025 – Altitude Trampoline Park: Opened West Palm Beach and confirmed a Q1 trajectory that included three new parks, reinforcing momentum in Florida and Chicago’s Roscoe Village by March. The expansion supports cluster economics, membership uptake, and party bookings in large metro areas.
Apr 2025 – Sky Zone: Launched a flagship venue in Frisco, Texas and disclosed plans to open more than 48 new parks by year end, up from eight in 2024; Texas franchise deals cover 13 additional locations. The acceleration widens Sky Zone’s lead in active entertainment and improves buying power and national marketing reach.
Jul 2025 – Fun Spot Manufacturing: Announced a U.S. partnership with Pleyo to deploy interactive gameplay systems such as Pleyo Court and Pleyo Mini across parks, targeting engagement and repeat visitation. The integration adds a tech layer to trampoline attractions and supports higher revenue per visit without large footprint changes.
Sep 2025 – Urban Air Adventure Park: Signed five new franchise agreements that will add seven parks across California as part of Unleashed Brands’ platform expansion. The deals deepen coverage in a priority state and enhance multi-concept cross-selling opportunities for family entertainment.
Sep 2025 – Sky Zone: Unveiled a major Chicago plan with four additional parks following the Deerfield debut, taking Illinois to 16 locations including 10 in greater Chicago. The cluster strategy boosts local brand density, reduces marketing cost per visit, and improves party conversion and staffing efficiency.

 Aerospace And Defence
 Agriculture
 Automotive And Transportation
 Banking And Finance
 Business
 Chemicals And Materials
 Consumer And Retail
 Electronics And Semiconductors
 Food And Beverages
 Machinery & Equipments
 Manufacturing And Construction
 Medical Devices
 Others
 Pharmaceuticals And Healthcare
 Power And Energy
 Sports
 Technology

, By Revenue Stream (Tickets, Parties, Fitness), By Age Group, Franchise Expansion Trends, Regional Outlook, Key Operators & Forecast 2025–2034")
, By Revenue Stream (Tickets, Parties, Fitness), By Age Group, Franchise Expansion Trends, Regional Outlook, Key Operators & Forecast 2025–2034")
, By Revenue Stream (Tickets, Parties, Fitness), By Age Group, Franchise Expansion Trends, Regional Outlook, Key Operators & Forecast 2025–2034")
, By Revenue Stream (Tickets, Parties, Fitness), By Age Group, Franchise Expansion Trends, Regional Outlook, Key Operators & Forecast 2025–2034")

