
- Home
- Industries
 Aerospace And Defence
 Agriculture
 Automotive And Transportation
 Banking And Finance
 Business
 Chemicals And Materials
 Consumer And Retail
 Electronics And Semiconductors
 Food And Beverages
 Machinery & Equipments
 Manufacturing And Construction
 Medical Devices
 Others
 Pharmaceuticals And Healthcare
 Power And Energy
 Sports
 Technology
- Services
- News Room
- About us
- Contact Us
-
Global Urban Air Mobility Market Size, Growth Forecast 2025–2034 | eVTOL & Smart Transportation Trends
Global Urban Air Mobility Market Size, Share, Analysis Report By Component(Platform, Infrastructure), Range (Intercity, Intracity), Vehicle Type(Manned Vehicles, Unmanned Vehicles), Operation (Piloted, Autonomous), End Use(Passenger Transportation, Freight/Logistics, Emergency Services, Military, Other), Mode of Operation (Fixed-Wing, Rotorcraft, Tilt-Wing Aircraft, Hybrid Aircraft, Propulsion Type), Region and Key Players - Industry Segment Overview, Market Dynamics, Competitive Strategies, Trends and Forecast 2025-2034

Report Overview:
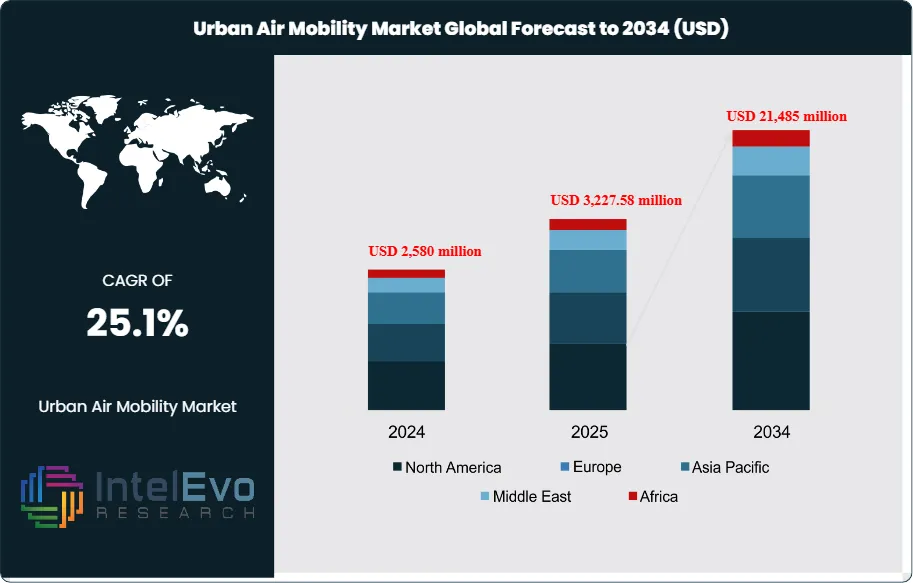
The Global Urban Air Mobility Market size is expected to be worth around USD 21,485 million by 2034, up from USD 2,580 million in 2024, growing at a CAGR of 25.1% during the forecast period from 2025 to 2034. The market is witnessing strong momentum driven by the rising need for efficient urban transportation, rapid advancements in eVTOL (electric Vertical Take-Off and Landing) aircraft, and increasing investments in smart city infrastructure. With major aerospace players and tech innovators entering the space, Urban Air Mobility is set to revolutionize the future of urban commuting and redefine sustainable transportation globally.
Urban Air Mobility (UAM) refers to the use of air transportation systems, typically electric Vertical Takeoff and Landing (eVTOL) aircraft, for urban passenger and cargo transport. This market includes the development, production, and deployment of aerial vehicles designed for short-distance travel within metropolitan areas. The UAM market is in its nascent stage, with companies focusing on developing advanced air vehicles, infrastructure, and air traffic management systems. Currently, the market is driven by increasing congestion in urban areas, advancements in battery technology, and the growing interest in sustainable transportation options. The market is gaining traction as major players such as Airbus, Boeing, and startups invest heavily in prototypes and partnerships with urban planners and local governments.
The UAM market is set for exponential growth due to several key drivers. The rising demand for faster and more efficient urban transport solutions in congested cities is one of the primary catalysts. Advances in electric propulsion, autonomy, and artificial intelligence have significantly improved the feasibility of eVTOLs. Furthermore, increased awareness about carbon emissions and sustainability goals are pushing governments and corporations to adopt cleaner transportation modes, driving interest in electric-powered UAM solutions. In addition, large investments from aerospace companies, venture capital firms, and public-private partnerships are accelerating the development and commercialization of UAM systems. Innovations in infrastructure, like vertiports, will also boost the sector's expansion.
North America is expected to lead the UAM market, driven by strong investments in aerospace technology and favorable regulatory initiatives from organizations like the Federal Aviation Administration (FAA). The United States, in particular, is at the forefront, with urban centers such as Los Angeles and Dallas being identified as testbeds for UAM deployment. Europe follows closely, with countries like Germany and the UK making significant strides in developing their UAM ecosystems. In the Asia-Pacific region, countries like Japan and South Korea are increasingly investing in UAM, focusing on integrating these systems to alleviate congestion in megacities. The Middle East is also exploring UAM technologies for their smart city initiatives.
The COVID-19 pandemic had a mixed impact on the UAM market. On one hand, it delayed the development and testing of prototypes due to supply chain disruptions and travel restrictions. On the other hand, it accelerated the need for contactless, efficient transportation, which aligned with UAM's core advantages. The pandemic also heightened the interest in using UAM vehicles for medical and emergency services, further highlighting its potential in crisis situations. Despite short-term setbacks, the long-term outlook for UAM remains positive, with increased interest and investment from both public and private sectors in the post-pandemic recovery period.
Get More Information about this report -
Request Free Sample Report, Range (Intercity, Intracity), Vehicle Type(Manned Vehicles, Unmanned Vehicles), Operation (Piloted, Autonomous), End Use(Passenger Transportation, Freight/Logistics, Emergency Services, Military, Other), Mode of Operation (Fixed-Wing, Rotorcraft, Tilt-Wing Aircraft, Hybrid Aircraft, Propulsion Type), Region and Key Players - Industry Segment Overview, Market Dynamics, Competitive Strategies, Trends and Forecast 2025-2034")
Key Takeaways:
- Market Growth: The Urban Air Mobility market is expected to reach USD 21,485 million by 2034, growing at a robust CAGR of 25.1%, indicating strong market expansion driven by technological advancements and increasing urbanization.
- Passenger Air Vehicle Dominance: The passenger air vehicle segment is anticipated to dominate the market, accounting for over 60% of the overall share due to rising consumer demand for efficient urban transportation solutions and the growing acceptance of aerial taxis.
- Cargo Air Vehicle Preference: The cargo air vehicle segment is likely to witness substantial growth, driven by the increasing demand for efficient last-mile delivery solutions in urban areas, as companies seek to enhance their logistics operations through UAM technologies.
- Driver: The growing urban population and rising traffic congestion are significant drivers for the UAM market. Increasing investments in infrastructure and technology for eVTOL vehicles are expected to support the expansion of urban air transportation networks.
- Restraint: Regulatory hurdles and safety concerns surrounding UAM operations may impede market growth. The need for comprehensive air traffic management systems and public acceptance of aerial transport solutions can pose challenges for industry stakeholders.
- Opportunity: The development of vertiport infrastructure in urban areas presents a substantial opportunity for growth. Collaborations between private companies and government bodies can facilitate the successful integration of UAM services into existing transportation networks.
- Trend: The focus on sustainability is driving innovation in eVTOL designs, with many companies prioritizing electric and hybrid propulsion systems to minimize environmental impact.
- Regional Analysis: North America is projected to hold the largest market share due to substantial investments in UAM technology, while the Asia-Pacific region shows the fastest growth potential, fueled by increasing urbanization and government initiatives promoting aerial mobility solutions.
Component Analysis:
The UAM market is divided into platforms and infrastructure. The platform segment includes air taxis, shuttles, personal aerial vehicles, cargo vehicles, and air ambulances, which are key to transforming urban transportation. Air taxis are gaining significant attention due to their potential to reduce congestion. Infrastructure covers vertiports, charging stations, and air traffic management systems, essential for the operational success of UAM systems. Vertiports, designed for takeoff and landing, and robust air traffic management systems will facilitate safe, scalable deployment of UAM in cities.
Range Analysis:
UAM operations are classified as intercity and intracity. Intracity UAM focuses on short-range flights within cities, addressing urban congestion and reducing travel time. These services target high-density urban areas, offering quick and efficient alternatives to ground transportation. Intercity operations, on the other hand, span longer distances, connecting different cities and potentially replacing regional travel modes like trains or short-haul flights. Intracity applications are currently the primary focus, as they are expected to grow faster due to the immediate need for solutions in urban centers with high traffic density.
Vehicle Type Analysis:
UAM vehicles can be manned or unmanned. Manned vehicles are piloted aircraft designed for passenger or cargo transportation, providing a more familiar model during the initial phases of UAM. Unmanned vehicles, or drones, operate autonomously or remotely, mainly serving in cargo, emergency services, or even passenger transport in the future. The unmanned vehicle segment is expected to witness rapid growth, driven by advancements in autonomy, safety, and the regulatory landscape, which is increasingly favoring the adoption of autonomous aerial systems in urban environments.
Operation Insights:
UAM operations can be piloted or autonomous. Piloted vehicles are currently dominating the market due to safety concerns and regulatory barriers surrounding fully autonomous systems. However, autonomous operations are poised for significant growth as technology matures and regulations evolve. Autonomous UAM promises to revolutionize urban transport by reducing the need for human intervention, increasing efficiency, and lowering operational costs. Companies are heavily investing in autonomous systems, foreseeing a future where fully automated air taxis and cargo drones can operate safely within urban environments.
End-Use Insights:
The end-use segment includes passenger transportation, freight/logistics, emergency services, military, and other niche applications. Passenger transport is anticipated to lead the market, driven by the need for faster, more efficient urban mobility solutions. Freight and logistics are also gaining importance, with cargo drones providing quick deliveries. Emergency services, such as air ambulances, are increasingly adopting UAM for rapid response in medical emergencies. Additionally, the military is showing interest in using UAM for reconnaissance and supply missions, further driving the market’s expansion across various sectors.
Mode of Operation Insights:
UAM vehicles operate in different modes, including fixed-wing, rotorcraft, tilt-wing, and hybrid configurations. Fixed-wing aircraft offer greater efficiency for longer intercity flights, while rotorcraft (eVTOL) are more suitable for vertical takeoffs and landings, ideal for intracity travel. Tilt-wing aircraft combine the advantages of both, providing versatility for varying urban and regional needs. Hybrid vehicles, combining multiple operational modes, aim to deliver flexibility in complex environments. Rotorcraft eVTOLs are currently leading the market due to their ability to maneuver in dense urban spaces with minimal infrastructure.
Propulsion Type Insights:
The UAM market is segmented by propulsion type into electric battery, hydrogen fuel cells, and hybrid electric systems. Electric battery-powered UAM vehicles dominate the market due to advancements in battery technology, offering a cleaner and more sustainable mode of transport. Hydrogen fuel cells, while less common, present a promising alternative due to their high energy density and potential for longer flights. Hybrid-electric systems, combining electric propulsion with conventional engines, provide extended range and reliability, particularly for longer intercity operations. The transition to fully electric systems is a major trend in the UAM market.
Region Analysis:
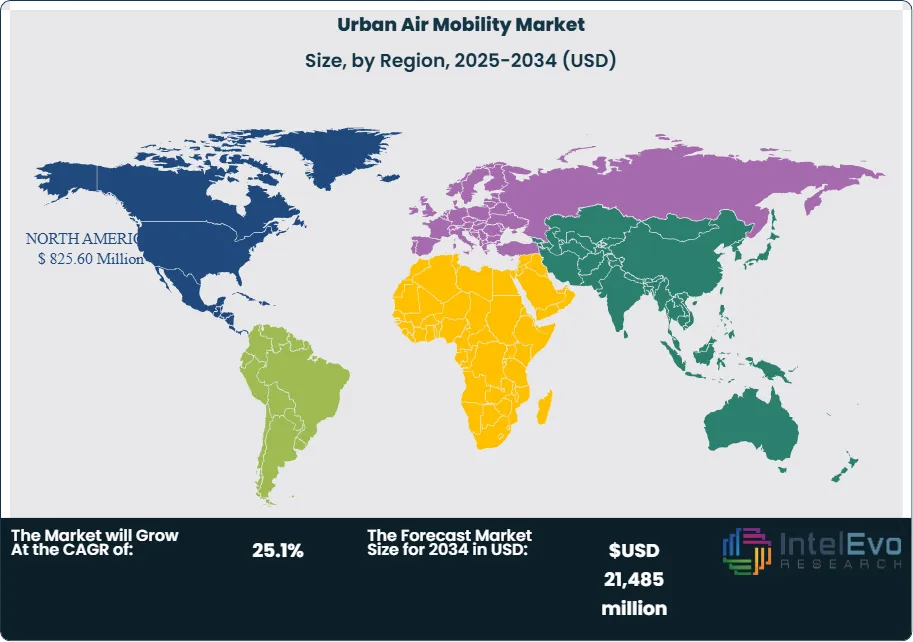
North America Leads With the Largest Market Share in the Global Urban Air Mobility Market: North America holds the largest market share in the Global Urban Air Mobility (UAM) market, driven by technological advancements, strong investments, and regulatory support. The United States is a key player due to its well-established aerospace industry, significant investments in electric Vertical Takeoff and Landing (eVTOL) aircraft, and initiatives by the Federal Aviation Administration (FAA) to develop air traffic management systems for UAM. Cities like Los Angeles and Dallas are early adopters, with infrastructure development projects underway. Government support for sustainable transportation solutions and the presence of major UAM developers like Boeing and Joby Aviation further strengthen the region’s dominance.
Asia-Pacific is projected to be the fastest-growing region, fueled by high urban population density, increasing investments in smart city initiatives, and government support for sustainable transport systems. Countries like Japan, South Korea, and China are investing heavily in UAM infrastructure and R&D. In Japan, UAM is a key component of the "Smart Mobility" framework, while South Korea's government-backed urban air transport projects aim for deployment by 2030. Europe is also advancing rapidly, with Germany and the UK taking a leadership role, while regions like Latin America and the Middle East are exploring UAM solutions for congestion and emergency services.
Get More Information about this report -
Request Free Sample ReportKey Market Segment
By Platform Type
- Air Taxis
- Passenger Drones
- Personal Aerial Vehicles
- Cargo Air Vehicles
- Air Shuttles
- Air Ambulances
By Operation
- Piloted
- Fully Autonomous
By Range
- Intracity (≤50 km)
- Intercity (>50 km)
By Vehicle Type
- Manned Vehicles
- Unmanned Vehicles
By Mode of Operation
- Fixed-Wing
- Rotorcraft
- Tilt-Wing Aircraft
- Hybrid Aircraft
By Propulsion Type
- Electric (Battery-Electric)
- Hybrid-Electric
- Hydrogen Fuel Cell
By Infrastructure
- Vertiports
- Charging Stations
- Air Traffic Management Systems
By End-Use Application
- Ride-Sharing Companies
- Private Owners
- Emergency Medical Services
- Cargo & Logistics
- Military & Defense
- Others
By Region
- North America
- Latin America
- East Asia And Pacific
- Sea And South Asia
- Eastern Europe
- Western Europe
- Middle East & Africa
| Report Attribute | Details |
| Market size (2025) | USD 3,227.58 million |
| Forecast Revenue (2034) | USD 21,485 million |
| CAGR (2025-2034) | 25.1% |
| Historical data | 2018-2023 |
| Base Year For Estimation | 2024 |
| Forecast Period | 2025-2034 |
| Report coverage | Revenue Forecast, Competitive Landscape, Market Dynamics, Growth Factors, Trends and Recent Developments |
| Segments covered | By Platform Type (Air Taxis, Passenger Drones, Personal Aerial Vehicles, Cargo Air Vehicles, Air Shuttles, Air Ambulances), By Operation (Piloted, Fully Autonomous), By Range (Intracity (≤50 km), Intercity (>50 km)), By Vehicle Type (Manned Vehicles, Unmanned Vehicles), By Mode of Operation (Fixed-Wing, Rotorcraft, Tilt-Wing Aircraft, Hybrid Aircraft), By Propulsion Type (Electric (Battery-Electric), Hybrid-Electric, Hydrogen Fuel Cell), By Infrastructure (Vertiports, Charging Stations, Air Traffic Management Systems), By End-Use Application (Ride-Sharing Companies, Private Owners, Emergency Medical Services, Cargo & Logistics, Military & Defense, Others) |
| Research Methodology |
|
| Regional scope |
|
| Competitive Landscape | Joby Aviation, Volocopter GmbH, Boeing, Airbus, Bell Textron Inc., Lilium GmbH, Hyundai Urban Air Mobility, Kitty Hawk Corporation, Pipistrel Aircraft, EmbraerX, EHang, Wisk Aero, Terrafugia, Breeze Aviation, Maverick Aviation, Lift Aircraft, Urban Aeronautics, SkyDrive Inc., Aurora Flight Sciences (a subsidiary of Boeing), Eviation Aircraft |
| Customization Scope | Customization for segments, region/country-level will be provided. Moreover, additional customization can be done based on the requirements. |
| Pricing and Purchase Options | Avail customized purchase options to meet your exact research needs. We have three licenses to opt for: Single User License, Multi-User License (Up to 5 Users), Corporate Use License (Unlimited User and Printable PDF). |
, Range (Intercity, Intracity), Vehicle Type(Manned Vehicles, Unmanned Vehicles), Operation (Piloted, Autonomous), End Use(Passenger Transportation, Freight/Logistics, Emergency Services, Military, Other), Mode of Operation (Fixed-Wing, Rotorcraft, Tilt-Wing Aircraft, Hybrid Aircraft, Propulsion Type), Region and Key Players - Industry Segment Overview, Market Dynamics, Competitive Strategies, Trends and Forecast 2025-2034")
, Range (Intercity, Intracity), Vehicle Type(Manned Vehicles, Unmanned Vehicles), Operation (Piloted, Autonomous), End Use(Passenger Transportation, Freight/Logistics, Emergency Services, Military, Other), Mode of Operation (Fixed-Wing, Rotorcraft, Tilt-Wing Aircraft, Hybrid Aircraft, Propulsion Type), Region and Key Players - Industry Segment Overview, Market Dynamics, Competitive Strategies, Trends and Forecast 2025-2034")
, Range (Intercity, Intracity), Vehicle Type(Manned Vehicles, Unmanned Vehicles), Operation (Piloted, Autonomous), End Use(Passenger Transportation, Freight/Logistics, Emergency Services, Military, Other), Mode of Operation (Fixed-Wing, Rotorcraft, Tilt-Wing Aircraft, Hybrid Aircraft, Propulsion Type), Region and Key Players - Industry Segment Overview, Market Dynamics, Competitive Strategies, Trends and Forecast 2025-2034")
Frequently Asked Questions
How big is the Urban Air Mobility Market?
Discover the Global Urban Air Mobility Market outlook (2025–2034), projected to reach USD 21.48 Billion by 2034 at 25.1% CAGR. Explore growth drivers, eVTOL innovations, smart city adoption, and key players shaping the future of air transportation.
Who are the major players in the Urban Air Mobility Market?
Joby Aviation, Volocopter GmbH, Boeing, Airbus, Bell Textron Inc., Lilium GmbH, Hyundai Urban Air Mobility, Kitty Hawk Corporation, Pipistrel Aircraft, EmbraerX, EHang, Wisk Aero, Terrafugia, Breeze Aviation, Maverick Aviation, Lift Aircraft, Urban Aeronautics, SkyDrive Inc., Aurora Flight Sciences (a subsidiary of Boeing), Eviation Aircraft
Which segments covered the Urban Air Mobility Market?
By Platform Type (Air Taxis, Passenger Drones, Personal Aerial Vehicles, Cargo Air Vehicles, Air Shuttles, Air Ambulances), By Operation (Piloted, Fully Autonomous), By Range (Intracity (≤50 km), Intercity (>50 km)), By Vehicle Type (Manned Vehicles, Unmanned Vehicles), By Mode of Operation (Fixed-Wing, Rotorcraft, Tilt-Wing Aircraft, Hybrid Aircraft), By Propulsion Type (Electric (Battery-Electric), Hybrid-Electric, Hydrogen Fuel Cell), By Infrastructure (Vertiports, Charging Stations, Air Traffic Management Systems), By End-Use Application (Ride-Sharing Companies, Private Owners, Emergency Medical Services, Cargo & Logistics, Military & Defense, Others)
How can this market research report help my business make strategic decisions?
Our market research reports provide actionable intelligence, including verified market size data, CAGR projections, competitive benchmarking, and segment-level opportunity analysis. These insights support strategic planning, investment decisions, product development, and market entry strategies for enterprises and startups alike.
How frequently is the data updated?
We continuously monitor industry developments and update our reports to reflect regulatory changes, technological advancements, and macroeconomic shifts. Updated editions ensure you receive the latest market intelligence.

Select Licence Type
Connect with our sales team
Why IntelEvoResearch
100%
Customer
Satisfaction
24x7+
Availability - we are always
there when you need us
200+
Fortune 50 Companies trust
IntelEvoResearch
80%
of our reports are exclusive
and first in the industry
100%
more data
and analysis
1000+
reports published
till date
