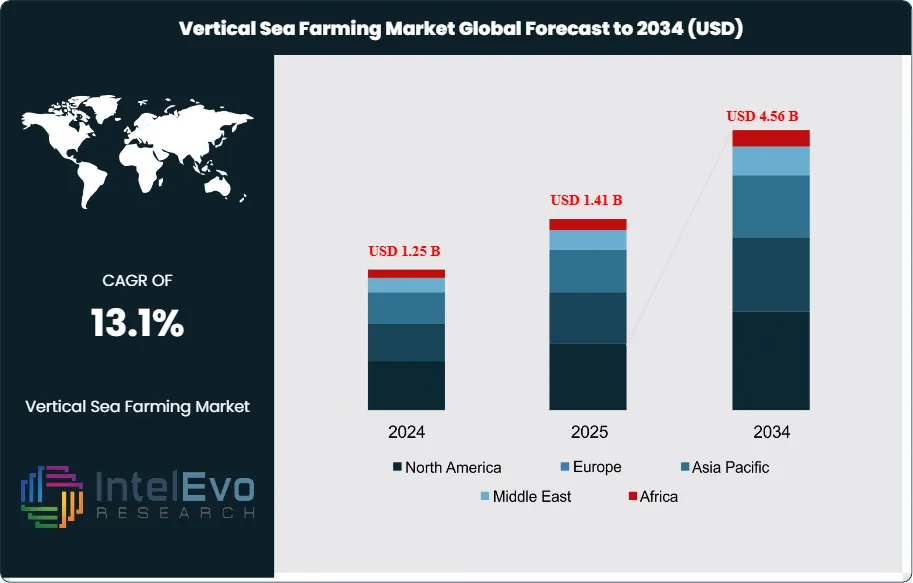
The Vertical Sea Farming Market size is expected to be valued at USD 1.25 billion in 2024 and is projected to reach approximately USD 4.56 billion by 2034, growing at a CAGR of 13.1% during the forecast period from 2025 to 2034. This surge is driven by the rising global demand for sustainable aquaculture, offshore cultivation technologies, and eco-efficient marine food production systems. With increasing focus on reducing land dependency and ensuring food security, vertical sea farming is emerging as a transformative solution in the blue economy, attracting investments from both agri-tech startups and major seafood producers worldwide.
This growth is supported by rising demand for sustainable seafood, technology advances in sea farming infrastructure, and regulatory incentives promoting aquaculture. Regions like Asia-Pacific are likely to show the fastest expansion, while established markets in North America and Europe continue adoption of advanced farming methods.
Vertical sea farming involves the cultivation of aquatic plants and animals using vertically structured farms in oceans and coastal areas. This innovative method maximizes space and productivity, addressing food security and environmental concerns. Market dynamics are shaped by increasing demand for sustainable seafood, advances in aquaculture technology, and growing awareness about oceanic biodiversity conservation. Currently, the market is in its nascent stage, with key players exploring technological integrations to enhance output.
The market’s growth is driven by increasing global population, the demand for sustainable food sources, and declining arable land. Additionally, advancements in automation and renewable energy in vertical sea farming systems are boosting production efficiency. Supportive government policies promoting sustainable aquaculture and environmental concerns about overfishing are further fueling market expansion.
North America and Europe are leading in terms of technological adoption and investments in vertical sea farming. Asia-Pacific, however, is expected to experience the fastest growth due to its vast coastal regions, rising seafood consumption, and favorable government initiatives in countries like China, Japan, and India.
COVID-19 initially disrupted the vertical sea farming supply chain, causing delays in farm development projects and affecting seafood sales. However, the pandemic underscored the importance of sustainable food systems, driving renewed interest in vertical sea farming as a resilient and eco-friendly food source.
Key Takeaways
Market Growth: The vertical sea farming market is projected to reach USD 4.56 billion by 2034, with a strong CAGR of 13.1%, driven by increasing demand for sustainable aquaculture and advancements in farming technologies.
Product Type Dominance: Seaweed farming leads the product type segment, accounting for the highest share due to its wide applications in food, cosmetics, and pharmaceuticals, and its low environmental impact compared to fish farming.
Farming Technique Growth: Recirculating Aquaculture Systems (RAS) dominate the farming technique segment, offering efficient water reuse and waste management, making it highly sustainable and increasingly popular in large-scale vertical sea farming operations.
Driver: Growing concerns over food security, climate change, and overfishing are driving the need for sustainable alternatives like vertical sea farming. Governments and investors are actively promoting innovative solutions that balance environmental conservation with food production.
Restraint: High initial investment costs and technological complexity in setting up vertical sea farms remain key restraints. Small-scale operators may struggle with the capital required to adopt advanced farming techniques.
Opportunity: Expansion into untapped coastal regions and the integration of renewable energy sources into vertical sea farming systems present significant growth opportunities for companies looking to optimize sustainability and reduce operational costs.
Trend: Automated monitoring systems are increasingly adopted to enhance farming efficiency and reduce human error.
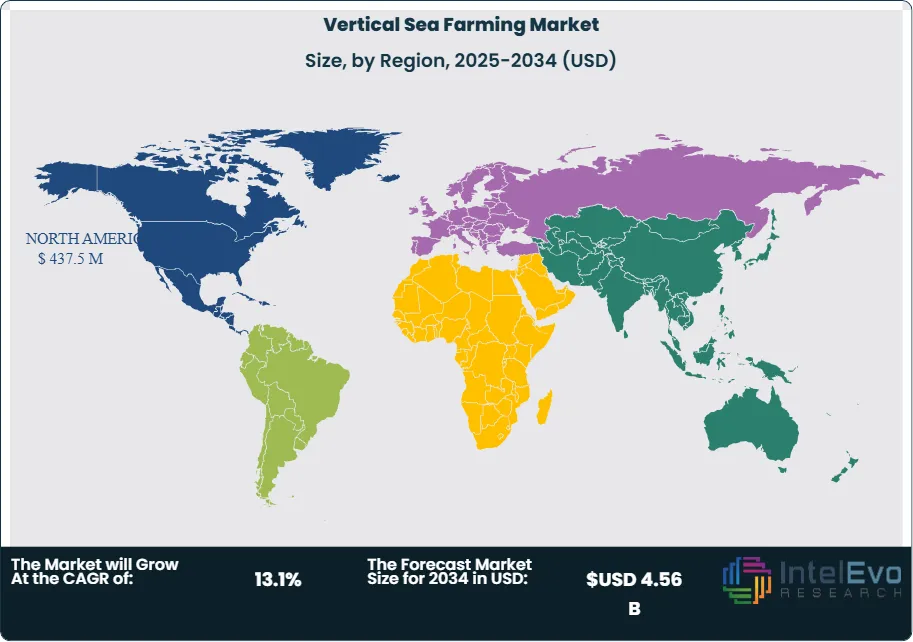
Regional Analysis: North America leads the market, while Asia-Pacific is the fastest-growing region, driven by rising demand for sustainable seafood and favorable government initiatives.
Product Type:
Vertical sea farming includes fish farming, seaweed farming, and aquatic plants. Fish farming focuses on cultivating finfish, shellfish, and crustaceans, which are essential for human consumption and seafood demand. Seaweed farming is rapidly growing due to its diverse uses in food, pharmaceuticals, and industrial applications. Edible seaweed holds a significant market share, while pharmaceutical and industrial seaweed are also gaining traction. Aquatic plants, including algae and grasses, are integral for ecosystem balance, biofuel production, and bioplastics. Each product type plays a unique role in addressing food security and environmental sustainability, contributing to market expansion.
Farming Technique:
Vertical sea farming employs various techniques, including aquaponics, mariculture, integrated multi-trophic aquaculture (IMTA), and recirculating aquaculture systems (RAS). Aquaponics combines fish farming with hydroponics to create a self-sustaining ecosystem, while mariculture focuses on ocean-based farming. IMTA utilizes multiple species within a farm, optimizing nutrient cycles and ecosystem sustainability. RAS technology involves closed-loop systems for water recycling, minimizing environmental impact and enhancing productivity. Each technique offers unique advantages depending on the region, species cultivated, and production scale, driving innovation and scalability within the vertical sea farming market.
Application:
The applications of vertical sea farming span food and beverages, nutraceuticals, pharmaceuticals, cosmetics, and industrial products. In the food sector, the demand for sustainable seafood is growing, with fish, seaweed, and aquatic plants being essential ingredients. Nutraceuticals benefit from the high nutritional value of seaweed and algae, while pharmaceutical applications focus on bioactive compounds derived from marine species for health treatments. Cosmetics use seaweed extracts for skincare products, while industrial applications involve biofuels and bioplastics. These varied applications ensure vertical sea farming’s relevance across multiple industries, boosting market diversification and growth potential.
Technology:
Technological advancements are key drivers in vertical sea farming. Automation and monitoring systems allow farmers to optimize production efficiency by tracking water quality, feed, and growth rates. Water filtration systems play a crucial role in maintaining the health of aquatic species, ensuring sustainable farming practices. Feeding systems reduce labor costs and maximize food utilization, while renewable energy integration, such as solar and wind power, reduces operational costs and minimizes the environmental footprint. The use of advanced technology enables higher yields, cost efficiency, and sustainability, positioning technology as a crucial pillar in market development.
End User:
Vertical sea farming caters to various end users, including commercial farming operations, research institutes, government organizations, NGOs, and private farmers. Commercial farming operations are key players in the market, scaling production to meet rising seafood and plant-based product demand. Research institutes focus on innovations in aquaculture practices and sustainability. Government and NGOs invest in sea farming initiatives to address food security and environmental concerns. Private farmers, though smaller in scale, contribute to localized production and innovation. Each end user group plays a vital role in driving market growth and fostering sustainable aquaculture practices globally.
Region Analysis:
North America Dominates Vertical Sea Farming Market with 35% Share, Driven by Technological Advancements and Sustainability Initiatives. North America currently holds the highest market share in the vertical sea farming market, driven by advanced aquaculture technologies and a strong emphasis on sustainability. The United States and Canada are leading innovators, investing in research and development to optimize farming techniques. The region's affluent consumer base shows increasing demand for sustainably sourced seafood, encouraging investment in vertical farming systems. Government support for eco-friendly practices and grants for sustainable farming technologies contribute to the market's growth. Meanwhile, Europe also boasts a significant share, with countries like Norway and the Netherlands focusing on marine aquaculture, enhancing production capacities and regulatory frameworks.
Asia-Pacific is emerging as the fastest-growing region in the vertical sea farming market, fueled by increasing seafood consumption and population growth. Countries like China, Japan, and India are leveraging their vast coastal areas and traditional aquaculture practices to enhance productivity through vertical farming techniques. The rising demand for sustainable food sources and government initiatives promoting aquaculture development are significant growth drivers. In Latin America, markets are gradually evolving, with Brazil exploring marine farming to diversify its agricultural sector. The Middle East and Africa, while currently smaller in market share, are witnessing growing interest in aquaculture driven by food security concerns, particularly in nations like Egypt and South Africa, setting the stage for future expansion.
By Product Type (Fish Farming, Seaweed Farming, Aquatic Plants), By Farming Technique (Aquaponics, Mariculture, Integrated Multi-Trophic Aquaculture (IMTA), Recirculating Aquaculture Systems (RAS)), By Technology (Automation and Monitoring Systems, Water Filtration Systems, Feeding Systems, Renewable Energy Integration), By End User (Commercial Aquaculture Operators, Research & Development Institutes, Government & NGOs, Private Farmers, Others), By Application (Food Production, Biofuels & Bioproducts, Nutraceuticals & Pharmaceuticals, Others)
Research Methodology
Primary Research- 100 Interviews of Stakeholders
Secondary Research
Desk Research
Regional scope
North America (United States, Canada, Mexico)
Latin America (Brazil, Argentina, Columbia)
East Asia And Pacific (China, Japan, South Korea, Australia, Cambodia, Fiji, Indonesia)
Sea And South Asia (India, Singapore, Thailand, Taiwan, Malaysia)
Eastern Europe (Poland, Russia, Czech Republic, Romania)
Western Europe (Germany, U.K., France, Spain, Itlay)
Middle East & Africa (GCC Countries, Egypt, Nigeria, South Africa, Israel)
Competitive Landscape
Aquabyte, Cargill, Grieg Seafood ASA, Cermaq Group AS, Mowi ASA, AquaBounty Technologies, Aker BioMarine, SalMar ASA, Cooke Aquaculture Inc, Thai Union Group PCL, Ocean Harvest Technology, Kvarøy Arctic, Norwegian Royal Salmon ASA, Hofseth BioCare ASA, BioMar Group, Blue Ocean Mariculture, Kagome Co, Calyst, Tassal Group Ltd., Leroy Seafood Group ASA
Customization Scope
Customization for segments, region/country-level will be provided. Moreover, additional customization can be done based on the requirements.
Pricing and Purchase Options
Avail customized purchase options to meet your exact research needs. We have three licenses to opt for: Single User License, Multi-User License (Up to 5 Users), Corporate Use License (Unlimited User and Printable PDF).
TABLE OF CONTENTS
1. EXECUTIVE SUMMARY
1.1. MARKET SNAPSHOT
1.2. KEY FINDINGS & INSIGHTS
1.3. ANALYST RECOMMENDATIONS
1.4. FUTURE OUTLOOK
2. RESEARCH METHODOLOGY
2.1. MARKET DEFINITION & SCOPE
2.2. RESEARCH OBJECTIVES: PRIMARY & SECONDARY DATA SOURCES
2.3. DATA COLLECTION SOURCES
2.3.1. COVERAGE OF 100+ PRIMARY RESEARCH/CONSULTATION CALLS WITH INDUSTRY STAKEHOLDERS
FIGURE 17 NORTH AMERICA VERTICAL SEA FARMING CURRENT AND FUTURE TYPE ANALYSIS, 2025–2034, (USD MILLION)
FIGURE 18 NORTH AMERICA VERTICAL SEA FARMING CURRENT AND FUTURE END USER ANALYSIS, 2025–2034, (USD MILLION)
FIGURE 19 MARKET SHARE BY COUNTRY
FIGURE 20 LATIN AMERICA VERTICAL SEA FARMING CURRENT AND FUTURE TYPE ANALYSIS, 2025–2034, (USD MILLION)
FIGURE 21 LATIN AMERICA VERTICAL SEA FARMING CURRENT AND FUTURE END USER ANALYSIS, 2025–2034, (USD MILLION)
FIGURE 22 MARKET SHARE BY COUNTRY
FIGURE 23 EASTERN EUROPE VERTICAL SEA FARMING CURRENT AND FUTURE TYPE ANALYSIS, 2025–2034, (USD MILLION)
FIGURE 24 EASTERN EUROPE VERTICAL SEA FARMING CURRENT AND FUTURE END USER ANALYSIS, 2025–2034, (USD MILLION)
FIGURE 25 MARKET SHARE BY COUNTRY
FIGURE 26 WESTERN EUROPE VERTICAL SEA FARMING CURRENT AND FUTURE TYPE ANALYSIS, 2025–2034, (USD MILLION)
FIGURE 27 WESTERN EUROPE VERTICAL SEA FARMING CURRENT AND FUTURE END USER ANALYSIS, 2025–2034, (USD MILLION)
FIGURE 28 MARKET SHARE BY COUNTRY
FIGURE 29 EAST ASIA AND PACIFIC VERTICAL SEA FARMING CURRENT AND FUTURE TYPE ANALYSIS, 2025–2034, (USD MILLION)
FIGURE 30 EAST ASIA AND PACIFIC VERTICAL SEA FARMING CURRENT AND FUTURE END USER ANALYSIS, 2025–2034, (USD MILLION)
FIGURE 31 MARKET SHARE BY COUNTRY
FIGURE 32 SEA AND SOUTH ASIA VERTICAL SEA FARMING CURRENT AND FUTURE TYPE ANALYSIS, 2025–2034, (USD MILLION)
FIGURE 33 SEA AND SOUTH ASIA VERTICAL SEA FARMING CURRENT AND FUTURE END USER ANALYSIS, 2025–2034, (USD MILLION)
FIGURE 34 MARKET SHARE BY COUNTRY
FIGURE 35 MIDDLE EAST AND AFRICA VERTICAL SEA FARMING CURRENT AND FUTURE TYPE ANALYSIS, 2025–2034, (USD MILLION)
FIGURE 36 MIDDLE EAST AND AFRICA VERTICAL SEA FARMING CURRENT AND FUTURE END USER ANALYSIS, 2025–2034, (USD MILLION)
FIGURE 37 NORTH AMERICA VERTICAL SEA FARMING CURRENT AND FUTURE MARKET VOLUME SHARE REGIONAL ANALYSIS, 2025–2034, (USD MILLION)
FIGURE 38 U.S. VERTICAL SEA FARMING CURRENT AND FUTURE TYPE ANALYSIS, 2025–2034, (USD MILLION)
FIGURE 39 U.S. VERTICAL SEA FARMING CURRENT AND FUTURE END USER ANALYSIS, 2025–2034, (USD MILLION)
FIGURE 40 CANADA VERTICAL SEA FARMING CURRENT AND FUTURE TYPE ANALYSIS, 2025–2034, (USD MILLION)
FIGURE 41 CANADA VERTICAL SEA FARMING CURRENT AND FUTURE END USER ANALYSIS, 2025–2034, (USD MILLION)
FIGURE 42 LATIN AMERICA VERTICAL SEA FARMING CURRENT AND FUTURE MARKET VOLUME SHARE REGIONAL ANALYSIS, 2025–2034, (USD MILLION)
FIGURE 43 MEXICO VERTICAL SEA FARMING CURRENT AND FUTURE TYPE ANALYSIS, 2025–2034, (USD MILLION)
FIGURE 44 MEXICO VERTICAL SEA FARMING CURRENT AND FUTURE END USER ANALYSIS, 2025–2034, (USD MILLION)
FIGURE 45 BRAZIL VERTICAL SEA FARMING CURRENT AND FUTURE TYPE ANALYSIS, 2025–2034, (USD MILLION)
FIGURE 46 BRAZIL VERTICAL SEA FARMING CURRENT AND FUTURE END USER ANALYSIS, 2025–2034, (USD MILLION)
FIGURE 47 ARGENTINA VERTICAL SEA FARMING CURRENT AND FUTURE TYPE ANALYSIS, 2025–2034, (USD MILLION)
FIGURE 48 ARGENTINA VERTICAL SEA FARMING CURRENT AND FUTURE END USER ANALYSIS, 2025–2034, (USD MILLION)
FIGURE 49 COLUMBIA VERTICAL SEA FARMING CURRENT AND FUTURE TYPE ANALYSIS, 2025–2034, (USD MILLION)
FIGURE 50 COLUMBIA VERTICAL SEA FARMING CURRENT AND FUTURE END USER ANALYSIS, 2025–2034, (USD MILLION)
FIGURE 51 REST OF LATIN AMERICA VERTICAL SEA FARMING CURRENT AND FUTURE TYPE ANALYSIS, 2025–2034, (USD MILLION)
FIGURE 52 REST OF LATIN AMERICA VERTICAL SEA FARMING CURRENT AND FUTURE END USER ANALYSIS, 2025–2034, (USD MILLION)
FIGURE 53 EASTERN EUROPE VERTICAL SEA FARMING CURRENT AND FUTURE MARKET VOLUME SHARE REGIONAL ANALYSIS, 2025–2034, (USD MILLION)
FIGURE 54 POLAND VERTICAL SEA FARMING CURRENT AND FUTURE TYPE ANALYSIS, 2025–2034, (USD MILLION)
FIGURE 55 POLAND VERTICAL SEA FARMING CURRENT AND FUTURE END USER ANALYSIS, 2025–2034, (USD MILLION)
FIGURE 56 RUSSIA VERTICAL SEA FARMING CURRENT AND FUTURE TYPE ANALYSIS, 2025–2034, (USD MILLION)
FIGURE 57 RUSSIA VERTICAL SEA FARMING CURRENT AND FUTURE END USER ANALYSIS, 2025–2034, (USD MILLION)
FIGURE 58 CZECH REPUBLIC VERTICAL SEA FARMING CURRENT AND FUTURE TYPE ANALYSIS, 2025–2034, (USD MILLION)
FIGURE 59 CZECH REPUBLIC VERTICAL SEA FARMING CURRENT AND FUTURE END USER ANALYSIS, 2025–2034, (USD MILLION)
FIGURE 60 ROMANIA VERTICAL SEA FARMING CURRENT AND FUTURE TYPE ANALYSIS, 2025–2034, (USD MILLION)
FIGURE 61 ROMANIA VERTICAL SEA FARMING CURRENT AND FUTURE END USER ANALYSIS, 2025–2034, (USD MILLION)
FIGURE 62 REST OF EASTERN EUROPE VERTICAL SEA FARMING CURRENT AND FUTURE TYPE ANALYSIS, 2025–2034, (USD MILLION)
FIGURE 63 REST OF EASTERN EUROPE VERTICAL SEA FARMING CURRENT AND FUTURE END USER ANALYSIS, 2025–2034, (USD MILLION)
FIGURE 64 WESTERN EUROPE VERTICAL SEA FARMING CURRENT AND FUTURE MARKET VOLUME SHARE REGIONAL ANALYSIS, 2025–2034, (USD MILLION)
FIGURE 65 GERMANY VERTICAL SEA FARMING CURRENT AND FUTURE TYPE ANALYSIS, 2025–2034, (USD MILLION)
FIGURE 66 GERMANY VERTICAL SEA FARMING CURRENT AND FUTURE END USER ANALYSIS, 2025–2034, (USD MILLION)
FIGURE 67 FRANCE VERTICAL SEA FARMING CURRENT AND FUTURE TYPE ANALYSIS, 2025–2034, (USD MILLION)
FIGURE 68 FRANCE VERTICAL SEA FARMING CURRENT AND FUTURE END USER ANALYSIS, 2025–2034, (USD MILLION)
FIGURE 69 UK VERTICAL SEA FARMING CURRENT AND FUTURE TYPE ANALYSIS, 2025–2034, (USD MILLION)
FIGURE 70 UK VERTICAL SEA FARMING CURRENT AND FUTURE END USER ANALYSIS, 2025–2034, (USD MILLION)
FIGURE 71 SPAIN VERTICAL SEA FARMING CURRENT AND FUTURE TYPE ANALYSIS, 2025–2034, (USD MILLION)
FIGURE 72 SPAIN VERTICAL SEA FARMING CURRENT AND FUTURE END USER ANALYSIS, 2025–2034, (USD MILLION)
FIGURE 73 ITALY VERTICAL SEA FARMING CURRENT AND FUTURE TYPE ANALYSIS, 2025–2034, (USD MILLION)
FIGURE 74 ITALY VERTICAL SEA FARMING CURRENT AND FUTURE END USER ANALYSIS, 2025–2034, (USD MILLION)
FIGURE 75 REST OF WESTERN EUROPE VERTICAL SEA FARMING CURRENT AND FUTURE TYPE ANALYSIS, 2025–2034, (USD MILLION)
FIGURE 76 REST OF WESTERN EUROPE VERTICAL SEA FARMING CURRENT AND FUTURE END USER ANALYSIS, 2025–2034, (USD MILLION)
FIGURE 77 EAST ASIA AND PACIFIC VERTICAL SEA FARMING CURRENT AND FUTURE MARKET VOLUME SHARE REGIONAL ANALYSIS, 2025–2034, (USD MILLION)
FIGURE 78 CHINA VERTICAL SEA FARMING CURRENT AND FUTURE TYPE ANALYSIS, 2025–2034, (USD MILLION)
FIGURE 79 CHINA VERTICAL SEA FARMING CURRENT AND FUTURE END USER ANALYSIS, 2025–2034, (USD MILLION)
FIGURE 80 JAPAN VERTICAL SEA FARMING CURRENT AND FUTURE TYPE ANALYSIS, 2025–2034, (USD MILLION)
FIGURE 81 JAPAN VERTICAL SEA FARMING CURRENT AND FUTURE END USER ANALYSIS, 2025–2034, (USD MILLION)
FIGURE 82 AUSTRALIA VERTICAL SEA FARMING CURRENT AND FUTURE TYPE ANALYSIS, 2025–2034, (USD MILLION)
FIGURE 83 AUSTRALIA VERTICAL SEA FARMING CURRENT AND FUTURE END USER ANALYSIS, 2025–2034, (USD MILLION)
FIGURE 84 CAMBODIA VERTICAL SEA FARMING CURRENT AND FUTURE TYPE ANALYSIS, 2025–2034, (USD MILLION)
FIGURE 85 CAMBODIA VERTICAL SEA FARMING CURRENT AND FUTURE END USER ANALYSIS, 2025–2034, (USD MILLION)
FIGURE 86 FIJI VERTICAL SEA FARMING CURRENT AND FUTURE TYPE ANALYSIS, 2025–2034, (USD MILLION)
FIGURE 87 FIJI VERTICAL SEA FARMING CURRENT AND FUTURE END USER ANALYSIS, 2025–2034, (USD MILLION)
FIGURE 88 INDONESIA VERTICAL SEA FARMING CURRENT AND FUTURE TYPE ANALYSIS, 2025–2034, (USD MILLION)
FIGURE 89 INDONESIA VERTICAL SEA FARMING CURRENT AND FUTURE END USER ANALYSIS, 2025–2034, (USD MILLION)
FIGURE 90 SOUTH KOREA VERTICAL SEA FARMING CURRENT AND FUTURE TYPE ANALYSIS, 2025–2034, (USD MILLION)
FIGURE 91 SOUTH KOREA VERTICAL SEA FARMING CURRENT AND FUTURE END USER ANALYSIS, 2025–2034, (USD MILLION)
FIGURE 92 REST OF EAST ASIA AND PACIFIC VERTICAL SEA FARMING CURRENT AND FUTURE TYPE ANALYSIS, 2025–2034, (USD MILLION)
FIGURE 93 REST OF EAST ASIA AND PACIFIC VERTICAL SEA FARMING CURRENT AND FUTURE END USER ANALYSIS, 2025–2034, (USD MILLION)
FIGURE 94 SEA AND SOUTH ASIA VERTICAL SEA FARMING CURRENT AND FUTURE MARKET VOLUME SHARE REGIONAL ANALYSIS, 2025–2034, (USD MILLION)
FIGURE 95 BANGLADESH VERTICAL SEA FARMING CURRENT AND FUTURE TYPE ANALYSIS, 2025–2034, (USD MILLION)
FIGURE 96 BANGLADESH VERTICAL SEA FARMING CURRENT AND FUTURE END USER ANALYSIS, 2025–2034, (USD MILLION)
FIGURE 97 NEW ZEALAND VERTICAL SEA FARMING CURRENT AND FUTURE TYPE ANALYSIS, 2025–2034, (USD MILLION)
FIGURE 98 NEW ZEALAND VERTICAL SEA FARMING CURRENT AND FUTURE END USER ANALYSIS, 2025–2034, (USD MILLION)
FIGURE 99 INDIA VERTICAL SEA FARMING CURRENT AND FUTURE TYPE ANALYSIS, 2025–2034, (USD MILLION)
FIGURE 100 INDIA VERTICAL SEA FARMING CURRENT AND FUTURE END USER ANALYSIS, 2025–2034, (USD MILLION)
FIGURE 101 SINGAPORE VERTICAL SEA FARMING CURRENT AND FUTURE TYPE ANALYSIS, 2025–2034, (USD MILLION)
FIGURE 102 SINGAPORE VERTICAL SEA FARMING CURRENT AND FUTURE END USER ANALYSIS, 2025–2034, (USD MILLION)
FIGURE 103 THAILAND VERTICAL SEA FARMING CURRENT AND FUTURE TYPE ANALYSIS, 2025–2034, (USD MILLION)
FIGURE 104 THAILAND VERTICAL SEA FARMING CURRENT AND FUTURE END USER ANALYSIS, 2025–2034, (USD MILLION)
FIGURE 105 TAIWAN VERTICAL SEA FARMING CURRENT AND FUTURE TYPE ANALYSIS, 2025–2034, (USD MILLION)
FIGURE 106 TAIWAN VERTICAL SEA FARMING CURRENT AND FUTURE END USER ANALYSIS, 2025–2034, (USD MILLION)
FIGURE 107 MALAYSIA VERTICAL SEA FARMING CURRENT AND FUTURE TYPE ANALYSIS, 2025–2034, (USD MILLION)
FIGURE 108 MALAYSIA VERTICAL SEA FARMING CURRENT AND FUTURE END USER ANALYSIS, 2025–2034, (USD MILLION)
FIGURE 109 REST OF SEA AND SOUTH ASIA VERTICAL SEA FARMING CURRENT AND FUTURE TYPE ANALYSIS, 2025–2034, (USD MILLION)
FIGURE 110 REST OF SEA AND SOUTH ASIA VERTICAL SEA FARMING CURRENT AND FUTURE END USER ANALYSIS, 2025–2034, (USD MILLION)
FIGURE 111 MIDDLE EAST AND AFRICA VERTICAL SEA FARMING CURRENT AND FUTURE MARKET VOLUME SHARE REGIONAL ANALYSIS, 2025–2034, (USD MILLION)
FIGURE 112 GCC COUNTRIES VERTICAL SEA FARMING CURRENT AND FUTURE TYPE ANALYSIS, 2025–2034, (USD MILLION)
FIGURE 113 GCC COUNTRIES VERTICAL SEA FARMING CURRENT AND FUTURE END USER ANALYSIS, 2025–2034, (USD MILLION)
FIGURE 114 SAUDI ARABIA VERTICAL SEA FARMING CURRENT AND FUTURE TYPE ANALYSIS, 2025–2034, (USD MILLION)
FIGURE 115 SAUDI ARABIA VERTICAL SEA FARMING CURRENT AND FUTURE END USER ANALYSIS, 2025–2034, (USD MILLION)
FIGURE 116 UAE VERTICAL SEA FARMING CURRENT AND FUTURE TYPE ANALYSIS, 2025–2034, (USD MILLION)
FIGURE 117 UAE VERTICAL SEA FARMING CURRENT AND FUTURE END USER ANALYSIS, 2025–2034, (USD MILLION)
FIGURE 118 BAHRAIN VERTICAL SEA FARMING CURRENT AND FUTURE TYPE ANALYSIS, 2025–2034, (USD MILLION)
FIGURE 119 BAHRAIN VERTICAL SEA FARMING CURRENT AND FUTURE END USER ANALYSIS, 2025–2034, (USD MILLION)
FIGURE 120 KUWAIT VERTICAL SEA FARMING CURRENT AND FUTURE TYPE ANALYSIS, 2025–2034, (USD MILLION)
FIGURE 121 KUWAIT VERTICAL SEA FARMING CURRENT AND FUTURE END USER ANALYSIS, 2025–2034, (USD MILLION)
FIGURE 122 OMAN VERTICAL SEA FARMING CURRENT AND FUTURE TYPE ANALYSIS, 2025–2034, (USD MILLION)
FIGURE 123 OMAN VERTICAL SEA FARMING CURRENT AND FUTURE END USER ANALYSIS, 2025–2034, (USD MILLION)
FIGURE 124 QATAR VERTICAL SEA FARMING CURRENT AND FUTURE TYPE ANALYSIS, 2025–2034, (USD MILLION)
FIGURE 125 QATAR VERTICAL SEA FARMING CURRENT AND FUTURE END USER ANALYSIS, 2025–2034, (USD MILLION)
FIGURE 126 EGYPT VERTICAL SEA FARMING CURRENT AND FUTURE TYPE ANALYSIS, 2025–2034, (USD MILLION)
FIGURE 127 EGYPT VERTICAL SEA FARMING CURRENT AND FUTURE END USER ANALYSIS, 2025–2034, (USD MILLION)
FIGURE 128 NIGERIA VERTICAL SEA FARMING CURRENT AND FUTURE TYPE ANALYSIS, 2025–2034, (USD MILLION)
FIGURE 129 NIGERIA VERTICAL SEA FARMING CURRENT AND FUTURE END USER ANALYSIS, 2025–2034, (USD MILLION)
FIGURE 130 SOUTH AFRICA VERTICAL SEA FARMING CURRENT AND FUTURE TYPE ANALYSIS, 2025–2034, (USD MILLION)
FIGURE 131 SOUTH AFRICA VERTICAL SEA FARMING CURRENT AND FUTURE END USER ANALYSIS, 2025–2034, (USD MILLION)
FIGURE 132 ISRAEL VERTICAL SEA FARMING CURRENT AND FUTURE TYPE ANALYSIS, 2025–2034, (USD MILLION)
FIGURE 133 ISRAEL VERTICAL SEA FARMING CURRENT AND FUTURE END USER ANALYSIS, 2025–2034, (USD MILLION)
FIGURE 134 REST OF MEA VERTICAL SEA FARMING CURRENT AND FUTURE TYPE ANALYSIS, 2025–2034, (USD MILLION)
FIGURE 135 REST OF MEA VERTICAL SEA FARMING CURRENT AND FUTURE END USER ANALYSIS, 2025–2034, (USD MILLION)
FIGURE 136 U. S. MARKET SHARE ANALYSIS BY TYPE (2024)
FIGURE 137 U. S. MARKET SHARE ANALYSIS BY END USER (2024)
FIGURE 138 CANADA MARKET SHARE ANALYSIS BY TYPE (2024)
FIGURE 139 CANADA MARKET SHARE ANALYSIS BY END USER (2024)
FIGURE 140 MEXICO MARKET SHARE ANALYSIS BY TYPE (2024)
FIGURE 141 MEXICO MARKET SHARE ANALYSIS BY END USER (2024)
FIGURE 142 CHINA MARKET SHARE ANALYSIS BY TYPE (2024)
FIGURE 143 CHINA MARKET SHARE ANALYSIS BY END USER (2024)
FIGURE 144 JAPAN MARKET SHARE ANALYSIS BY TYPE (2024)
FIGURE 145 JAPAN MARKET SHARE ANALYSIS BY END USER (2024)
FIGURE 146 INDIA MARKET SHARE ANALYSIS BY TYPE (2024)
FIGURE 147 INDIA MARKET SHARE ANALYSIS BY END USER (2024)
FIGURE 148 SOUTH KOREA MARKET SHARE ANALYSIS BY TYPE (2024)
FIGURE 149 SOUTH KOREA MARKET SHARE ANALYSIS BY END USER (2024)
FIGURE 150 SAUDI ARABIA MARKET SHARE ANALYSIS BY TYPE (2024)
FIGURE 151 SAUDI ARABIA MARKET SHARE ANALYSIS BY END USER (2024)
FIGURE 152 UAE MARKET SHARE ANALYSIS BY TYPE (2024)
FIGURE 153 UAE MARKET SHARE ANALYSIS BY END USER (2024)
FIGURE 154 EGYPT MARKET SHARE ANALYSIS BY TYPE (2024)
FIGURE 155 EGYPT MARKET SHARE ANALYSIS BY END USER (2024)
FIGURE 156 NIGERIA MARKET SHARE ANALYSIS BY TYPE (2024)
FIGURE 157 NIGERIA MARKET SHARE ANALYSIS BY END USER (2024)
FIGURE 158 SOUTH AFRICA MARKET SHARE ANALYSIS BY TYPE (2024)
FIGURE 159 SOUTH AFRICA MARKET SHARE ANALYSIS BY END USER (2024)
FIGURE 160 GERMANY MARKET SHARE ANALYSIS BY TYPE (2024)
FIGURE 161 GERMANY MARKET SHARE ANALYSIS BY END USER (2024)
FIGURE 162 FRANCE MARKET SHARE ANALYSIS BY TYPE (2024)
FIGURE 163 FRANCE MARKET SHARE ANALYSIS BY END USER (2024)
FIGURE 164 UK MARKET SHARE ANALYSIS BY TYPE (2024)
FIGURE 165 UK MARKET SHARE ANALYSIS BY END USER (2024)
FIGURE 166 SPAIN MARKET SHARE ANALYSIS BY TYPE (2024)
FIGURE 167 SPAIN MARKET SHARE ANALYSIS BY END USER (2024)
FIGURE 168 ITALY MARKET SHARE ANALYSIS BY TYPE (2024)
FIGURE 169 ITALY MARKET SHARE ANALYSIS BY END USER (2024)
FIGURE 170 BRAZIL MARKET SHARE ANALYSIS BY TYPE (2024)
FIGURE 171 BRAZIL MARKET SHARE ANALYSIS BY END USER (2024)
FIGURE 172 ARGENTINA MARKET SHARE ANALYSIS BY TYPE (2024)
FIGURE 173 ARGENTINA MARKET SHARE ANALYSIS BY END USER (2024)
FIGURE 174 COLUMBIA MARKET SHARE ANALYSIS BY TYPE (2024)
FIGURE 175 COLUMBIA MARKET SHARE ANALYSIS BY END USER (2024)
FIGURE 176 GLOBAL VERTICAL SEA FARMING CURRENT AND FUTURE MARKET KEY COUNTRY LEVEL ANALYSIS, 2024–2034, (USD MILLION)
FIGURE 177 FINANCIAL OVERVIEW:
Key Players Analysis:
Aquabyte: Aquabyte is a leading aquaculture technology company that uses artificial intelligence and machine learning to optimize fish farming operations. Based in the United States and Norway, they focus on improving feeding efficiency and fish health. Their strategy involves providing data-driven insights to help farms reduce costs and enhance sustainability.
Cargill, Inc.: Cargill is a global food corporation headquartered in the U.S., offering aquaculture feed solutions to support sustainable fish farming. Their aquafeed products promote healthy growth in fish and shrimp. Cargill’s strategy focuses on innovation and sustainability, helping farmers increase yields while minimizing environmental impact.
Grieg Seafood ASA: Based in Norway, Grieg Seafood is one of the world’s largest salmon farming companies. They produce sustainable farmed Atlantic salmon for global markets. Grieg Seafood’s strategy is centered on operational efficiency, technological innovation, and minimizing environmental footprint through eco-friendly practices and collaborations.
Cermaq Group AS: Cermaq, headquartered in Norway, is a global leader in salmon and trout farming, with operations in Chile, Canada, and Norway. They focus on sustainable aquaculture practices, environmental stewardship, and fish welfare. Their strategy emphasizes transparency, advanced technology, and sustainable growth.
Mowi ASA: Mowi is the largest seafood company globally, headquartered in Norway. They produce farmed salmon and other seafood, with operations in over 25 countries. Mowi’s business strategy includes vertical integration, from feed production to fish farming and processing, ensuring sustainability and traceability throughout the supply chain.
AquaBounty Technologies, Inc.: AquaBounty is a U.S.-based biotech company specializing in genetically engineered salmon for faster growth and reduced resource use. With farms in Canada and the U.S., their strategy focuses on leveraging technology to meet the growing demand for protein while maintaining sustainability in aquaculture.
Aker BioMarine: Aker BioMarine, headquartered in Norway, specializes in krill-based products, including omega-3 supplements and aquafeed. Their vertically integrated supply chain ensures sustainability and traceability. Aker BioMarine’s strategy focuses on maximizing the value of krill while maintaining environmental stewardship through sustainable harvesting practices.
SalMar ASA: SalMar ASA, based in Norway, is one of the world’s largest producers of farmed Atlantic salmon. The company operates in Norway, Scotland, and Iceland. SalMar’s strategy is focused on innovation, including offshore farming technology, to enhance sustainability and production efficiency.
Cooke Aquaculture Inc.: Headquartered in Canada, Cooke Aquaculture is a global leader in farmed salmon, with operations across North America, Europe, and South America. Their business strategy emphasizes vertical integration, innovation, and sustainability, ensuring control over the entire supply chain, from farming to processing.
Thai Union Group PCL: Thai Union is a leading global seafood company based in Thailand, supplying fish, shellfish, and seafood-based products worldwide. They focus on sustainable sourcing and innovation in seafood production. Thai Union’s strategy centers on environmental responsibility, transparency, and enhancing their global presence through partnerships and acquisitions.
Market Key Players
Aquabyte
Cargill, Inc.
Grieg Seafood ASA
Cermaq Group AS
Mowi ASA
AquaBounty Technologies, Inc.
Aker BioMarine
SalMar ASA
Cooke Aquaculture Inc.
Thai Union Group PCL
Ocean Harvest Technology
Kvarøy Arctic
Norwegian Royal Salmon ASA
Hofseth BioCare ASA
BioMar Group
Blue Ocean Mariculture
Kagome Co., Ltd.
Calysta, Inc.
Tassal Group Ltd.
Leroy Seafood Group ASA
Driver:
Growing Demand for Sustainable Seafood
As global populations rise and traditional fisheries face depletion, the demand for sustainable seafood solutions is increasing. Vertical sea farming offers a solution by producing seafood with minimal environmental impact, avoiding overfishing, and optimizing space in coastal areas. Consumer awareness about sustainable food sources and health-conscious eating habits further drives this trend, encouraging investments in aquaculture innovations and expanding the market for eco-friendly, vertically farmed seafood.
Technological Advancements in Aquaculture
Advances in aquaculture technologies, such as automated monitoring systems, recirculating aquaculture systems (RAS), and water filtration techniques, have significantly boosted the efficiency and scalability of vertical sea farming. These innovations reduce operational costs, minimize environmental impacts, and ensure optimal conditions for marine species growth. Enhanced feeding systems and renewable energy integration further contribute to increased productivity, positioning technology as a crucial driver in the vertical sea farming market's rapid expansion.
Government Support and Favorable Policies
Governments worldwide are actively promoting sustainable farming practices to address food security and environmental challenges. Supportive policies, grants, and subsidies for sustainable aquaculture projects are encouraging investment in vertical sea farming. In regions like Asia-Pacific and North America, governments are working with industry stakeholders to implement eco-friendly farming techniques, streamline regulations, and ensure efficient resource management, which significantly boosts market growth and supports long-term development.
Restrain:
High Initial Investment Costs
One of the major restraints in the vertical sea farming market is the high initial capital required to set up these advanced farming systems. The infrastructure for vertical sea farms, including automated systems, water filtration, and energy-efficient technologies, can be expensive, especially for smaller or emerging players. Additionally, the cost of maintaining and operating these systems can deter potential investors. These financial barriers slow down market adoption, particularly in regions with limited access to funding and technology.
Technical and Environmental Challenges
Vertical sea farming faces various technical challenges, such as maintaining optimal water quality, disease management, and ecosystem balance. Additionally, environmental factors like ocean pollution, rising sea temperatures, and extreme weather conditions due to climate change pose risks to vertical sea farms. Managing these variables requires advanced technological interventions, which may not always be available or affordable in certain regions. These technical and environmental complexities hinder the market’s growth, especially in less technologically developed areas.
Opportunities:
Expansion into Untapped Coastal Regions
There is significant potential for vertical sea farming to expand into untapped coastal regions, particularly in emerging markets across Latin America, Africa, and Southeast Asia. These regions have vast coastal areas and are increasingly focusing on food security and sustainable practices. With growing demand for seafood and government incentives promoting aquaculture, companies can capitalize on these regions by introducing innovative farming techniques, tapping into new consumer bases, and driving economic growth while addressing environmental sustainability.
Integration of Renewable Energy in Farming Systems
The integration of renewable energy sources, such as solar, wind, and tidal power, offers a promising opportunity to reduce operational costs and environmental impacts in vertical sea farming. As sustainability becomes a priority, farms that utilize clean energy can enhance productivity while minimizing their carbon footprint. This approach also aligns with global efforts to promote green energy solutions, creating new business opportunities and attracting environmentally conscious investors, further accelerating market expansion and adoption.
Trends:
Adoption of Automated Monitoring Systems
The vertical sea farming market is seeing increased adoption of automated monitoring systems to optimize farming efficiency. These systems use sensors and AI to track water quality, temperature, and feed levels in real-time, ensuring optimal conditions for marine species growth. Automation reduces the need for manual labor, lowers operational costs, and minimizes human error. As technology becomes more accessible and affordable, the trend towards integrating smart farming systems is expected to accelerate, improving overall productivity and sustainability.
Recent Development
August 2024: Mowi ASA announced a strategic partnership with Blue Ocean Mariculture to expand sustainable offshore aquaculture operations. This collaboration focuses on enhancing vertical sea farming techniques using advanced marine technology, aiming to meet the growing demand for sustainably farmed seafood while reducing environmental impact.
July 2024: Grieg Seafood ASA unveiled its new vertically integrated salmon farm in collaboration with AquaBounty Technologies. This partnership seeks to combine advanced genetic engineering with sustainable farming practices to increase salmon production efficiency while promoting environmentally friendly aquaculture.
June 2024: Cargill, Inc. launched a new aquafeed product designed specifically for vertical sea farming systems, incorporating renewable ingredients to improve fish growth rates and reduce waste. The product reflects Cargill's ongoing efforts to promote sustainable practices in the global aquaculture industry.