Global Video Commerce Market Size, Share, Analysis Report Type(Live Streaming, Interactive Videos, Shoppable Content), Platform (Brand Websites, Social Media Platforms, E-Commerce Platforms), End-User (Food and Beverage, Fashion and Apparel, Beauty and Personal Care, Home and Furniture, Electronics and Gadgets, Others(Automotive, Healthcare,etc.)), Region and Key Players - Industry Segment Overview, Market Dynamics, Competitive Strategies, Trends and Forecast 2025-2034
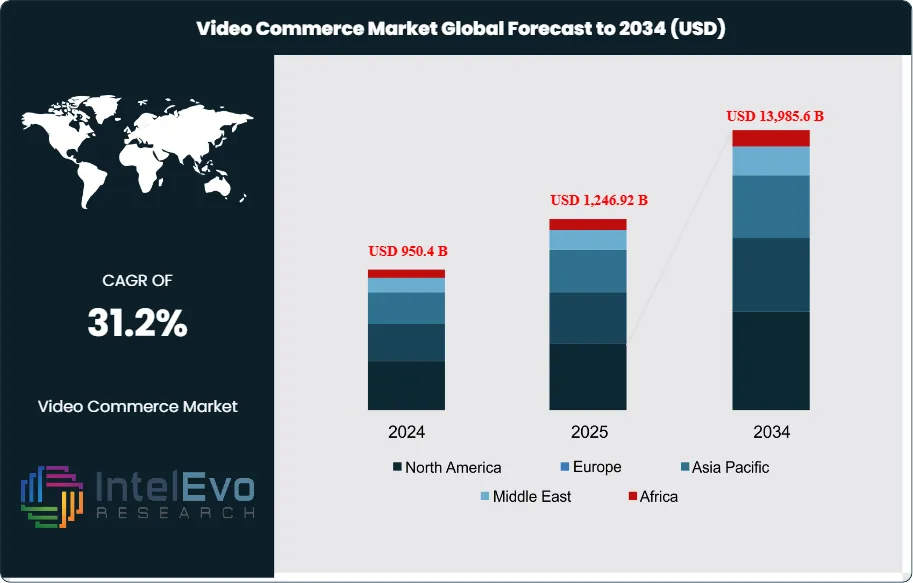
The Video Commerce Market size is projected to reach approximately USD 13,985.6 Billion by 2034, up from USD 950.4 Billion in 2024, growing at a CAGR of 31.2% during the forecast period from 2025 to 2034. The explosive growth of video-driven shopping experiences is transforming global retail as consumers increasingly prefer interactive, shoppable live streams and personalized video marketing. Social media platforms, e-commerce giants, and brands are leveraging AI-powered product recommendations, influencer collaborations, and immersive AR/VR integrations to enhance engagement and conversion rates. As entertainment and retail continue to merge, video commerce is redefining digital shopping behavior — creating new opportunities for real-time interaction, storytelling, and high-impact brand experiences worldwide.
Video commerce represents a revolutionary convergence of digital entertainment and retail technology, fundamentally transforming how consumers discover, evaluate, and purchase products online. This dynamic market encompasses live streaming commerce, interactive video experiences, and shoppable content that seamlessly integrates multimedia presentations with immediate purchasing capabilities. The market's expansion is driven by several critical factors including increased mobile device penetration, enhanced internet infrastructure, evolving consumer preferences toward visual and interactive shopping experiences, and the growing influence of social media platforms as primary discovery channels. Additionally, the integration of artificial intelligence and machine learning technologies has enabled more personalized and targeted video commerce experiences, while advanced analytics provide retailers with unprecedented insights into consumer behavior and engagement patterns.
The video commerce ecosystem continues to evolve rapidly, influenced by technological advancements in augmented reality, virtual reality, and real-time streaming capabilities that create immersive shopping environments. Market growth is further accelerated by the democratization of content creation tools, allowing brands of all sizes to produce professional-quality video content, and the increasing comfort level of consumers with digital payment systems and mobile transactions. The post-pandemic shift toward digital-first shopping behaviors has created a permanent change in consumer expectations, with buyers now demanding more engaging, informative, and interactive online shopping experiences that video commerce uniquely provides through its combination of entertainment value and practical product demonstration.
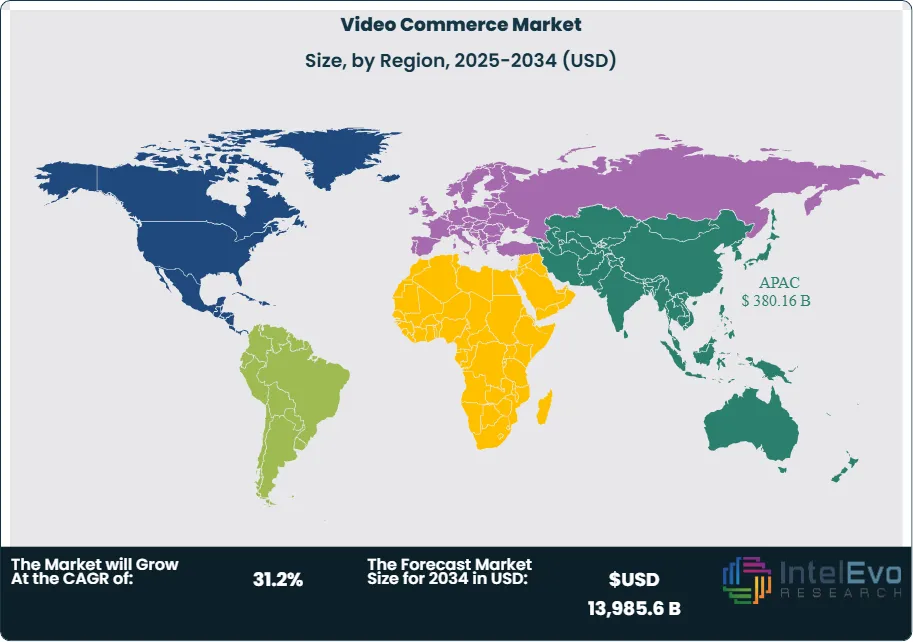
The Asia Pacific region dominates the global video commerce market, accounting for the largest market share due to its advanced mobile commerce infrastructure, high smartphone adoption rates, and cultural acceptance of live streaming as a primary form of entertainment and shopping. Countries like China, South Korea, and Japan have pioneered many video commerce innovations, with platforms like Taobao Live and Douyin establishing the foundational models that are now being adopted globally. The region benefits from supportive regulatory frameworks, robust digital payment systems, and a consumer base that readily embraces new shopping technologies.
The COVID-19 pandemic served as a significant catalyst for video commerce market expansion, accelerating adoption rates by approximately 3-5 years as traditional retail channels faced unprecedented disruptions. Lockdowns and social distancing measures forced both consumers and retailers to rapidly embrace digital alternatives, with video commerce emerging as a crucial bridge between physical and online shopping experiences. The pandemic highlighted the importance of human connection in commerce, making live streaming and interactive video formats particularly appealing as they provided social interaction and real-time engagement that traditional e-commerce lacked, resulting in sustained growth momentum that continues post-pandemic.
Key Takeaways:
Market Growth: The Video Commerce Market is expected to reach USD 13,985.6 Billion by 2034, as brands and platforms recognize the compelling ROI of video-driven engagement. The confluence of social media adoption, influencer marketing, and technological innovation is creating sustained growth momentum across regions and sectors.
Type Dominance: Live streaming dominates the video commerce market due to its ability to deliver real-time interaction, urgency, and authenticity. Consumers are highly responsive to live demonstrations, Q&A sessions, and limited-time offers, making this format the most powerful sales driver.
Platform Dominance: Social media platforms are the primary channel for video commerce, enabling brands to tap into vast audiences where consumers already spend their time. Platforms like TikTok, Instagram, and Facebook blend entertainment and shopping, driving higher conversion rates.
End-User Industry Dominance: Fashion and apparel lead end-user adoption as visual storytelling and real-time try-ons significantly impact buying decisions. Influencers and brands frequently leverage live and shoppable videos to showcase products and drive impulse purchases.
Driver: The surge in smartphone penetration and high-speed connectivity has made video streaming accessible to billions, fueling rapid adoption. Simultaneously, the rise of influencer marketing has created new ways to build trust and drive sales through authentic video content.
Restraint: Data privacy concerns and complex logistics integration present barriers to seamless video commerce execution. Regulatory scrutiny and consumer hesitation about sharing personal data further complicate the environment.
Opportunity: The emergence of AI-powered personalization and AR/VR integration offers significant opportunities to enhance customer engagement and boost conversion rates. Cross-border live commerce is also expanding, unlocking access to international markets.
Trend: Short-form shoppable videos and micro-influencer live streaming are redefining how brands connect with consumers. Gamification elements and limited-time promotions embedded in video experiences are increasing retention and purchase likelihood.
Regional Analysis: Asia Pacific remains the dominant region, driven by China’s mature live commerce infrastructure and cultural affinity for video shopping. North America and Europe are evolving rapidly as brands scale omnichannel strategies. Latin America and the Middle East are emerging as promising markets with rising mobile commerce adoption.
Type Analysis:
Live streaming has emerged as the cornerstone of the video commerce market, accounting for the largest share among video formats. This dominance is rooted in its ability to create real-time connections between sellers and buyers. Live streaming enables brands and influencers to demonstrate products, answer audience questions instantly, and build urgency through time-sensitive offers and scarcity tactics. Viewers are more likely to trust live content over pre-recorded videos because it feels transparent and spontaneous. As a result, conversion rates for live shopping events often exceed traditional e-commerce by a significant margin.
In Asia Pacific, particularly China, platforms like Taobao Live pioneered live commerce, setting new standards for engagement and revenue generation. Influencers and Key Opinion Leaders (KOLs) have become integral to live commerce success, blending entertainment with shopping in a seamless experience. Western markets are catching up, with Amazon Live, Facebook Live Shopping, and Instagram Live Shopping driving increasing adoption. The format is especially popular in fashion and beauty categories where visual detail and demonstration are critical to purchase confidence.
Platform Analysis:
Social Media Platforms Leads With over 45% Market Share In Video Commerce Market. Social media platforms have become the dominant channels for video commerce distribution. Their massive user bases, sophisticated targeting capabilities, and content consumption habits make them ideal environments for shoppable video integration. Consumers already engage with influencers, discover trends, and interact with branded content on social media, reducing friction in the path to purchase. TikTok, Instagram, Facebook, and YouTube have each developed native shopping features, enabling seamless transactions directly within their ecosystems.
The strength of social media platforms lies in their blended approach—combining entertainment, community, and commerce. Features like live shopping tabs, product tagging, and one-click checkout make it easy for brands to turn engagement into revenue. For small businesses and independent creators, social platforms provide a low-barrier entry point to reach audiences without extensive technical infrastructure. As consumers spend increasing time on social media, this segment is expected to see continued investment and innovation.
End-User Industry Analysis:
Fashion and apparel have emerged as the leading end-user industry in video commerce, driven by the inherently visual nature of clothing and accessories. Shoppers are drawn to seeing how garments fit and move in real time, making live and shoppable videos highly persuasive. Influencers and stylists frequently host live sessions showcasing collections, sharing styling tips, and answering questions to build rapport and drive conversion.
For brands, video commerce offers an opportunity to reduce return rates by setting realistic expectations around sizing, color, and fit. It also creates a sense of urgency and exclusivity through time-limited product drops and behind-the-scenes content. The combination of visual storytelling and influencer credibility has made fashion one of the most lucrative categories for video commerce adoption globally.
Region Analysis:
Asia Pacific Leads With nearly 40% Market Share In Video Commerce Market. Asia Pacific leads the global video commerce market, commanding the largest market share due to its advanced mobile commerce infrastructure, high smartphone adoption rates, and cultural acceptance of live streaming as both entertainment and shopping medium. China dominates this regional leadership through platforms like Taobao Live and Douyin, which have established the foundational models for video commerce that are now being replicated globally. The region benefits from supportive regulatory frameworks, robust digital payment systems, and a consumer base that readily embraces new shopping technologies. Countries like South Korea and Japan contribute significantly through their innovative approach to integrating technology with retail experiences.
North America represents the second-largest market, driven by significant investments from major technology companies and established e-commerce platforms. The region shows rapid growth as consumer behavior shifts toward more interactive and engaging shopping experiences, accelerated by pandemic-driven digital adoption. Europe follows closely, with strong growth in markets like the United Kingdom, Germany, and France, where retailers are increasingly recognizing video commerce's potential to differentiate their offerings and improve customer engagement.
The live streaming segment is expected to see the most significant growth in emerging markets across Latin America, Africa, and Southeast Asia, where mobile-first internet adoption creates ideal conditions for video commerce expansion. These regions benefit from leapfrogging traditional e-commerce infrastructure and adopting video commerce as a primary digital shopping format, supported by improving internet connectivity and increasing smartphone penetration rates.
By Type (Live Streaming, Interactive Videos, Shoppable Content), By Component (Platform, Software, Services), By Device Type (Smartphones and Tablets, Laptops and Desktops, Smart TVs, Others (Wearables, AR Glasses)), By Business Model (Business-to-Consumer (B2C), Business-to-Business (B2B), Consumer-to-Consumer (C2C)), By Platform Type (Social Media Platforms (Instagram, TikTok, YouTube), E-commerce Marketplaces, Brand-Owned Websites and Apps, OTT Platforms), By End User (Fashion & Apparel, Beauty & Cosmetics, Electronics & Gadgets, Home Décor & Furniture, Food & Beverage, Others (Luxury, Sports, Automotive))
Research Methodology
Primary Research- 100 Interviews of Stakeholders
Secondary Research
Desk Research
Regional scope
North America (United States, Canada, Mexico)
Latin America (Brazil, Argentina, Columbia)
East Asia And Pacific (China, Japan, South Korea, Australia, Cambodia, Fiji, Indonesia)
Sea And South Asia (India, Singapore, Thailand, Taiwan, Malaysia)
Eastern Europe (Poland, Russia, Czech Republic, Romania)
Western Europe (Germany, U.K., France, Spain, Itlay)
Middle East & Africa (GCC Countries, Egypt, Nigeria, South Africa, Israel)
Customization for segments, region/country-level will be provided. Moreover, additional customization can be done based on the requirements.
Pricing and Purchase Options
Avail customized purchase options to meet your exact research needs. We have three licenses to opt for: Single User License, Multi-User License (Up to 5 Users), Corporate Use License (Unlimited User and Printable PDF).
TABLE OF CONTENTS
1. EXECUTIVE SUMMARY
1.1. MARKET SNAPSHOT
1.2. KEY FINDINGS & INSIGHTS
1.3. ANALYST RECOMMENDATIONS
1.4. FUTURE OUTLOOK
2. RESEARCH METHODOLOGY
2.1. MARKET DEFINITION & SCOPE
2.2. RESEARCH OBJECTIVES: PRIMARY & SECONDARY DATA SOURCES
2.3. DATA COLLECTION SOURCES
2.3.1. COVERAGE OF 100+ PRIMARY RESEARCH/CONSULTATION CALLS WITH INDUSTRY STAKEHOLDERS
FIGURE 17 NORTH AMERICA VIDEO COMMERCE CURRENT AND FUTURE TYPE ANALYSIS, 2025–2034, (USD MILLION)
FIGURE 18 NORTH AMERICA VIDEO COMMERCE CURRENT AND FUTURE END USER ANALYSIS, 2025–2034, (USD MILLION)
FIGURE 19 MARKET SHARE BY COUNTRY
FIGURE 20 LATIN AMERICA VIDEO COMMERCE CURRENT AND FUTURE TYPE ANALYSIS, 2025–2034, (USD MILLION)
FIGURE 21 LATIN AMERICA VIDEO COMMERCE CURRENT AND FUTURE END USER ANALYSIS, 2025–2034, (USD MILLION)
FIGURE 22 MARKET SHARE BY COUNTRY
FIGURE 23 EASTERN EUROPE VIDEO COMMERCE CURRENT AND FUTURE TYPE ANALYSIS, 2025–2034, (USD MILLION)
FIGURE 24 EASTERN EUROPE VIDEO COMMERCE CURRENT AND FUTURE END USER ANALYSIS, 2025–2034, (USD MILLION)
FIGURE 25 MARKET SHARE BY COUNTRY
FIGURE 26 WESTERN EUROPE VIDEO COMMERCE CURRENT AND FUTURE TYPE ANALYSIS, 2025–2034, (USD MILLION)
FIGURE 27 WESTERN EUROPE VIDEO COMMERCE CURRENT AND FUTURE END USER ANALYSIS, 2025–2034, (USD MILLION)
FIGURE 28 MARKET SHARE BY COUNTRY
FIGURE 29 EAST ASIA AND PACIFIC VIDEO COMMERCE CURRENT AND FUTURE TYPE ANALYSIS, 2025–2034, (USD MILLION)
FIGURE 30 EAST ASIA AND PACIFIC VIDEO COMMERCE CURRENT AND FUTURE END USER ANALYSIS, 2025–2034, (USD MILLION)
FIGURE 31 MARKET SHARE BY COUNTRY
FIGURE 32 SEA AND SOUTH ASIA VIDEO COMMERCE CURRENT AND FUTURE TYPE ANALYSIS, 2025–2034, (USD MILLION)
FIGURE 33 SEA AND SOUTH ASIA VIDEO COMMERCE CURRENT AND FUTURE END USER ANALYSIS, 2025–2034, (USD MILLION)
FIGURE 34 MARKET SHARE BY COUNTRY
FIGURE 35 MIDDLE EAST AND AFRICA VIDEO COMMERCE CURRENT AND FUTURE TYPE ANALYSIS, 2025–2034, (USD MILLION)
FIGURE 36 MIDDLE EAST AND AFRICA VIDEO COMMERCE CURRENT AND FUTURE END USER ANALYSIS, 2025–2034, (USD MILLION)
FIGURE 37 NORTH AMERICA VIDEO COMMERCE CURRENT AND FUTURE MARKET VOLUME SHARE REGIONAL ANALYSIS, 2025–2034, (USD MILLION)
FIGURE 38 U.S. VIDEO COMMERCE CURRENT AND FUTURE TYPE ANALYSIS, 2025–2034, (USD MILLION)
FIGURE 39 U.S. VIDEO COMMERCE CURRENT AND FUTURE END USER ANALYSIS, 2025–2034, (USD MILLION)
FIGURE 40 CANADA VIDEO COMMERCE CURRENT AND FUTURE TYPE ANALYSIS, 2025–2034, (USD MILLION)
FIGURE 41 CANADA VIDEO COMMERCE CURRENT AND FUTURE END USER ANALYSIS, 2025–2034, (USD MILLION)
FIGURE 42 LATIN AMERICA VIDEO COMMERCE CURRENT AND FUTURE MARKET VOLUME SHARE REGIONAL ANALYSIS, 2025–2034, (USD MILLION)
FIGURE 43 MEXICO VIDEO COMMERCE CURRENT AND FUTURE TYPE ANALYSIS, 2025–2034, (USD MILLION)
FIGURE 44 MEXICO VIDEO COMMERCE CURRENT AND FUTURE END USER ANALYSIS, 2025–2034, (USD MILLION)
FIGURE 45 BRAZIL VIDEO COMMERCE CURRENT AND FUTURE TYPE ANALYSIS, 2025–2034, (USD MILLION)
FIGURE 46 BRAZIL VIDEO COMMERCE CURRENT AND FUTURE END USER ANALYSIS, 2025–2034, (USD MILLION)
FIGURE 47 ARGENTINA VIDEO COMMERCE CURRENT AND FUTURE TYPE ANALYSIS, 2025–2034, (USD MILLION)
FIGURE 48 ARGENTINA VIDEO COMMERCE CURRENT AND FUTURE END USER ANALYSIS, 2025–2034, (USD MILLION)
FIGURE 49 COLUMBIA VIDEO COMMERCE CURRENT AND FUTURE TYPE ANALYSIS, 2025–2034, (USD MILLION)
FIGURE 50 COLUMBIA VIDEO COMMERCE CURRENT AND FUTURE END USER ANALYSIS, 2025–2034, (USD MILLION)
FIGURE 51 REST OF LATIN AMERICA VIDEO COMMERCE CURRENT AND FUTURE TYPE ANALYSIS, 2025–2034, (USD MILLION)
FIGURE 52 REST OF LATIN AMERICA VIDEO COMMERCE CURRENT AND FUTURE END USER ANALYSIS, 2025–2034, (USD MILLION)
FIGURE 53 EASTERN EUROPE VIDEO COMMERCE CURRENT AND FUTURE MARKET VOLUME SHARE REGIONAL ANALYSIS, 2025–2034, (USD MILLION)
FIGURE 54 POLAND VIDEO COMMERCE CURRENT AND FUTURE TYPE ANALYSIS, 2025–2034, (USD MILLION)
FIGURE 55 POLAND VIDEO COMMERCE CURRENT AND FUTURE END USER ANALYSIS, 2025–2034, (USD MILLION)
FIGURE 56 RUSSIA VIDEO COMMERCE CURRENT AND FUTURE TYPE ANALYSIS, 2025–2034, (USD MILLION)
FIGURE 57 RUSSIA VIDEO COMMERCE CURRENT AND FUTURE END USER ANALYSIS, 2025–2034, (USD MILLION)
FIGURE 58 CZECH REPUBLIC VIDEO COMMERCE CURRENT AND FUTURE TYPE ANALYSIS, 2025–2034, (USD MILLION)
FIGURE 59 CZECH REPUBLIC VIDEO COMMERCE CURRENT AND FUTURE END USER ANALYSIS, 2025–2034, (USD MILLION)
FIGURE 60 ROMANIA VIDEO COMMERCE CURRENT AND FUTURE TYPE ANALYSIS, 2025–2034, (USD MILLION)
FIGURE 61 ROMANIA VIDEO COMMERCE CURRENT AND FUTURE END USER ANALYSIS, 2025–2034, (USD MILLION)
FIGURE 62 REST OF EASTERN EUROPE VIDEO COMMERCE CURRENT AND FUTURE TYPE ANALYSIS, 2025–2034, (USD MILLION)
FIGURE 63 REST OF EASTERN EUROPE VIDEO COMMERCE CURRENT AND FUTURE END USER ANALYSIS, 2025–2034, (USD MILLION)
FIGURE 64 WESTERN EUROPE VIDEO COMMERCE CURRENT AND FUTURE MARKET VOLUME SHARE REGIONAL ANALYSIS, 2025–2034, (USD MILLION)
FIGURE 65 GERMANY VIDEO COMMERCE CURRENT AND FUTURE TYPE ANALYSIS, 2025–2034, (USD MILLION)
FIGURE 66 GERMANY VIDEO COMMERCE CURRENT AND FUTURE END USER ANALYSIS, 2025–2034, (USD MILLION)
FIGURE 67 FRANCE VIDEO COMMERCE CURRENT AND FUTURE TYPE ANALYSIS, 2025–2034, (USD MILLION)
FIGURE 68 FRANCE VIDEO COMMERCE CURRENT AND FUTURE END USER ANALYSIS, 2025–2034, (USD MILLION)
FIGURE 69 UK VIDEO COMMERCE CURRENT AND FUTURE TYPE ANALYSIS, 2025–2034, (USD MILLION)
FIGURE 70 UK VIDEO COMMERCE CURRENT AND FUTURE END USER ANALYSIS, 2025–2034, (USD MILLION)
FIGURE 71 SPAIN VIDEO COMMERCE CURRENT AND FUTURE TYPE ANALYSIS, 2025–2034, (USD MILLION)
FIGURE 72 SPAIN VIDEO COMMERCE CURRENT AND FUTURE END USER ANALYSIS, 2025–2034, (USD MILLION)
FIGURE 73 ITALY VIDEO COMMERCE CURRENT AND FUTURE TYPE ANALYSIS, 2025–2034, (USD MILLION)
FIGURE 74 ITALY VIDEO COMMERCE CURRENT AND FUTURE END USER ANALYSIS, 2025–2034, (USD MILLION)
FIGURE 75 REST OF WESTERN EUROPE VIDEO COMMERCE CURRENT AND FUTURE TYPE ANALYSIS, 2025–2034, (USD MILLION)
FIGURE 76 REST OF WESTERN EUROPE VIDEO COMMERCE CURRENT AND FUTURE END USER ANALYSIS, 2025–2034, (USD MILLION)
FIGURE 77 EAST ASIA AND PACIFIC VIDEO COMMERCE CURRENT AND FUTURE MARKET VOLUME SHARE REGIONAL ANALYSIS, 2025–2034, (USD MILLION)
FIGURE 78 CHINA VIDEO COMMERCE CURRENT AND FUTURE TYPE ANALYSIS, 2025–2034, (USD MILLION)
FIGURE 79 CHINA VIDEO COMMERCE CURRENT AND FUTURE END USER ANALYSIS, 2025–2034, (USD MILLION)
FIGURE 80 JAPAN VIDEO COMMERCE CURRENT AND FUTURE TYPE ANALYSIS, 2025–2034, (USD MILLION)
FIGURE 81 JAPAN VIDEO COMMERCE CURRENT AND FUTURE END USER ANALYSIS, 2025–2034, (USD MILLION)
FIGURE 82 AUSTRALIA VIDEO COMMERCE CURRENT AND FUTURE TYPE ANALYSIS, 2025–2034, (USD MILLION)
FIGURE 83 AUSTRALIA VIDEO COMMERCE CURRENT AND FUTURE END USER ANALYSIS, 2025–2034, (USD MILLION)
FIGURE 84 CAMBODIA VIDEO COMMERCE CURRENT AND FUTURE TYPE ANALYSIS, 2025–2034, (USD MILLION)
FIGURE 85 CAMBODIA VIDEO COMMERCE CURRENT AND FUTURE END USER ANALYSIS, 2025–2034, (USD MILLION)
FIGURE 86 FIJI VIDEO COMMERCE CURRENT AND FUTURE TYPE ANALYSIS, 2025–2034, (USD MILLION)
FIGURE 87 FIJI VIDEO COMMERCE CURRENT AND FUTURE END USER ANALYSIS, 2025–2034, (USD MILLION)
FIGURE 88 INDONESIA VIDEO COMMERCE CURRENT AND FUTURE TYPE ANALYSIS, 2025–2034, (USD MILLION)
FIGURE 89 INDONESIA VIDEO COMMERCE CURRENT AND FUTURE END USER ANALYSIS, 2025–2034, (USD MILLION)
FIGURE 90 SOUTH KOREA VIDEO COMMERCE CURRENT AND FUTURE TYPE ANALYSIS, 2025–2034, (USD MILLION)
FIGURE 91 SOUTH KOREA VIDEO COMMERCE CURRENT AND FUTURE END USER ANALYSIS, 2025–2034, (USD MILLION)
FIGURE 92 REST OF EAST ASIA AND PACIFIC VIDEO COMMERCE CURRENT AND FUTURE TYPE ANALYSIS, 2025–2034, (USD MILLION)
FIGURE 93 REST OF EAST ASIA AND PACIFIC VIDEO COMMERCE CURRENT AND FUTURE END USER ANALYSIS, 2025–2034, (USD MILLION)
FIGURE 94 SEA AND SOUTH ASIA VIDEO COMMERCE CURRENT AND FUTURE MARKET VOLUME SHARE REGIONAL ANALYSIS, 2025–2034, (USD MILLION)
FIGURE 95 BANGLADESH VIDEO COMMERCE CURRENT AND FUTURE TYPE ANALYSIS, 2025–2034, (USD MILLION)
FIGURE 96 BANGLADESH VIDEO COMMERCE CURRENT AND FUTURE END USER ANALYSIS, 2025–2034, (USD MILLION)
FIGURE 97 NEW ZEALAND VIDEO COMMERCE CURRENT AND FUTURE TYPE ANALYSIS, 2025–2034, (USD MILLION)
FIGURE 98 NEW ZEALAND VIDEO COMMERCE CURRENT AND FUTURE END USER ANALYSIS, 2025–2034, (USD MILLION)
FIGURE 99 INDIA VIDEO COMMERCE CURRENT AND FUTURE TYPE ANALYSIS, 2025–2034, (USD MILLION)
FIGURE 100 INDIA VIDEO COMMERCE CURRENT AND FUTURE END USER ANALYSIS, 2025–2034, (USD MILLION)
FIGURE 101 SINGAPORE VIDEO COMMERCE CURRENT AND FUTURE TYPE ANALYSIS, 2025–2034, (USD MILLION)
FIGURE 102 SINGAPORE VIDEO COMMERCE CURRENT AND FUTURE END USER ANALYSIS, 2025–2034, (USD MILLION)
FIGURE 103 THAILAND VIDEO COMMERCE CURRENT AND FUTURE TYPE ANALYSIS, 2025–2034, (USD MILLION)
FIGURE 104 THAILAND VIDEO COMMERCE CURRENT AND FUTURE END USER ANALYSIS, 2025–2034, (USD MILLION)
FIGURE 105 TAIWAN VIDEO COMMERCE CURRENT AND FUTURE TYPE ANALYSIS, 2025–2034, (USD MILLION)
FIGURE 106 TAIWAN VIDEO COMMERCE CURRENT AND FUTURE END USER ANALYSIS, 2025–2034, (USD MILLION)
FIGURE 107 MALAYSIA VIDEO COMMERCE CURRENT AND FUTURE TYPE ANALYSIS, 2025–2034, (USD MILLION)
FIGURE 108 MALAYSIA VIDEO COMMERCE CURRENT AND FUTURE END USER ANALYSIS, 2025–2034, (USD MILLION)
FIGURE 109 REST OF SEA AND SOUTH ASIA VIDEO COMMERCE CURRENT AND FUTURE TYPE ANALYSIS, 2025–2034, (USD MILLION)
FIGURE 110 REST OF SEA AND SOUTH ASIA VIDEO COMMERCE CURRENT AND FUTURE END USER ANALYSIS, 2025–2034, (USD MILLION)
FIGURE 111 MIDDLE EAST AND AFRICA VIDEO COMMERCE CURRENT AND FUTURE MARKET VOLUME SHARE REGIONAL ANALYSIS, 2025–2034, (USD MILLION)
FIGURE 112 GCC COUNTRIES VIDEO COMMERCE CURRENT AND FUTURE TYPE ANALYSIS, 2025–2034, (USD MILLION)
FIGURE 113 GCC COUNTRIES VIDEO COMMERCE CURRENT AND FUTURE END USER ANALYSIS, 2025–2034, (USD MILLION)
FIGURE 114 SAUDI ARABIA VIDEO COMMERCE CURRENT AND FUTURE TYPE ANALYSIS, 2025–2034, (USD MILLION)
FIGURE 115 SAUDI ARABIA VIDEO COMMERCE CURRENT AND FUTURE END USER ANALYSIS, 2025–2034, (USD MILLION)
FIGURE 116 UAE VIDEO COMMERCE CURRENT AND FUTURE TYPE ANALYSIS, 2025–2034, (USD MILLION)
FIGURE 117 UAE VIDEO COMMERCE CURRENT AND FUTURE END USER ANALYSIS, 2025–2034, (USD MILLION)
FIGURE 118 BAHRAIN VIDEO COMMERCE CURRENT AND FUTURE TYPE ANALYSIS, 2025–2034, (USD MILLION)
FIGURE 119 BAHRAIN VIDEO COMMERCE CURRENT AND FUTURE END USER ANALYSIS, 2025–2034, (USD MILLION)
FIGURE 120 KUWAIT VIDEO COMMERCE CURRENT AND FUTURE TYPE ANALYSIS, 2025–2034, (USD MILLION)
FIGURE 121 KUWAIT VIDEO COMMERCE CURRENT AND FUTURE END USER ANALYSIS, 2025–2034, (USD MILLION)
FIGURE 122 OMAN VIDEO COMMERCE CURRENT AND FUTURE TYPE ANALYSIS, 2025–2034, (USD MILLION)
FIGURE 123 OMAN VIDEO COMMERCE CURRENT AND FUTURE END USER ANALYSIS, 2025–2034, (USD MILLION)
FIGURE 124 QATAR VIDEO COMMERCE CURRENT AND FUTURE TYPE ANALYSIS, 2025–2034, (USD MILLION)
FIGURE 125 QATAR VIDEO COMMERCE CURRENT AND FUTURE END USER ANALYSIS, 2025–2034, (USD MILLION)
FIGURE 126 EGYPT VIDEO COMMERCE CURRENT AND FUTURE TYPE ANALYSIS, 2025–2034, (USD MILLION)
FIGURE 127 EGYPT VIDEO COMMERCE CURRENT AND FUTURE END USER ANALYSIS, 2025–2034, (USD MILLION)
FIGURE 128 NIGERIA VIDEO COMMERCE CURRENT AND FUTURE TYPE ANALYSIS, 2025–2034, (USD MILLION)
FIGURE 129 NIGERIA VIDEO COMMERCE CURRENT AND FUTURE END USER ANALYSIS, 2025–2034, (USD MILLION)
FIGURE 130 SOUTH AFRICA VIDEO COMMERCE CURRENT AND FUTURE TYPE ANALYSIS, 2025–2034, (USD MILLION)
FIGURE 131 SOUTH AFRICA VIDEO COMMERCE CURRENT AND FUTURE END USER ANALYSIS, 2025–2034, (USD MILLION)
FIGURE 132 ISRAEL VIDEO COMMERCE CURRENT AND FUTURE TYPE ANALYSIS, 2025–2034, (USD MILLION)
FIGURE 133 ISRAEL VIDEO COMMERCE CURRENT AND FUTURE END USER ANALYSIS, 2025–2034, (USD MILLION)
FIGURE 134 REST OF MEA VIDEO COMMERCE CURRENT AND FUTURE TYPE ANALYSIS, 2025–2034, (USD MILLION)
FIGURE 135 REST OF MEA VIDEO COMMERCE CURRENT AND FUTURE END USER ANALYSIS, 2025–2034, (USD MILLION)
FIGURE 136 U. S. MARKET SHARE ANALYSIS BY TYPE (2024)
FIGURE 137 U. S. MARKET SHARE ANALYSIS BY END USER (2024)
FIGURE 138 CANADA MARKET SHARE ANALYSIS BY TYPE (2024)
FIGURE 139 CANADA MARKET SHARE ANALYSIS BY END USER (2024)
FIGURE 140 MEXICO MARKET SHARE ANALYSIS BY TYPE (2024)
FIGURE 141 MEXICO MARKET SHARE ANALYSIS BY END USER (2024)
FIGURE 142 CHINA MARKET SHARE ANALYSIS BY TYPE (2024)
FIGURE 143 CHINA MARKET SHARE ANALYSIS BY END USER (2024)
FIGURE 144 JAPAN MARKET SHARE ANALYSIS BY TYPE (2024)
FIGURE 145 JAPAN MARKET SHARE ANALYSIS BY END USER (2024)
FIGURE 146 INDIA MARKET SHARE ANALYSIS BY TYPE (2024)
FIGURE 147 INDIA MARKET SHARE ANALYSIS BY END USER (2024)
FIGURE 148 SOUTH KOREA MARKET SHARE ANALYSIS BY TYPE (2024)
FIGURE 149 SOUTH KOREA MARKET SHARE ANALYSIS BY END USER (2024)
FIGURE 150 SAUDI ARABIA MARKET SHARE ANALYSIS BY TYPE (2024)
FIGURE 151 SAUDI ARABIA MARKET SHARE ANALYSIS BY END USER (2024)
FIGURE 152 UAE MARKET SHARE ANALYSIS BY TYPE (2024)
FIGURE 153 UAE MARKET SHARE ANALYSIS BY END USER (2024)
FIGURE 154 EGYPT MARKET SHARE ANALYSIS BY TYPE (2024)
FIGURE 155 EGYPT MARKET SHARE ANALYSIS BY END USER (2024)
FIGURE 156 NIGERIA MARKET SHARE ANALYSIS BY TYPE (2024)
FIGURE 157 NIGERIA MARKET SHARE ANALYSIS BY END USER (2024)
FIGURE 158 SOUTH AFRICA MARKET SHARE ANALYSIS BY TYPE (2024)
FIGURE 159 SOUTH AFRICA MARKET SHARE ANALYSIS BY END USER (2024)
FIGURE 160 GERMANY MARKET SHARE ANALYSIS BY TYPE (2024)
FIGURE 161 GERMANY MARKET SHARE ANALYSIS BY END USER (2024)
FIGURE 162 FRANCE MARKET SHARE ANALYSIS BY TYPE (2024)
FIGURE 163 FRANCE MARKET SHARE ANALYSIS BY END USER (2024)
FIGURE 164 UK MARKET SHARE ANALYSIS BY TYPE (2024)
FIGURE 165 UK MARKET SHARE ANALYSIS BY END USER (2024)
FIGURE 166 SPAIN MARKET SHARE ANALYSIS BY TYPE (2024)
FIGURE 167 SPAIN MARKET SHARE ANALYSIS BY END USER (2024)
FIGURE 168 ITALY MARKET SHARE ANALYSIS BY TYPE (2024)
FIGURE 169 ITALY MARKET SHARE ANALYSIS BY END USER (2024)
FIGURE 170 BRAZIL MARKET SHARE ANALYSIS BY TYPE (2024)
FIGURE 171 BRAZIL MARKET SHARE ANALYSIS BY END USER (2024)
FIGURE 172 ARGENTINA MARKET SHARE ANALYSIS BY TYPE (2024)
FIGURE 173 ARGENTINA MARKET SHARE ANALYSIS BY END USER (2024)
FIGURE 174 COLUMBIA MARKET SHARE ANALYSIS BY TYPE (2024)
FIGURE 175 COLUMBIA MARKET SHARE ANALYSIS BY END USER (2024)
FIGURE 176 GLOBAL VIDEO COMMERCE CURRENT AND FUTURE MARKET KEY COUNTRY LEVEL ANALYSIS, 2024–2034, (USD MILLION)
FIGURE 177 FINANCIAL OVERVIEW:
Key Players Analysis:
Amazon.com, Inc.: Amazon dominates the video commerce landscape through its massive customer base, advanced logistics infrastructure, and comprehensive ecosystem of services including Prime Video, Alexa, and AWS. The company's video commerce strategy leverages its existing marketplace dominance by integrating video content with its sophisticated recommendation algorithms and one-click purchasing capabilities. Amazon's investment in original content creation, influencer partnerships, and live streaming capabilities through Amazon Live demonstrates its commitment to capturing a larger share of the video commerce market. The company's ability to provide seamless integration between video discovery, product evaluation, and fulfillment creates a competitive advantage that smaller players struggle to match.
Meta (Facebook/Instagram): Meta's video commerce strategy centers on leveraging its massive social media platforms to create seamless shopping experiences within existing user engagement patterns. The company's investment in Instagram Shopping, Facebook Marketplace, and WhatsApp Business demonstrates its commitment to integrating commerce functionality across its entire ecosystem. Meta's strength lies in its sophisticated audience targeting capabilities, extensive user behavior data, and established creator economy that enables effective influencer partnerships and user-generated content strategies.
Alibaba Group: Alibaba pioneered many of the video commerce innovations that are now standard across the industry, particularly through its Taobao Live platform which established the live streaming commerce model. The company's integrated ecosystem of e-commerce, payments, logistics, and cloud services provides a comprehensive foundation for video commerce operations that competitors struggle to replicate. Alibaba's strength in the Chinese market, combined with its expanding international presence, positions it as a key player in global video commerce development.
YouTube (Google): YouTube's video commerce strategy leverages its position as the world's largest video platform to create natural integration between content consumption and product discovery. The company's investment in creator monetization tools, brand partnership facilitators, and integrated shopping features demonstrates its commitment to capturing video commerce opportunities while maintaining its core content focus. YouTube's strength lies in its massive content library, sophisticated recommendation algorithms, and established creator economy that provides authentic product demonstrations and reviews.
TikTok: TikTok's video commerce strategy focuses on leveraging its highly engaged user base and algorithm-driven content discovery to create viral shopping experiences. The company's investment in TikTok Shop, creator monetization tools, and brand partnership programs demonstrates its commitment to capturing video commerce opportunities while maintaining its core entertainment focus. TikTok's strength lies in its ability to create viral content that drives massive product awareness and purchasing intent through authentic, user-generated demonstrations and reviews.
Market Key Players
TalkShopLive
Alibaba Group
LiveScale
Shopify Inc.
ShopShops
Amazon.com, Inc.
BuyWith
YouTube
Wayfair Inc.
LiSA
Meta
TikTok
Firework
Bambuser
Channelize.io
Driver:
Proliferation of Smartphones and High-Speed Connectivity:
The global expansion of 4G and 5G networks, along with affordable smartphones, has created a fertile environment for video commerce to flourish. Billions of consumers now have the bandwidth to stream high-definition video without interruption, enabling seamless participation in live shopping events and interactive experiences. Mobile-first markets such as China, India, and Southeast Asia have seen the most rapid adoption, as consumers increasingly prefer to shop via their smartphones rather than desktops. This connectivity infrastructure has reduced technological barriers and empowered small businesses and individual sellers to reach audiences in real time.
Rise of Influencer Marketing and Creator Economy:
The explosion of influencer marketing has been a crucial catalyst in popularizing video commerce. Consumers increasingly trust recommendations from influencers and creators they follow, perceiving them as more authentic and relatable than traditional advertising. This shift has led to the emergence of the “creator economy,” where influencers not only endorse products but also host live shopping events and shoppable video content. As brands collaborate with micro- and macro-influencers to drive sales through video, this model has become a powerful revenue engine across sectors.
Restrain:
Data Privacy and Regulatory Challenges:
The video commerce market faces growing scrutiny over data privacy, particularly regarding user tracking, consent, and secure payment processing. Regulations such as the GDPR in Europe and evolving privacy laws in North America impose strict compliance requirements on how consumer data is collected and utilized. For brands and platforms, this creates additional operational complexity and the risk of penalties for non-compliance. Furthermore, consumer concerns over data misuse can erode trust, impacting adoption rates.
Logistics and Fulfillment Integration:
While video commerce excels in driving engagement and sales, many retailers struggle to integrate it with logistics and fulfillment systems effectively. Ensuring real-time inventory updates, managing rapid order processing, and delivering on fast shipping expectations can be challenging, especially for small sellers. Disconnected systems risk disappointing customers with stockouts or delays, undermining the positive experience created by video content.
Opportunities:
AI-Powered Personalization:
Artificial intelligence presents a significant opportunity to elevate video commerce by personalizing content recommendations and product suggestions. By analyzing user behavior, purchase history, and preferences, AI can dynamically surface the most relevant products during live streams and shoppable videos. This tailored approach increases engagement and conversion rates, helping brands stand out in an increasingly crowded market.
AR/VR Integration in Video Shopping:
The integration of augmented reality (AR) and virtual reality (VR) technologies holds immense potential for enhancing video commerce experiences. Consumers can virtually try on clothing, visualize furniture in their homes, or explore products in 3D before purchasing. As AR/VR hardware becomes more accessible, this immersive approach will help reduce returns and increase buyer confidence.
Trends:
Short-Form Shoppable Videos:
Short-form video platforms such as TikTok and Instagram Reels have popularized snackable, entertaining content that seamlessly blends product discovery with commerce. Brands increasingly produce quick, engaging videos with embedded product links, leveraging impulse buying behaviors. This trend is especially effective with Gen Z consumers who prefer fast, visually rich content over long-form presentations.
Gamification and Limited-Time Promotions:
Gamified elements—such as countdown timers, flash sales, and interactive polls—are becoming central to video commerce strategies. By incorporating urgency and participation incentives, brands can drive higher engagement and conversion rates. Limited-time promotions during live streams encourage spontaneous purchases and foster community excitement around product launches.
Recent Development:
In May 2025: New Generation (New Gen), a forward-thinking technology startup focused on revolutionizing commerce for the AI-driven internet, has officially launched today, backed by $4.5 million in seed funding. The company is setting out to transform the way brands interact with both human shoppers and AI-powered shopping assistants.
In April 2025: Amazon has made a last-minute bid to acquire TikTok, submitting its offer just days before the April 5 deadline that requires the popular video platform to divest from its Chinese parent company, ByteDance, or face a ban in the United States. The proposal was delivered in a letter addressed to Vice President JD Vance and Commerce Secretary Howard Lutnick.