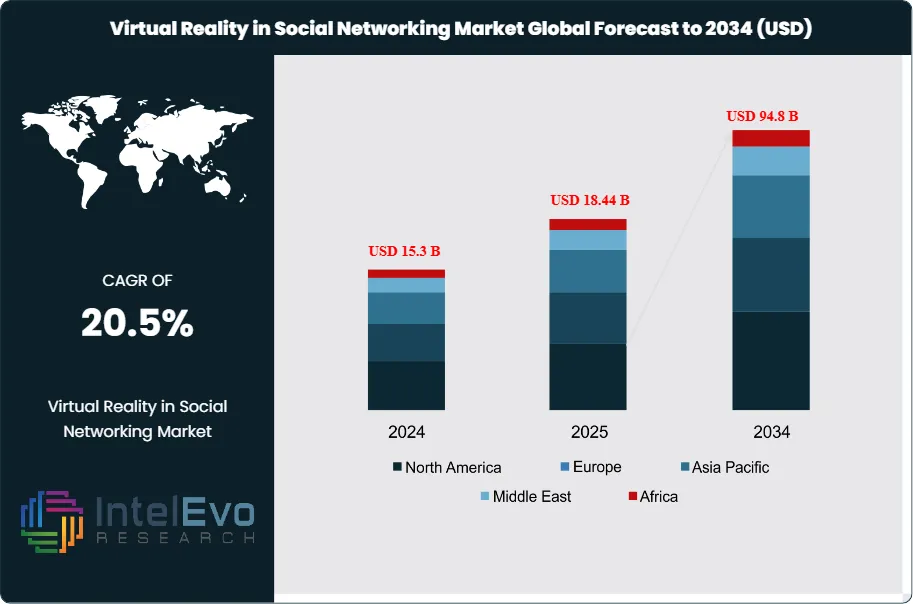
The Global Virtual Reality in Social Networking Market size is projected to reach approximately USD 94.8 billion by 2034, up from around USD 15.3 billion in 2024, expanding at a CAGR of 20.5% during the forecast period from 2025 to 2034. The growth is being fueled by the rising adoption of immersive VR platforms that enable enhanced social interactions, virtual communities, and metaverse-based experiences. With Gen Z and Millennials driving digital engagement, VR-powered networking is expected to redefine communication, entertainment, and online collaboration in the coming years.
The Virtual Reality in Social Networking Market revolves around integrating virtual reality (VR) technology into social media platforms, providing immersive and interactive experiences. This market includes hardware (VR headsets), software, and platforms that enable users to interact in virtual spaces. With growing consumer interest in immersive digital experiences, the current market is driven by advancements in VR technology, such as improved graphics, lower latency, and the rise of social VR platforms like Meta’s Horizon Worlds. As of 2024, the market is valued at USD 14.7 billion, reflecting an early-stage but rapidly expanding sector, primarily due to its strong appeal in gaming, entertainment, and business communication.
The growth dynamics of the Virtual Reality in Social Networking market are fueled by several factors. One of the key drivers is the increasing demand for enhanced social interaction experiences, particularly in the wake of the Metaverse concept, where VR plays a central role. Advancements in hardware, like VR headsets becoming more affordable and user-friendly, have also bolstered the market's growth. Additionally, the expansion of high-speed internet and 5G networks is expected to enhance VR’s real-time social interaction capabilities, contributing to further adoption. Other growth drivers include the rising interest in virtual events, virtual hangouts, and VR-based corporate collaboration tools, which are transforming how individuals and businesses communicate.
North America leads the VR in Social Networking market, driven by significant investments in VR technology, an early adopter culture, and the presence of tech giants like Meta, Microsoft, and Google. The Asia-Pacific region is also experiencing rapid growth, with countries like China and Japan heavily investing in VR technologies. The rise of 5G and increasing digitalization are major contributors to market expansion in this region. Europe is also showing steady growth, particularly in sectors like virtual tourism and entertainment. Latin America and the Middle East are emerging markets, with increasing interest in VR for entertainment and business uses.
The COVID-19 pandemic had a mixed impact on the market. On one hand, it accelerated the adoption of virtual reality as lockdowns and social distancing increased the demand for virtual interactions. VR social platforms, virtual events, and immersive entertainment became essential in keeping people connected. However, the pandemic also disrupted the supply chain for VR hardware, causing delays in production and a shortage of components. Despite these challenges, the increased reliance on digital interactions during the pandemic has had a long-term positive impact, positioning VR in social networking as a vital tool for the future of communication and entertainment.
Key Takeaways:
Market Growth: The Virtual Reality in Social Networking Market is expected to reach USD 94.8 billion by 2034, growing at a robust 20.5% CAGR, reflecting the rising integration of immersive technology in social platforms.
Component Segment Analysis: The hardware segment, consisting of VR headsets and accessories, dominates the market due to increasing demand for immersive experiences. Advancements in device affordability and performance are key growth contributors.
Application Segment Analysis: The software segment is expanding rapidly as social VR platforms, applications, and games gain popularity. Innovations in user interfaces and VR environments are enhancing user engagement.
Driver: The rapid adoption of the Metaverse concept, where virtual worlds enable immersive social interactions, is a primary driver. Technological advancements in VR hardware and software also fuel market growth.
Restraint: High costs of VR hardware and limited content availability pose challenges to mass adoption. Additionally, motion sickness and technological barriers hinder widespread acceptance among certain user groups.
Opportunity: Expansion of 5G technology will enable more seamless and real-time VR experiences, creating opportunities for businesses to enhance virtual social interactions, virtual events, and professional collaboration.
Trend: Increased focus on wireless VR headsets for enhanced mobility and user experience is a significant trend in the market.
Regional Analysis: North America leads the market, with Asia-Pacific emerging as a fast-growing region due to heavy investments in VR technology and digital infrastructure.
Component Segment:
The Virtual Reality in Social Networking market is divided into hardware, software, and services. Hardware, including VR headsets and accessories, constitutes the largest share due to the essential role of these devices in delivering immersive experiences. Major players like Meta (Oculus), HTC, and Sony continue to innovate, offering more affordable, comfortable, and high-performance devices. Software development is also growing, particularly with platforms that enhance social interactions in virtual spaces. The services segment supports this ecosystem through content creation, platform management, and maintenance. As VR technology evolves, the demand for both high-quality hardware and intuitive, interactive software is expected to grow, ensuring users have engaging and immersive social networking experiences.
Application Segment:
The application segment covers various uses of VR within social networking, including gaming, education, healthcare, business collaboration, and more. Gaming is currently the dominant application, as it blends entertainment with social interactions in virtual environments. However, business and collaboration applications are growing rapidly, with many companies adopting VR for virtual meetings, team collaboration, and remote training. Education is also seeing increased adoption as VR allows for immersive learning experiences. Virtual social gatherings, events, and even therapy sessions are expanding the scope of VR beyond entertainment, making it a versatile tool for both personal and professional use.
Device Type Segment:
VR devices are categorized into standalone VR devices, smartphone-based VR devices, and PC-connected VR devices. Standalone VR devices, like Meta Quest, are becoming more popular due to their convenience and portability, requiring no external hardware. Smartphone-based VR devices, though cheaper and more accessible, are losing market share as standalone devices offer better performance and user experience. PC-connected VR devices, used for high-end gaming and professional applications, continue to hold a significant share among enthusiasts and businesses. The evolution of hardware, particularly standalone devices, is a driving factor behind broader VR adoption, making it easier for users to engage in virtual social spaces.
End-User Segment:
This segment divides the market between individual users and enterprises. Individual users, mainly gamers and social network users, currently dominate the market, driving demand for more immersive social experiences. Enterprises, however, are increasing their adoption of VR for training, collaboration, and virtual events. VR is becoming a key tool for remote work, allowing businesses to create virtual offices and meeting spaces. The growth of the enterprise segment is significant as companies explore VR to enhance employee interaction, improve customer engagement, and create immersive brand experiences. As the technology matures, more businesses are expected to adopt VR for their social networking and collaboration needs.
Region Analysis:
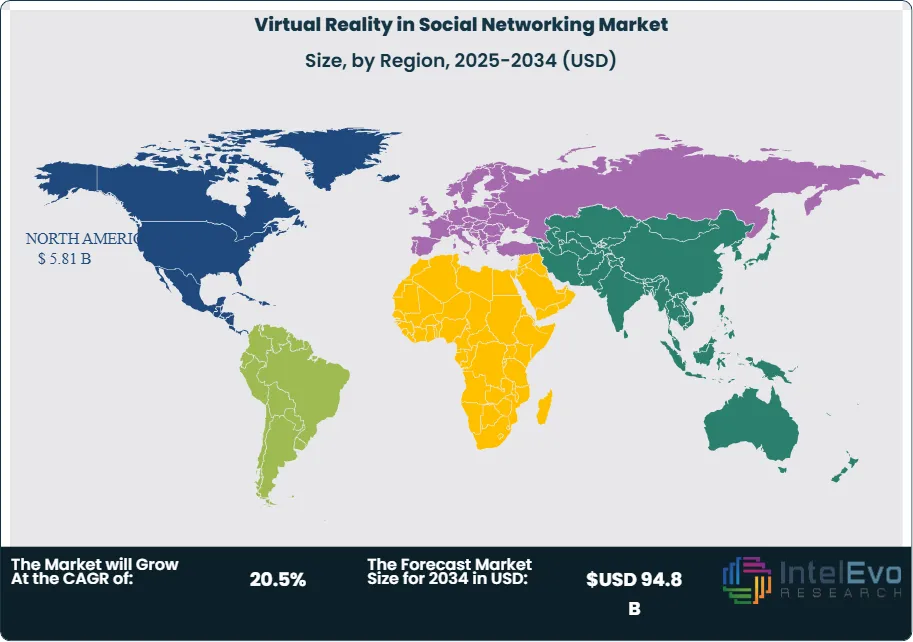
North America Leads With Significant Market Share in Virtual Reality in Social Networking Market: North America holds the highest market share in the Virtual Reality in Social Networking market, driven by the region's strong technological infrastructure and significant investments in VR hardware and software. The presence of major VR companies like Meta (formerly Facebook), Google, and Microsoft has accelerated advancements in VR technology, making it more accessible to consumers and businesses. High disposable incomes, coupled with widespread use of social media platforms that integrate VR, contribute to the region's dominance. Furthermore, the early adoption of 5G networks enhances the performance of VR applications, allowing for more immersive experiences. The entertainment, gaming, and corporate sectors in North America are increasingly integrating VR into social networking, pushing the market's growth in this region.
The Asia-Pacific region is the fastest-growing market for Virtual Reality in Social Networking, fueled by rising investments in digital infrastructure, especially in countries like China, Japan, and South Korea. The proliferation of smartphones and the growing adoption of VR technology across industries such as gaming, education, and healthcare are key drivers of this growth. Governments in the region are also promoting VR technology through strategic initiatives and funding, further accelerating market expansion. Additionally, the region’s large population of tech-savvy users and social media enthusiasts creates a robust demand for virtual social experiences. Other regions, such as Europe and Latin America, are experiencing steady growth, with increasing adoption in gaming and professional applications, while the Middle East and Africa are gradually expanding their market presence.
By Component (VR Hardware (Headsets, Controllers, Sensors), VR Software & Applications, VR Platforms & Services), By Technology (3D Virtual Reality, Augmented Virtual Reality, Mixed Reality & Extended Reality (XR)), By Device Type (Standalone VR Devices, Smartphone-Based VR Devices, PC-Connected VR Devices), By Deployment Mode (On-Premises, Cloud-Based), By Application (Virtual Social Platforms & Communities, Virtual Events & Entertainment, Online Dating & Social Engagement, Business Networking & Collaboration, Gaming-based Social Networking, Others), By End-User (Individual Consumers, Enterprises & Businesses, Educational & Institutional Users, Content Creators & Influencers)
Research Methodology
Primary Research- 100 Interviews of Stakeholders
Secondary Research
Desk Research
Regional scope
North America (United States, Canada, Mexico)
Latin America (Brazil, Argentina, Columbia)
East Asia And Pacific (China, Japan, South Korea, Australia, Cambodia, Fiji, Indonesia)
Sea And South Asia (India, Singapore, Thailand, Taiwan, Malaysia)
Eastern Europe (Poland, Russia, Czech Republic, Romania)
Western Europe (Germany, U.K., France, Spain, Itlay)
Middle East & Africa (GCC Countries, Egypt, Nigeria, South Africa, Israel)
Competitive Landscape
Meta Platforms Inc., HTC Corporation, Sony Interactive Entertainment, Valve Corporation, Microsoft Corporation, NVIDIA Corporation, Unity Technologies, Snap Inc., Google LLC, Magic Leap Inc., Samsung Electronics Co. Ltd., Apple Inc., Alibaba Group, Pico Interactive, Roblox Corporation, Immersive Tech Ltd., Zspace Inc., VIVEPORT, Virtuix Inc., Dreamscape Immersive
Customization Scope
Customization for segments, region/country-level will be provided. Moreover, additional customization can be done based on the requirements.
Pricing and Purchase Options
Avail customized purchase options to meet your exact research needs. We have three licenses to opt for: Single User License, Multi-User License (Up to 5 Users), Corporate Use License (Unlimited User and Printable PDF).
TABLE OF CONTENTS
1. EXECUTIVE SUMMARY
1.1. MARKET SNAPSHOT
1.2. KEY FINDINGS & INSIGHTS
1.3. ANALYST RECOMMENDATIONS
1.4. FUTURE OUTLOOK
2. RESEARCH METHODOLOGY
2.1. MARKET DEFINITION & SCOPE
2.2. RESEARCH OBJECTIVES: PRIMARY & SECONDARY DATA SOURCES
2.3. DATA COLLECTION SOURCES
2.3.1. COVERAGE OF 100+ PRIMARY RESEARCH/CONSULTATION CALLS WITH INDUSTRY STAKEHOLDERS
FIGURE 17 NORTH AMERICA VIRTUAL REALITY IN SOCIAL NETWORKING CURRENT AND FUTURE TYPE ANALYSIS, 2025–2034, (USD MILLION)
FIGURE 18 NORTH AMERICA VIRTUAL REALITY IN SOCIAL NETWORKING CURRENT AND FUTURE END USER ANALYSIS, 2025–2034, (USD MILLION)
FIGURE 19 MARKET SHARE BY COUNTRY
FIGURE 20 LATIN AMERICA VIRTUAL REALITY IN SOCIAL NETWORKING CURRENT AND FUTURE TYPE ANALYSIS, 2025–2034, (USD MILLION)
FIGURE 21 LATIN AMERICA VIRTUAL REALITY IN SOCIAL NETWORKING CURRENT AND FUTURE END USER ANALYSIS, 2025–2034, (USD MILLION)
FIGURE 22 MARKET SHARE BY COUNTRY
FIGURE 23 EASTERN EUROPE VIRTUAL REALITY IN SOCIAL NETWORKING CURRENT AND FUTURE TYPE ANALYSIS, 2025–2034, (USD MILLION)
FIGURE 24 EASTERN EUROPE VIRTUAL REALITY IN SOCIAL NETWORKING CURRENT AND FUTURE END USER ANALYSIS, 2025–2034, (USD MILLION)
FIGURE 25 MARKET SHARE BY COUNTRY
FIGURE 26 WESTERN EUROPE VIRTUAL REALITY IN SOCIAL NETWORKING CURRENT AND FUTURE TYPE ANALYSIS, 2025–2034, (USD MILLION)
FIGURE 27 WESTERN EUROPE VIRTUAL REALITY IN SOCIAL NETWORKING CURRENT AND FUTURE END USER ANALYSIS, 2025–2034, (USD MILLION)
FIGURE 28 MARKET SHARE BY COUNTRY
FIGURE 29 EAST ASIA AND PACIFIC VIRTUAL REALITY IN SOCIAL NETWORKING CURRENT AND FUTURE TYPE ANALYSIS, 2025–2034, (USD MILLION)
FIGURE 30 EAST ASIA AND PACIFIC VIRTUAL REALITY IN SOCIAL NETWORKING CURRENT AND FUTURE END USER ANALYSIS, 2025–2034, (USD MILLION)
FIGURE 31 MARKET SHARE BY COUNTRY
FIGURE 32 SEA AND SOUTH ASIA VIRTUAL REALITY IN SOCIAL NETWORKING CURRENT AND FUTURE TYPE ANALYSIS, 2025–2034, (USD MILLION)
FIGURE 33 SEA AND SOUTH ASIA VIRTUAL REALITY IN SOCIAL NETWORKING CURRENT AND FUTURE END USER ANALYSIS, 2025–2034, (USD MILLION)
FIGURE 34 MARKET SHARE BY COUNTRY
FIGURE 35 MIDDLE EAST AND AFRICA VIRTUAL REALITY IN SOCIAL NETWORKING CURRENT AND FUTURE TYPE ANALYSIS, 2025–2034, (USD MILLION)
FIGURE 36 MIDDLE EAST AND AFRICA VIRTUAL REALITY IN SOCIAL NETWORKING CURRENT AND FUTURE END USER ANALYSIS, 2025–2034, (USD MILLION)
FIGURE 37 NORTH AMERICA VIRTUAL REALITY IN SOCIAL NETWORKING CURRENT AND FUTURE MARKET VOLUME SHARE REGIONAL ANALYSIS, 2025–2034, (USD MILLION)
FIGURE 38 U.S. VIRTUAL REALITY IN SOCIAL NETWORKING CURRENT AND FUTURE TYPE ANALYSIS, 2025–2034, (USD MILLION)
FIGURE 39 U.S. VIRTUAL REALITY IN SOCIAL NETWORKING CURRENT AND FUTURE END USER ANALYSIS, 2025–2034, (USD MILLION)
FIGURE 40 CANADA VIRTUAL REALITY IN SOCIAL NETWORKING CURRENT AND FUTURE TYPE ANALYSIS, 2025–2034, (USD MILLION)
FIGURE 41 CANADA VIRTUAL REALITY IN SOCIAL NETWORKING CURRENT AND FUTURE END USER ANALYSIS, 2025–2034, (USD MILLION)
FIGURE 42 LATIN AMERICA VIRTUAL REALITY IN SOCIAL NETWORKING CURRENT AND FUTURE MARKET VOLUME SHARE REGIONAL ANALYSIS, 2025–2034, (USD MILLION)
FIGURE 43 MEXICO VIRTUAL REALITY IN SOCIAL NETWORKING CURRENT AND FUTURE TYPE ANALYSIS, 2025–2034, (USD MILLION)
FIGURE 44 MEXICO VIRTUAL REALITY IN SOCIAL NETWORKING CURRENT AND FUTURE END USER ANALYSIS, 2025–2034, (USD MILLION)
FIGURE 45 BRAZIL VIRTUAL REALITY IN SOCIAL NETWORKING CURRENT AND FUTURE TYPE ANALYSIS, 2025–2034, (USD MILLION)
FIGURE 46 BRAZIL VIRTUAL REALITY IN SOCIAL NETWORKING CURRENT AND FUTURE END USER ANALYSIS, 2025–2034, (USD MILLION)
FIGURE 47 ARGENTINA VIRTUAL REALITY IN SOCIAL NETWORKING CURRENT AND FUTURE TYPE ANALYSIS, 2025–2034, (USD MILLION)
FIGURE 48 ARGENTINA VIRTUAL REALITY IN SOCIAL NETWORKING CURRENT AND FUTURE END USER ANALYSIS, 2025–2034, (USD MILLION)
FIGURE 49 COLUMBIA VIRTUAL REALITY IN SOCIAL NETWORKING CURRENT AND FUTURE TYPE ANALYSIS, 2025–2034, (USD MILLION)
FIGURE 50 COLUMBIA VIRTUAL REALITY IN SOCIAL NETWORKING CURRENT AND FUTURE END USER ANALYSIS, 2025–2034, (USD MILLION)
FIGURE 51 REST OF LATIN AMERICA VIRTUAL REALITY IN SOCIAL NETWORKING CURRENT AND FUTURE TYPE ANALYSIS, 2025–2034, (USD MILLION)
FIGURE 52 REST OF LATIN AMERICA VIRTUAL REALITY IN SOCIAL NETWORKING CURRENT AND FUTURE END USER ANALYSIS, 2025–2034, (USD MILLION)
FIGURE 53 EASTERN EUROPE VIRTUAL REALITY IN SOCIAL NETWORKING CURRENT AND FUTURE MARKET VOLUME SHARE REGIONAL ANALYSIS, 2025–2034, (USD MILLION)
FIGURE 54 POLAND VIRTUAL REALITY IN SOCIAL NETWORKING CURRENT AND FUTURE TYPE ANALYSIS, 2025–2034, (USD MILLION)
FIGURE 55 POLAND VIRTUAL REALITY IN SOCIAL NETWORKING CURRENT AND FUTURE END USER ANALYSIS, 2025–2034, (USD MILLION)
FIGURE 56 RUSSIA VIRTUAL REALITY IN SOCIAL NETWORKING CURRENT AND FUTURE TYPE ANALYSIS, 2025–2034, (USD MILLION)
FIGURE 57 RUSSIA VIRTUAL REALITY IN SOCIAL NETWORKING CURRENT AND FUTURE END USER ANALYSIS, 2025–2034, (USD MILLION)
FIGURE 58 CZECH REPUBLIC VIRTUAL REALITY IN SOCIAL NETWORKING CURRENT AND FUTURE TYPE ANALYSIS, 2025–2034, (USD MILLION)
FIGURE 59 CZECH REPUBLIC VIRTUAL REALITY IN SOCIAL NETWORKING CURRENT AND FUTURE END USER ANALYSIS, 2025–2034, (USD MILLION)
FIGURE 60 ROMANIA VIRTUAL REALITY IN SOCIAL NETWORKING CURRENT AND FUTURE TYPE ANALYSIS, 2025–2034, (USD MILLION)
FIGURE 61 ROMANIA VIRTUAL REALITY IN SOCIAL NETWORKING CURRENT AND FUTURE END USER ANALYSIS, 2025–2034, (USD MILLION)
FIGURE 62 REST OF EASTERN EUROPE VIRTUAL REALITY IN SOCIAL NETWORKING CURRENT AND FUTURE TYPE ANALYSIS, 2025–2034, (USD MILLION)
FIGURE 63 REST OF EASTERN EUROPE VIRTUAL REALITY IN SOCIAL NETWORKING CURRENT AND FUTURE END USER ANALYSIS, 2025–2034, (USD MILLION)
FIGURE 64 WESTERN EUROPE VIRTUAL REALITY IN SOCIAL NETWORKING CURRENT AND FUTURE MARKET VOLUME SHARE REGIONAL ANALYSIS, 2025–2034, (USD MILLION)
FIGURE 65 GERMANY VIRTUAL REALITY IN SOCIAL NETWORKING CURRENT AND FUTURE TYPE ANALYSIS, 2025–2034, (USD MILLION)
FIGURE 66 GERMANY VIRTUAL REALITY IN SOCIAL NETWORKING CURRENT AND FUTURE END USER ANALYSIS, 2025–2034, (USD MILLION)
FIGURE 67 FRANCE VIRTUAL REALITY IN SOCIAL NETWORKING CURRENT AND FUTURE TYPE ANALYSIS, 2025–2034, (USD MILLION)
FIGURE 68 FRANCE VIRTUAL REALITY IN SOCIAL NETWORKING CURRENT AND FUTURE END USER ANALYSIS, 2025–2034, (USD MILLION)
FIGURE 69 UK VIRTUAL REALITY IN SOCIAL NETWORKING CURRENT AND FUTURE TYPE ANALYSIS, 2025–2034, (USD MILLION)
FIGURE 70 UK VIRTUAL REALITY IN SOCIAL NETWORKING CURRENT AND FUTURE END USER ANALYSIS, 2025–2034, (USD MILLION)
FIGURE 71 SPAIN VIRTUAL REALITY IN SOCIAL NETWORKING CURRENT AND FUTURE TYPE ANALYSIS, 2025–2034, (USD MILLION)
FIGURE 72 SPAIN VIRTUAL REALITY IN SOCIAL NETWORKING CURRENT AND FUTURE END USER ANALYSIS, 2025–2034, (USD MILLION)
FIGURE 73 ITALY VIRTUAL REALITY IN SOCIAL NETWORKING CURRENT AND FUTURE TYPE ANALYSIS, 2025–2034, (USD MILLION)
FIGURE 74 ITALY VIRTUAL REALITY IN SOCIAL NETWORKING CURRENT AND FUTURE END USER ANALYSIS, 2025–2034, (USD MILLION)
FIGURE 75 REST OF WESTERN EUROPE VIRTUAL REALITY IN SOCIAL NETWORKING CURRENT AND FUTURE TYPE ANALYSIS, 2025–2034, (USD MILLION)
FIGURE 76 REST OF WESTERN EUROPE VIRTUAL REALITY IN SOCIAL NETWORKING CURRENT AND FUTURE END USER ANALYSIS, 2025–2034, (USD MILLION)
FIGURE 77 EAST ASIA AND PACIFIC VIRTUAL REALITY IN SOCIAL NETWORKING CURRENT AND FUTURE MARKET VOLUME SHARE REGIONAL ANALYSIS, 2025–2034, (USD MILLION)
FIGURE 78 CHINA VIRTUAL REALITY IN SOCIAL NETWORKING CURRENT AND FUTURE TYPE ANALYSIS, 2025–2034, (USD MILLION)
FIGURE 79 CHINA VIRTUAL REALITY IN SOCIAL NETWORKING CURRENT AND FUTURE END USER ANALYSIS, 2025–2034, (USD MILLION)
FIGURE 80 JAPAN VIRTUAL REALITY IN SOCIAL NETWORKING CURRENT AND FUTURE TYPE ANALYSIS, 2025–2034, (USD MILLION)
FIGURE 81 JAPAN VIRTUAL REALITY IN SOCIAL NETWORKING CURRENT AND FUTURE END USER ANALYSIS, 2025–2034, (USD MILLION)
FIGURE 82 AUSTRALIA VIRTUAL REALITY IN SOCIAL NETWORKING CURRENT AND FUTURE TYPE ANALYSIS, 2025–2034, (USD MILLION)
FIGURE 83 AUSTRALIA VIRTUAL REALITY IN SOCIAL NETWORKING CURRENT AND FUTURE END USER ANALYSIS, 2025–2034, (USD MILLION)
FIGURE 84 CAMBODIA VIRTUAL REALITY IN SOCIAL NETWORKING CURRENT AND FUTURE TYPE ANALYSIS, 2025–2034, (USD MILLION)
FIGURE 85 CAMBODIA VIRTUAL REALITY IN SOCIAL NETWORKING CURRENT AND FUTURE END USER ANALYSIS, 2025–2034, (USD MILLION)
FIGURE 86 FIJI VIRTUAL REALITY IN SOCIAL NETWORKING CURRENT AND FUTURE TYPE ANALYSIS, 2025–2034, (USD MILLION)
FIGURE 87 FIJI VIRTUAL REALITY IN SOCIAL NETWORKING CURRENT AND FUTURE END USER ANALYSIS, 2025–2034, (USD MILLION)
FIGURE 88 INDONESIA VIRTUAL REALITY IN SOCIAL NETWORKING CURRENT AND FUTURE TYPE ANALYSIS, 2025–2034, (USD MILLION)
FIGURE 89 INDONESIA VIRTUAL REALITY IN SOCIAL NETWORKING CURRENT AND FUTURE END USER ANALYSIS, 2025–2034, (USD MILLION)
FIGURE 90 SOUTH KOREA VIRTUAL REALITY IN SOCIAL NETWORKING CURRENT AND FUTURE TYPE ANALYSIS, 2025–2034, (USD MILLION)
FIGURE 91 SOUTH KOREA VIRTUAL REALITY IN SOCIAL NETWORKING CURRENT AND FUTURE END USER ANALYSIS, 2025–2034, (USD MILLION)
FIGURE 92 REST OF EAST ASIA AND PACIFIC VIRTUAL REALITY IN SOCIAL NETWORKING CURRENT AND FUTURE TYPE ANALYSIS, 2025–2034, (USD MILLION)
FIGURE 93 REST OF EAST ASIA AND PACIFIC VIRTUAL REALITY IN SOCIAL NETWORKING CURRENT AND FUTURE END USER ANALYSIS, 2025–2034, (USD MILLION)
FIGURE 94 SEA AND SOUTH ASIA VIRTUAL REALITY IN SOCIAL NETWORKING CURRENT AND FUTURE MARKET VOLUME SHARE REGIONAL ANALYSIS, 2025–2034, (USD MILLION)
FIGURE 95 BANGLADESH VIRTUAL REALITY IN SOCIAL NETWORKING CURRENT AND FUTURE TYPE ANALYSIS, 2025–2034, (USD MILLION)
FIGURE 96 BANGLADESH VIRTUAL REALITY IN SOCIAL NETWORKING CURRENT AND FUTURE END USER ANALYSIS, 2025–2034, (USD MILLION)
FIGURE 97 NEW ZEALAND VIRTUAL REALITY IN SOCIAL NETWORKING CURRENT AND FUTURE TYPE ANALYSIS, 2025–2034, (USD MILLION)
FIGURE 98 NEW ZEALAND VIRTUAL REALITY IN SOCIAL NETWORKING CURRENT AND FUTURE END USER ANALYSIS, 2025–2034, (USD MILLION)
FIGURE 99 INDIA VIRTUAL REALITY IN SOCIAL NETWORKING CURRENT AND FUTURE TYPE ANALYSIS, 2025–2034, (USD MILLION)
FIGURE 100 INDIA VIRTUAL REALITY IN SOCIAL NETWORKING CURRENT AND FUTURE END USER ANALYSIS, 2025–2034, (USD MILLION)
FIGURE 101 SINGAPORE VIRTUAL REALITY IN SOCIAL NETWORKING CURRENT AND FUTURE TYPE ANALYSIS, 2025–2034, (USD MILLION)
FIGURE 102 SINGAPORE VIRTUAL REALITY IN SOCIAL NETWORKING CURRENT AND FUTURE END USER ANALYSIS, 2025–2034, (USD MILLION)
FIGURE 103 THAILAND VIRTUAL REALITY IN SOCIAL NETWORKING CURRENT AND FUTURE TYPE ANALYSIS, 2025–2034, (USD MILLION)
FIGURE 104 THAILAND VIRTUAL REALITY IN SOCIAL NETWORKING CURRENT AND FUTURE END USER ANALYSIS, 2025–2034, (USD MILLION)
FIGURE 105 TAIWAN VIRTUAL REALITY IN SOCIAL NETWORKING CURRENT AND FUTURE TYPE ANALYSIS, 2025–2034, (USD MILLION)
FIGURE 106 TAIWAN VIRTUAL REALITY IN SOCIAL NETWORKING CURRENT AND FUTURE END USER ANALYSIS, 2025–2034, (USD MILLION)
FIGURE 107 MALAYSIA VIRTUAL REALITY IN SOCIAL NETWORKING CURRENT AND FUTURE TYPE ANALYSIS, 2025–2034, (USD MILLION)
FIGURE 108 MALAYSIA VIRTUAL REALITY IN SOCIAL NETWORKING CURRENT AND FUTURE END USER ANALYSIS, 2025–2034, (USD MILLION)
FIGURE 109 REST OF SEA AND SOUTH ASIA VIRTUAL REALITY IN SOCIAL NETWORKING CURRENT AND FUTURE TYPE ANALYSIS, 2025–2034, (USD MILLION)
FIGURE 110 REST OF SEA AND SOUTH ASIA VIRTUAL REALITY IN SOCIAL NETWORKING CURRENT AND FUTURE END USER ANALYSIS, 2025–2034, (USD MILLION)
FIGURE 111 MIDDLE EAST AND AFRICA VIRTUAL REALITY IN SOCIAL NETWORKING CURRENT AND FUTURE MARKET VOLUME SHARE REGIONAL ANALYSIS, 2025–2034, (USD MILLION)
FIGURE 112 GCC COUNTRIES VIRTUAL REALITY IN SOCIAL NETWORKING CURRENT AND FUTURE TYPE ANALYSIS, 2025–2034, (USD MILLION)
FIGURE 113 GCC COUNTRIES VIRTUAL REALITY IN SOCIAL NETWORKING CURRENT AND FUTURE END USER ANALYSIS, 2025–2034, (USD MILLION)
FIGURE 114 SAUDI ARABIA VIRTUAL REALITY IN SOCIAL NETWORKING CURRENT AND FUTURE TYPE ANALYSIS, 2025–2034, (USD MILLION)
FIGURE 115 SAUDI ARABIA VIRTUAL REALITY IN SOCIAL NETWORKING CURRENT AND FUTURE END USER ANALYSIS, 2025–2034, (USD MILLION)
FIGURE 116 UAE VIRTUAL REALITY IN SOCIAL NETWORKING CURRENT AND FUTURE TYPE ANALYSIS, 2025–2034, (USD MILLION)
FIGURE 117 UAE VIRTUAL REALITY IN SOCIAL NETWORKING CURRENT AND FUTURE END USER ANALYSIS, 2025–2034, (USD MILLION)
FIGURE 118 BAHRAIN VIRTUAL REALITY IN SOCIAL NETWORKING CURRENT AND FUTURE TYPE ANALYSIS, 2025–2034, (USD MILLION)
FIGURE 119 BAHRAIN VIRTUAL REALITY IN SOCIAL NETWORKING CURRENT AND FUTURE END USER ANALYSIS, 2025–2034, (USD MILLION)
FIGURE 120 KUWAIT VIRTUAL REALITY IN SOCIAL NETWORKING CURRENT AND FUTURE TYPE ANALYSIS, 2025–2034, (USD MILLION)
FIGURE 121 KUWAIT VIRTUAL REALITY IN SOCIAL NETWORKING CURRENT AND FUTURE END USER ANALYSIS, 2025–2034, (USD MILLION)
FIGURE 122 OMAN VIRTUAL REALITY IN SOCIAL NETWORKING CURRENT AND FUTURE TYPE ANALYSIS, 2025–2034, (USD MILLION)
FIGURE 123 OMAN VIRTUAL REALITY IN SOCIAL NETWORKING CURRENT AND FUTURE END USER ANALYSIS, 2025–2034, (USD MILLION)
FIGURE 124 QATAR VIRTUAL REALITY IN SOCIAL NETWORKING CURRENT AND FUTURE TYPE ANALYSIS, 2025–2034, (USD MILLION)
FIGURE 125 QATAR VIRTUAL REALITY IN SOCIAL NETWORKING CURRENT AND FUTURE END USER ANALYSIS, 2025–2034, (USD MILLION)
FIGURE 126 EGYPT VIRTUAL REALITY IN SOCIAL NETWORKING CURRENT AND FUTURE TYPE ANALYSIS, 2025–2034, (USD MILLION)
FIGURE 127 EGYPT VIRTUAL REALITY IN SOCIAL NETWORKING CURRENT AND FUTURE END USER ANALYSIS, 2025–2034, (USD MILLION)
FIGURE 128 NIGERIA VIRTUAL REALITY IN SOCIAL NETWORKING CURRENT AND FUTURE TYPE ANALYSIS, 2025–2034, (USD MILLION)
FIGURE 129 NIGERIA VIRTUAL REALITY IN SOCIAL NETWORKING CURRENT AND FUTURE END USER ANALYSIS, 2025–2034, (USD MILLION)
FIGURE 130 SOUTH AFRICA VIRTUAL REALITY IN SOCIAL NETWORKING CURRENT AND FUTURE TYPE ANALYSIS, 2025–2034, (USD MILLION)
FIGURE 131 SOUTH AFRICA VIRTUAL REALITY IN SOCIAL NETWORKING CURRENT AND FUTURE END USER ANALYSIS, 2025–2034, (USD MILLION)
FIGURE 132 ISRAEL VIRTUAL REALITY IN SOCIAL NETWORKING CURRENT AND FUTURE TYPE ANALYSIS, 2025–2034, (USD MILLION)
FIGURE 133 ISRAEL VIRTUAL REALITY IN SOCIAL NETWORKING CURRENT AND FUTURE END USER ANALYSIS, 2025–2034, (USD MILLION)
FIGURE 134 REST OF MEA VIRTUAL REALITY IN SOCIAL NETWORKING CURRENT AND FUTURE TYPE ANALYSIS, 2025–2034, (USD MILLION)
FIGURE 135 REST OF MEA VIRTUAL REALITY IN SOCIAL NETWORKING CURRENT AND FUTURE END USER ANALYSIS, 2025–2034, (USD MILLION)
FIGURE 136 U. S. MARKET SHARE ANALYSIS BY TYPE (2024)
FIGURE 137 U. S. MARKET SHARE ANALYSIS BY END USER (2024)
FIGURE 138 CANADA MARKET SHARE ANALYSIS BY TYPE (2024)
FIGURE 139 CANADA MARKET SHARE ANALYSIS BY END USER (2024)
FIGURE 140 MEXICO MARKET SHARE ANALYSIS BY TYPE (2024)
FIGURE 141 MEXICO MARKET SHARE ANALYSIS BY END USER (2024)
FIGURE 142 CHINA MARKET SHARE ANALYSIS BY TYPE (2024)
FIGURE 143 CHINA MARKET SHARE ANALYSIS BY END USER (2024)
FIGURE 144 JAPAN MARKET SHARE ANALYSIS BY TYPE (2024)
FIGURE 145 JAPAN MARKET SHARE ANALYSIS BY END USER (2024)
FIGURE 146 INDIA MARKET SHARE ANALYSIS BY TYPE (2024)
FIGURE 147 INDIA MARKET SHARE ANALYSIS BY END USER (2024)
FIGURE 148 SOUTH KOREA MARKET SHARE ANALYSIS BY TYPE (2024)
FIGURE 149 SOUTH KOREA MARKET SHARE ANALYSIS BY END USER (2024)
FIGURE 150 SAUDI ARABIA MARKET SHARE ANALYSIS BY TYPE (2024)
FIGURE 151 SAUDI ARABIA MARKET SHARE ANALYSIS BY END USER (2024)
FIGURE 152 UAE MARKET SHARE ANALYSIS BY TYPE (2024)
FIGURE 153 UAE MARKET SHARE ANALYSIS BY END USER (2024)
FIGURE 154 EGYPT MARKET SHARE ANALYSIS BY TYPE (2024)
FIGURE 155 EGYPT MARKET SHARE ANALYSIS BY END USER (2024)
FIGURE 156 NIGERIA MARKET SHARE ANALYSIS BY TYPE (2024)
FIGURE 157 NIGERIA MARKET SHARE ANALYSIS BY END USER (2024)
FIGURE 158 SOUTH AFRICA MARKET SHARE ANALYSIS BY TYPE (2024)
FIGURE 159 SOUTH AFRICA MARKET SHARE ANALYSIS BY END USER (2024)
FIGURE 160 GERMANY MARKET SHARE ANALYSIS BY TYPE (2024)
FIGURE 161 GERMANY MARKET SHARE ANALYSIS BY END USER (2024)
FIGURE 162 FRANCE MARKET SHARE ANALYSIS BY TYPE (2024)
FIGURE 163 FRANCE MARKET SHARE ANALYSIS BY END USER (2024)
FIGURE 164 UK MARKET SHARE ANALYSIS BY TYPE (2024)
FIGURE 165 UK MARKET SHARE ANALYSIS BY END USER (2024)
FIGURE 166 SPAIN MARKET SHARE ANALYSIS BY TYPE (2024)
FIGURE 167 SPAIN MARKET SHARE ANALYSIS BY END USER (2024)
FIGURE 168 ITALY MARKET SHARE ANALYSIS BY TYPE (2024)
FIGURE 169 ITALY MARKET SHARE ANALYSIS BY END USER (2024)
FIGURE 170 BRAZIL MARKET SHARE ANALYSIS BY TYPE (2024)
FIGURE 171 BRAZIL MARKET SHARE ANALYSIS BY END USER (2024)
FIGURE 172 ARGENTINA MARKET SHARE ANALYSIS BY TYPE (2024)
FIGURE 173 ARGENTINA MARKET SHARE ANALYSIS BY END USER (2024)
FIGURE 174 COLUMBIA MARKET SHARE ANALYSIS BY TYPE (2024)
FIGURE 175 COLUMBIA MARKET SHARE ANALYSIS BY END USER (2024)
FIGURE 176 GLOBAL VIRTUAL REALITY IN SOCIAL NETWORKING CURRENT AND FUTURE MARKET KEY COUNTRY LEVEL ANALYSIS, 2024–2034, (USD MILLION)
FIGURE 177 FINANCIAL OVERVIEW:
Key Players Analysis:
Meta Platforms, Inc.: Meta, headquartered in Menlo Park, California, is a leader in the VR space with its Oculus VR headset line. The company focuses on building the Metaverse, promoting social interaction through virtual environments. Their strategy involves heavy investment in immersive technology and developing platforms that facilitate community engagement, such as Horizon Worlds.
HTC Corporation: Based in Taoyuan, Taiwan, HTC produces the Vive VR headset series, which is widely used in both gaming and social applications. Their business strategy emphasizes partnerships with developers to create compelling content for VR, focusing on enhancing user experience and expanding into enterprise solutions for virtual meetings and collaboration.
Sony Interactive Entertainment: Located in San Mateo, California, Sony is renowned for its PlayStation VR system, which provides immersive gaming experiences. Their strategy includes leveraging existing gaming franchises to attract users to VR, expanding social features within the gaming ecosystem, and developing exclusive content that encourages social interaction among players.
Valve Corporation: Valve, based in Bellevue, Washington, is known for the SteamVR platform and the Valve Index headset. The company focuses on offering a comprehensive VR ecosystem that includes a wide range of games and social experiences. Their strategy revolves around fostering a community-driven marketplace and enabling user-generated content, enhancing social connectivity.
Microsoft Corporation: Headquartered in Redmond, Washington, Microsoft has made significant strides in VR with its HoloLens, which emphasizes mixed reality applications. Their strategy targets enterprise solutions, facilitating remote collaboration and training, while also exploring social networking opportunities in professional environments to enhance team interactions and communication.
NVIDIA Corporation: Based in Santa Clara, California, NVIDIA is a key player in the VR space, providing powerful graphics processing units (GPUs) that enhance VR experiences. Their strategy involves integrating AI with VR, offering developers tools and technologies that enable the creation of immersive social environments, and supporting various VR applications across industries.
Unity Technologies: Unity, located in San Francisco, California, provides a leading real-time development platform for creating VR content. Their business strategy focuses on empowering developers to build interactive and engaging social experiences within VR, offering tools that streamline content creation and foster community-driven platforms for sharing and collaboration.
Snap Inc.: Headquartered in Santa Monica, California, Snap is known for its innovative use of augmented reality in social networking through Snapchat. Their strategy includes expanding AR features that encourage user interaction and social engagement, creating immersive experiences that blend digital content with real-world environments, appealing to younger audiences.
Google LLC: Based in Mountain View, California, Google offers various VR solutions through its Google Cardboard and Daydream platforms. Their business strategy emphasizes making VR accessible to a broader audience by integrating it with existing services like YouTube. They aim to enhance user experience through innovative content and technology partnerships.
Magic Leap, Inc.: Located in Plantation, Florida, Magic Leap specializes in augmented reality but has ventured into social VR applications. Their strategy involves creating immersive experiences that blend real and virtual worlds, focusing on partnerships with enterprises to develop applications that facilitate social interaction and collaborative work environments.
Market Key Players
Meta Platforms, Inc.
HTC Corporation
Sony Interactive Entertainment
Valve Corporation
Microsoft Corporation
NVIDIA Corporation
Unity Technologies
Snap Inc.
Google LLC
Magic Leap, Inc.
Samsung Electronics Co., Ltd.
Apple Inc.
Alibaba Group
Pico Interactive
Roblox Corporation
Immersive Tech Ltd.
Zspace, Inc.
VIVEPORT
Virtuix, Inc.
Dreamscape Immersive
Driver:
Growing Popularity of the Metaverse
The increasing interest in the Metaverse—a collective virtual shared space that merges physical and virtual reality—serves as a significant driver for the Virtual Reality in Social Networking market. The concept encourages immersive social interaction, enabling users to create avatars, interact with others, and even conduct business in virtual spaces. Major tech companies like Meta, Google, and Microsoft are investing heavily in Metaverse technologies, further driving the demand for VR platforms in social networking. The fusion of gaming, social media, and virtual environments offers unprecedented opportunities for people to connect, socialize, and share experiences, which continues to expand the market’s potential.
Advancements in VR Hardware and Software
Continuous innovation in VR hardware, such as VR headsets, gloves, and motion sensors, enhances user experience, making virtual environments more immersive and interactive. Companies are improving device comfort, resolution, and performance, helping reduce issues like motion sickness and lag, which previously hindered adoption. Coupled with advancements in VR software, which are creating more intuitive and engaging social platforms, these developments are key growth drivers. The combination of hardware improvements and sophisticated software enables users to engage with others in more meaningful and immersive virtual settings, driving demand for VR in social networking.
Rising Adoption of 5G Technology
The rollout of 5G networks globally is a crucial driver for the Virtual Reality in Social Networking market. 5G's low latency, faster download speeds, and enhanced bandwidth capabilities enable smoother and more responsive VR experiences, which are essential for real-time social interactions in virtual environments. This technology reduces lag, one of the major limitations of previous VR experiences, and allows more users to participate simultaneously without compromising the quality of the interaction. As 5G continues to expand, it will further enhance VR applications, making them more accessible and attractive to a broader audience.
Restraints:
High Cost of VR Hardware
One of the major challenges facing the Virtual Reality in Social Networking market is the high cost associated with VR hardware. Devices such as headsets, sensors, and accessories are often expensive, limiting accessibility to a broader consumer base. Even with advancements in affordability, high-quality VR equipment remains costly for many potential users, especially in developing regions. This price barrier slows down mass adoption, as not all users are willing or able to invest in the necessary hardware. Moreover, frequent technological updates can make older hardware obsolete, further increasing the financial burden for users looking to keep up with advancements.
Limited Content Availability
Another significant restraint in the market is the lack of diverse and high-quality content. While VR has made strides in gaming and social interactions, content specifically designed for social networking remains limited. The development of interactive virtual environments and social experiences requires substantial investment, and many platforms still rely on a small range of applications. This shortage of engaging content hinders the user experience, as consumers often seek more variety and compelling reasons to engage with VR platforms. If content creation does not accelerate, the appeal of VR for social networking may stagnate, limiting market growth.
Opportunities:
Expansion of Virtual Events and Social Gatherings
The increasing popularity of virtual events, conferences, and social gatherings presents a lucrative opportunity for the Virtual Reality in Social Networking market. As people become more comfortable with virtual interactions due to remote work and global lockdowns, VR platforms offer an enhanced way to participate in large-scale virtual gatherings. VR allows users to attend events from anywhere in the world while maintaining a level of immersion and interaction not possible through traditional online platforms. Businesses, educators, and entertainment sectors are leveraging these opportunities to expand their offerings, creating a new market for virtual event hosting and participation.
Growing Adoption of VR in Professional Networking
Professional networking and collaboration are areas where VR can play a transformative role, presenting significant opportunities. Virtual Reality can enable remote workspaces, virtual meetings, and immersive collaboration environments, replicating physical office settings. Companies are increasingly exploring VR to improve productivity and team interaction in remote work environments. Additionally, VR-based job fairs, training, and onboarding processes allow businesses to engage employees and candidates in new and interactive ways. As more organizations embrace virtual collaboration tools, VR's role in professional networking is expected to grow, opening up a new avenue for market expansion.
Trend:
Wireless VR Headsets on the Rise
One of the prominent trends in the market is the growing shift toward wireless VR headsets. Devices such as the Meta Quest series are becoming increasingly popular due to their portability and convenience, eliminating the need for cumbersome wires. This trend enhances the overall user experience, offering more mobility and flexibility, which is crucial for social interactions in VR spaces. As wireless technology continues to improve, this shift is expected to further drive VR adoption across various applications, including social networking and entertainment.
Recent Development:
In October 2024: DPVR has launched the P1 Pro Cam, a new standalone VR headset designed specifically for educational purposes. This device aims to enhance learning experiences by integrating advanced VR technology into educational settings.
In September 2024: Sun Country Airlines has selected VRpilot as its training solution provider. This partnership will leverage VR technology to improve pilot training efficiency and effectiveness, indicating a growing trend of using immersive technologies in the aviation sector.