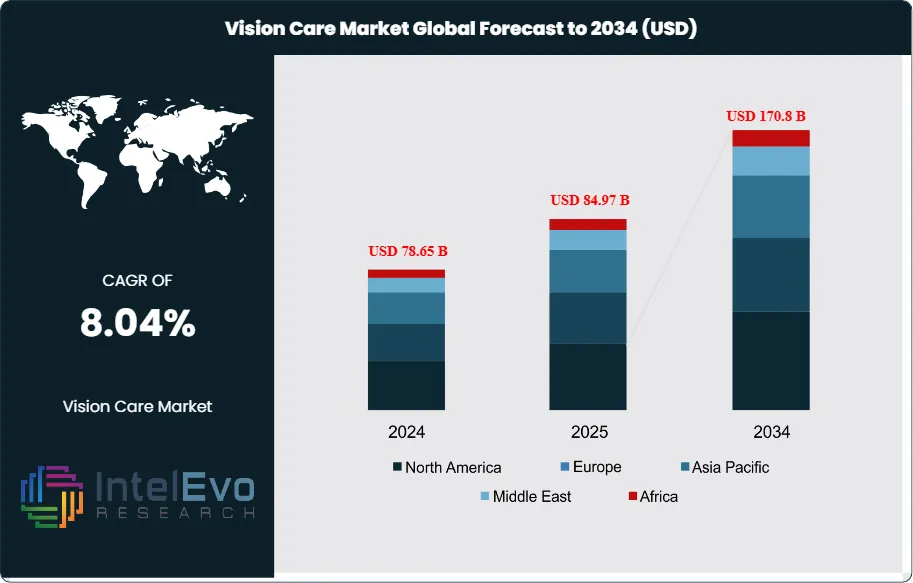
The Vision Care Market size is experiencing robust expansion. It was estimated at USD 78.65 Billion in 2024 and is forecasted to reach approximately USD 170.8 Billion by 2034. This impressive growth trajectory is underpinned by a Compound Annual Growth Rate (CAGR) of 8.04% during the forecast period from 2025 to 2034. This consistent growth rate reflects the sustained demand driven by an aging global population, increasing awareness of eye health, and continuous innovation in vision correction and treatment technologies.
The global vision care industry plays a critical role in public health by addressing the essential need for sight. This market research report offers a detailed overview of the sector, covering current valuation, growth projections, key drivers, challenges, trends, and competitive dynamics. Vision care spans a wide array of products and services, from corrective eyewear and pharmaceuticals to surgical procedures and preventive care, all designed to maintain and enhance visual health.
A defining feature of the market is its fragmentation, with multinational corporations and regional players competing to serve varied consumer needs. This diversity fuels innovation and provides consumers with a broad range of options at different price points and technological levels. Spectacles have evolved beyond corrective use to become popular fashion items, significantly boosting market growth. Simultaneously, the rising global incidence of eye diseases, such as myopia, signals growing demand for vision solutions. Increased awareness about the harmful effects of UVA and UVB rays has also driven the adoption of sunglasses as essential protective gear. These factors combine to shape a dynamic, fast-evolving vision care landscape.
Key Takeaways
Market Growth: The Vision Care Market is projected to reach USD 170.8 Billion by 2034 from USD 78.65 Billion in 2024, expanding at a CAGR of 8.04% during 2025–2034, driven by aging demographics and rising awareness of ocular health.
Product Dominance: Eyewear leads the market with a 72% revenue share, supported by high prevalence of refractive errors, fashion-driven demand, and growing adoption of UV-protective and blue-light filtering lenses.
Treatment Dominance: Laser therapy accounts for 49% of the treatment segment, owing to its precision, minimally invasive nature, faster recovery time, and high clinical success rates.
Indication Dominance: Glaucoma represents the leading indication segment, fueled by increasing prevalence among the elderly population and the need for long-term disease management.
Distribution Channel Dominance: Retail stores dominate the distribution landscape, offering in-person eye examinations, personalized consultations, and immediate access to eyewear products.
Driver: Rising screen exposure, increasing myopia prevalence among children, and growing awareness of UV-related eye damage are accelerating demand for advanced corrective and protective vision solutions.
Restraint: High cost of advanced surgical procedures and premium vision care products, along with limited accessibility in low-income regions, restrict broader market penetration.
Opportunity: Expansion in emerging markets, increasing cataract surgical volumes, and innovation in intraocular lenses (multifocal, toric) create significant growth avenues.
Trend: Technological advancements such as silicone hydrogel contact lenses, smart eyewear, AI-assisted diagnostics, and advanced laser platforms are reshaping the competitive landscape.
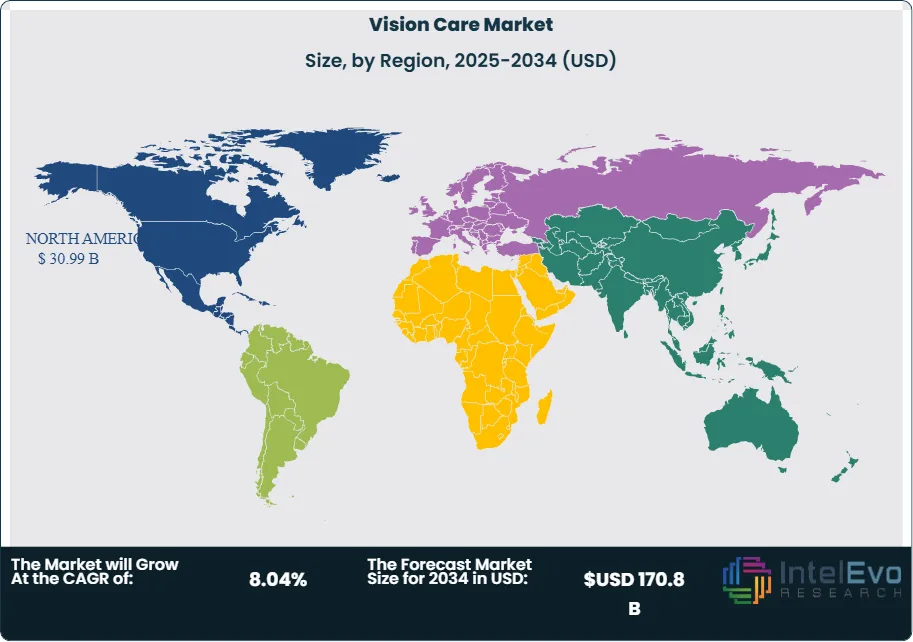
Regional Analysis: North America leads the market with a 39.4% revenue share due to advanced healthcare infrastructure and favorable reimbursement policies, while Asia-Pacific is expected to register the fastest CAGR supported by large patient pools and rising healthcare investments.
Product Analysis
The global vision care market is meticulously segmented into three primary product categories: Eyewear, Intraocular Lenses, and Ocular Health products.
Eyewear: This segment, encompassing spectacles, contact lenses, and sunglasses, is the largest and most dynamic. It is estimated to retain its leading position throughout the forecast period, holding a substantial 72% of the total market share.
Spectacles: Spectacles, once primarily used for correcting refractive errors, have evolved into popular fashion accessories. Manufacturers worldwide innovate with new designs, lightweight and sustainable materials, and advanced lens technologies like progressive and anti-glare coatings. This combination of style, functionality, and affordability maintains their widespread appeal. Additionally, the growing global prevalence of presbyopia and myopia continues to drive strong demand for spectacles, reinforcing their important role in vision care.
Contact Lenses: Contact lenses offer an alternative to spectacles, providing a wider field of vision and aesthetic benefits. The market is segmented by wear schedule (daily, bi-weekly, monthly, extended) and type (soft, rigid gas permeable, specialty lenses). Growing demand for convenience, comfort, and cosmetic appeal—especially among younger and active users—drives growth. Advances like silicone hydrogel lenses improve oxygen flow and comfort, boosting adoption in regions such as Asia-Pacific and Latin America.
Sunglasses: Sunglasses are increasingly valued for UV protection, helping prevent cataracts and macular degeneration. Public health campaigns have driven adoption, especially in developed markets. However, emerging regions like the Middle East, Africa, and Latin America offer strong growth potential, with local brands enhancing accessibility and affordability.
Intraocular Lenses (IOLs): The intraocular lens (IOL) segment is vital for cataract surgery, replacing the clouded natural lens. Rising cataract cases, especially among the elderly, and innovations like multifocal and toric IOLs are driving demand. Increased surgical volumes and supportive reimbursement policies in countries like India and the U.S. further boost market growth.
Ocular Health Products: This segment includes prescription and over-the-counter products for treating eye conditions and promoting ocular health, such as lubricating drops, glaucoma medications, and supplements. Rising screen time, chronic eye diseases, and ongoing R&D drive steady demand and innovation in targeted treatments.
Treatment Analysis
The global vision care market's treatment landscape is broadly categorized into Surgery, Laser Therapy, and Medication.
Laser Therapy: This segment held the largest share, accounting for 49% in 2024, a testament to its efficacy and growing adoption. Laser therapy encompasses a variety of procedures, primarily for refractive error correction and the management of certain eye diseases.
Refractive Laser Surgeries: Laser procedures like LASIK, PRK, and SMILE offer precise, long-term correction for myopia, hyperopia, and astigmatism, reducing dependence on glasses or contacts. Advanced technology and skilled professionals continue to drive strong growth in this segment.
Therapeutic Laser Procedures: Lasers treat glaucoma, diabetic retinopathy, and secondary cataracts with minimally invasive techniques and high success rates, driving widespread adoption.
Surgery: Traditional eye surgeries remain vital for complex conditions, including cataract removal, glaucoma procedures, retinal repairs, and corneal transplants. Advances in techniques and better post-op care improve outcomes, while government efforts to expand surgical access further boost this segment’s growth.
Medication: This segment focuses on pharmaceutical treatments for eye diseases, including glaucoma drops, anti-inflammatories, antibiotics, and antivirals. Innovations in drug delivery and targeted therapies are improving treatment effectiveness and boosting patient compliance across a range of ocular conditions.
Indication Analysis
The global vision care market is segmented based on various indications, addressing a wide spectrum of ocular health issues.
Glaucoma: This leading segment is projected to grow rapidly, driven by the rising prevalence of glaucoma; an irreversible optic nerve condition. Its progression, especially in the elderly, demands early diagnosis, ongoing monitoring, and long-term treatment, fueling demand for diagnostics, medications, and surgeries.
Refractive Error: Refractive errors like myopia, hyperopia, and astigmatism drive global demand for glasses, contacts, and surgeries, especially as myopia rates rise among youth.
Diabetic Retinopathy: Diabetic retinopathy, a major cause of blindness, is rising with global diabetes rates, boosting demand for screenings, laser therapy, and injections.
Dry Eyes: Dry eye syndrome, worsened by screen use, environment, and aging, increases demand for lubricating drops, artificial tears, and therapies.
Amblyopia (Lazy Eye): Amblyopia, mainly in children, causes reduced vision in one eye; early treatment like patching boosts demand for pediatric eye care products.
Other Indications: This category covers cataracts, conjunctivitis, retinal detachment, AMD, and infections, driving demand for diagnostics, medications, and surgeries.
Distribution Channel Analysis
The distribution of vision care products and services occurs primarily through Retail Stores, Online Stores, and Hospitals & Clinics.
Retail Stores: Retail stores dominate vision care revenue by offering in-person exams, personalized consultations, immediate product access, and trusted customer experiences.
Hospitals & Clinics: Hospitals and eye clinics provide essential advanced diagnostics, surgeries, and prescription treatments for complex and chronic eye conditions.
Regional Outlook
The global vision care market exhibits distinct regional dynamics, influenced by healthcare infrastructure, economic development, demographic trends, and awareness levels.
North America: This region is anticipated to maintain its market leadership throughout the forecast period, commanding a substantial 39.4% revenue share. The dominance of North America is attributed to several factors:
Advanced Healthcare Infrastructure: The presence of highly developed healthcare systems, state-of-the-art eye clinics, and a large pool of skilled ophthalmologists and optometrists.
High Disposable Income: Greater purchasing power among consumers allows for higher adoption rates of premium vision care products and advanced corrective procedures.
Favorable Reimbursement Policies: Robust insurance coverage and favorable reimbursement policies for eye examinations, cataract surgeries, and other treatments significantly reduce the financial burden on patients, encouraging access to care.
High Awareness: A strong emphasis on preventive healthcare and widespread awareness campaigns regarding ocular diseases contribute to early diagnosis and treatment.
Aging Population: A significant aging demographic in the U.S. and Canada drives demand for age-related eye care services and products.
Technological Adoption: Early and rapid adoption of cutting-edge vision care technologies and innovative products.
Growing Use of Spectacles: The increasing acceptance of spectacles as a fashion statement further fuels market growth.
Asia Pacific (APAC): Asia Pacific is anticipated to be the second-largest market globally and is expected to exhibit the highest Compound Annual Growth Rate (CAGR) during the forecast period. This rapid expansion is driven by:
Large and Growing Population: The sheer size of the population, particularly in countries like China and India, presents an enormous customer base.
High Prevalence of Ocular Diseases: The region faces a disproportionately high burden of ocular diseases, including a rapidly increasing incidence of myopia among children and young adults, and a significant number of cataract cases.
Rising Disposable Incomes: Economic growth and increasing disposable incomes in developing nations across APAC (e.g., China, India, Indonesia, and Vietnam) are making vision care products and services more affordable and accessible to a larger segment of the population.
Increasing Accessibility of Affordable Products: The presence of numerous local manufacturers offering cost-effective vision care solutions caters to a broader consumer base.
Growing Healthcare Expenditure: Governments and private entities are increasing investments in healthcare infrastructure and eye care services.
High Volume of Cataract Surgeries: Countries in APAC consistently rank among the highest globally for the volume of cataract surgeries performed, directly driving the demand for intraocular lenses.
Europe: Western Europe, including Germany, France, the UK, Italy, and Spain, represents a mature market with a sophisticated healthcare system and an aging population. The market is driven by high awareness, advanced product adoption, and established reimbursement frameworks. Eastern Europe, including Russia and Poland, is experiencing growth driven by improving economic conditions and increasing access to modern vision care.
Latin America: The market for vision care in Latin America is expected to expand steadily. A primary driver in this region is the significant unmet demand for eye care services and products. Increasing awareness, improving economic conditions, and efforts to expand healthcare access are contributing to market growth, though challenges related to affordability and infrastructure remain.
Middle East & Africa (MEA): The MEA market is expected to grow at a slower but consistent rate. While certain GCC countries boast advanced healthcare facilities and high per capita spending, many parts of Africa face significant challenges related to limited access to eye care professionals, lack of awareness, and economic constraints. However, increasing government initiatives to improve healthcare and rising health tourism in some areas offer future growth potential.
By Product (Eyewear, Intraocular Lenses, Ocular Health Products); By Treatment (Laser Therapy, Surgery, Medication); By Indication (Glaucoma, Refractive Error, Diabetic Retinopathy, Dry Eyes, Amblyopia (Lazy Eye), Other Indications); By Distribution Channel (Retail Stores, Online Stores, Hospitals & Clinics)
Research Methodology
Primary Research- 100 Interviews of Stakeholders
Secondary Research
Desk Research
Regional scope
North America (United States, Canada, Mexico)
Latin America (Brazil, Argentina, Columbia)
East Asia And Pacific (China, Japan, South Korea, Australia, Cambodia, Fiji, Indonesia)
Sea And South Asia (India, Singapore, Thailand, Taiwan, Malaysia)
Eastern Europe (Poland, Russia, Czech Republic, Romania)
Western Europe (Germany, U.K., France, Spain, Itlay)
Middle East & Africa (GCC Countries, Egypt, Nigeria, South Africa, Israel)
Competitive Landscape
Alcon, American Sunglass Manufacturing, Charlie Victor, Eyeking, Fielmann Ag, Hoya Corporation, Jins Eyewear Us, Inc., Lcon, Inc., Lensmam Co., Ltd., Luxottica Group, Optex Australia, Polytouch, Rodenstock, Seed Co., Ltd., Sightglass Vision, Inc, Sunshades Eyewear, Viewell.Inc, Zeiss International , EssilorLuxottica, CooperVision, Johnson & Johnson Vision, Bausch Health Companies Inc., GrandVision, Menicon Co., Ltd., Safilo Group
Customization Scope
Customization for segments, region/country-level will be provided. Moreover, additional customization can be done based on the requirements.
Pricing and Purchase Options
Avail customized purchase options to meet your exact research needs. We have three licenses to opt for: Single User License, Multi-User License (Up to 5 Users), Corporate Use License (Unlimited User and Printable PDF).
TABLE OF CONTENTS
1. EXECUTIVE SUMMARY
1.1. MARKET SNAPSHOT
1.2. KEY FINDINGS & INSIGHTS
1.3. ANALYST RECOMMENDATIONS
1.4. FUTURE OUTLOOK
2. RESEARCH METHODOLOGY
2.1. MARKET DEFINITION & SCOPE
2.2. RESEARCH OBJECTIVES: PRIMARY & SECONDARY DATA SOURCES
2.3. DATA COLLECTION SOURCES
2.3.1. COVERAGE OF 100+ PRIMARY RESEARCH/CONSULTATION CALLS WITH INDUSTRY STAKEHOLDERS
FIGURE 17 NORTH AMERICA VISION CARE CURRENT AND FUTURE TYPE ANALYSIS, 2025–2034, (USD MILLION)
FIGURE 18 NORTH AMERICA VISION CARE CURRENT AND FUTURE END USER ANALYSIS, 2025–2034, (USD MILLION)
FIGURE 19 MARKET SHARE BY COUNTRY
FIGURE 20 LATIN AMERICA VISION CARE CURRENT AND FUTURE TYPE ANALYSIS, 2025–2034, (USD MILLION)
FIGURE 21 LATIN AMERICA VISION CARE CURRENT AND FUTURE END USER ANALYSIS, 2025–2034, (USD MILLION)
FIGURE 22 MARKET SHARE BY COUNTRY
FIGURE 23 EASTERN EUROPE VISION CARE CURRENT AND FUTURE TYPE ANALYSIS, 2025–2034, (USD MILLION)
FIGURE 24 EASTERN EUROPE VISION CARE CURRENT AND FUTURE END USER ANALYSIS, 2025–2034, (USD MILLION)
FIGURE 25 MARKET SHARE BY COUNTRY
FIGURE 26 WESTERN EUROPE VISION CARE CURRENT AND FUTURE TYPE ANALYSIS, 2025–2034, (USD MILLION)
FIGURE 27 WESTERN EUROPE VISION CARE CURRENT AND FUTURE END USER ANALYSIS, 2025–2034, (USD MILLION)
FIGURE 28 MARKET SHARE BY COUNTRY
FIGURE 29 EAST ASIA AND PACIFIC VISION CARE CURRENT AND FUTURE TYPE ANALYSIS, 2025–2034, (USD MILLION)
FIGURE 30 EAST ASIA AND PACIFIC VISION CARE CURRENT AND FUTURE END USER ANALYSIS, 2025–2034, (USD MILLION)
FIGURE 31 MARKET SHARE BY COUNTRY
FIGURE 32 SEA AND SOUTH ASIA VISION CARE CURRENT AND FUTURE TYPE ANALYSIS, 2025–2034, (USD MILLION)
FIGURE 33 SEA AND SOUTH ASIA VISION CARE CURRENT AND FUTURE END USER ANALYSIS, 2025–2034, (USD MILLION)
FIGURE 34 MARKET SHARE BY COUNTRY
FIGURE 35 MIDDLE EAST AND AFRICA VISION CARE CURRENT AND FUTURE TYPE ANALYSIS, 2025–2034, (USD MILLION)
FIGURE 36 MIDDLE EAST AND AFRICA VISION CARE CURRENT AND FUTURE END USER ANALYSIS, 2025–2034, (USD MILLION)
FIGURE 37 NORTH AMERICA VISION CARE CURRENT AND FUTURE MARKET VOLUME SHARE REGIONAL ANALYSIS, 2025–2034, (USD MILLION)
FIGURE 38 U.S. VISION CARE CURRENT AND FUTURE TYPE ANALYSIS, 2025–2034, (USD MILLION)
FIGURE 39 U.S. VISION CARE CURRENT AND FUTURE END USER ANALYSIS, 2025–2034, (USD MILLION)
FIGURE 40 CANADA VISION CARE CURRENT AND FUTURE TYPE ANALYSIS, 2025–2034, (USD MILLION)
FIGURE 41 CANADA VISION CARE CURRENT AND FUTURE END USER ANALYSIS, 2025–2034, (USD MILLION)
FIGURE 42 LATIN AMERICA VISION CARE CURRENT AND FUTURE MARKET VOLUME SHARE REGIONAL ANALYSIS, 2025–2034, (USD MILLION)
FIGURE 43 MEXICO VISION CARE CURRENT AND FUTURE TYPE ANALYSIS, 2025–2034, (USD MILLION)
FIGURE 44 MEXICO VISION CARE CURRENT AND FUTURE END USER ANALYSIS, 2025–2034, (USD MILLION)
FIGURE 45 BRAZIL VISION CARE CURRENT AND FUTURE TYPE ANALYSIS, 2025–2034, (USD MILLION)
FIGURE 46 BRAZIL VISION CARE CURRENT AND FUTURE END USER ANALYSIS, 2025–2034, (USD MILLION)
FIGURE 47 ARGENTINA VISION CARE CURRENT AND FUTURE TYPE ANALYSIS, 2025–2034, (USD MILLION)
FIGURE 48 ARGENTINA VISION CARE CURRENT AND FUTURE END USER ANALYSIS, 2025–2034, (USD MILLION)
FIGURE 49 COLUMBIA VISION CARE CURRENT AND FUTURE TYPE ANALYSIS, 2025–2034, (USD MILLION)
FIGURE 50 COLUMBIA VISION CARE CURRENT AND FUTURE END USER ANALYSIS, 2025–2034, (USD MILLION)
FIGURE 51 REST OF LATIN AMERICA VISION CARE CURRENT AND FUTURE TYPE ANALYSIS, 2025–2034, (USD MILLION)
FIGURE 52 REST OF LATIN AMERICA VISION CARE CURRENT AND FUTURE END USER ANALYSIS, 2025–2034, (USD MILLION)
FIGURE 53 EASTERN EUROPE VISION CARE CURRENT AND FUTURE MARKET VOLUME SHARE REGIONAL ANALYSIS, 2025–2034, (USD MILLION)
FIGURE 54 POLAND VISION CARE CURRENT AND FUTURE TYPE ANALYSIS, 2025–2034, (USD MILLION)
FIGURE 55 POLAND VISION CARE CURRENT AND FUTURE END USER ANALYSIS, 2025–2034, (USD MILLION)
FIGURE 56 RUSSIA VISION CARE CURRENT AND FUTURE TYPE ANALYSIS, 2025–2034, (USD MILLION)
FIGURE 57 RUSSIA VISION CARE CURRENT AND FUTURE END USER ANALYSIS, 2025–2034, (USD MILLION)
FIGURE 58 CZECH REPUBLIC VISION CARE CURRENT AND FUTURE TYPE ANALYSIS, 2025–2034, (USD MILLION)
FIGURE 59 CZECH REPUBLIC VISION CARE CURRENT AND FUTURE END USER ANALYSIS, 2025–2034, (USD MILLION)
FIGURE 60 ROMANIA VISION CARE CURRENT AND FUTURE TYPE ANALYSIS, 2025–2034, (USD MILLION)
FIGURE 61 ROMANIA VISION CARE CURRENT AND FUTURE END USER ANALYSIS, 2025–2034, (USD MILLION)
FIGURE 62 REST OF EASTERN EUROPE VISION CARE CURRENT AND FUTURE TYPE ANALYSIS, 2025–2034, (USD MILLION)
FIGURE 63 REST OF EASTERN EUROPE VISION CARE CURRENT AND FUTURE END USER ANALYSIS, 2025–2034, (USD MILLION)
FIGURE 64 WESTERN EUROPE VISION CARE CURRENT AND FUTURE MARKET VOLUME SHARE REGIONAL ANALYSIS, 2025–2034, (USD MILLION)
FIGURE 65 GERMANY VISION CARE CURRENT AND FUTURE TYPE ANALYSIS, 2025–2034, (USD MILLION)
FIGURE 66 GERMANY VISION CARE CURRENT AND FUTURE END USER ANALYSIS, 2025–2034, (USD MILLION)
FIGURE 67 FRANCE VISION CARE CURRENT AND FUTURE TYPE ANALYSIS, 2025–2034, (USD MILLION)
FIGURE 68 FRANCE VISION CARE CURRENT AND FUTURE END USER ANALYSIS, 2025–2034, (USD MILLION)
FIGURE 69 UK VISION CARE CURRENT AND FUTURE TYPE ANALYSIS, 2025–2034, (USD MILLION)
FIGURE 70 UK VISION CARE CURRENT AND FUTURE END USER ANALYSIS, 2025–2034, (USD MILLION)
FIGURE 71 SPAIN VISION CARE CURRENT AND FUTURE TYPE ANALYSIS, 2025–2034, (USD MILLION)
FIGURE 72 SPAIN VISION CARE CURRENT AND FUTURE END USER ANALYSIS, 2025–2034, (USD MILLION)
FIGURE 73 ITALY VISION CARE CURRENT AND FUTURE TYPE ANALYSIS, 2025–2034, (USD MILLION)
FIGURE 74 ITALY VISION CARE CURRENT AND FUTURE END USER ANALYSIS, 2025–2034, (USD MILLION)
FIGURE 75 REST OF WESTERN EUROPE VISION CARE CURRENT AND FUTURE TYPE ANALYSIS, 2025–2034, (USD MILLION)
FIGURE 76 REST OF WESTERN EUROPE VISION CARE CURRENT AND FUTURE END USER ANALYSIS, 2025–2034, (USD MILLION)
FIGURE 77 EAST ASIA AND PACIFIC VISION CARE CURRENT AND FUTURE MARKET VOLUME SHARE REGIONAL ANALYSIS, 2025–2034, (USD MILLION)
FIGURE 78 CHINA VISION CARE CURRENT AND FUTURE TYPE ANALYSIS, 2025–2034, (USD MILLION)
FIGURE 79 CHINA VISION CARE CURRENT AND FUTURE END USER ANALYSIS, 2025–2034, (USD MILLION)
FIGURE 80 JAPAN VISION CARE CURRENT AND FUTURE TYPE ANALYSIS, 2025–2034, (USD MILLION)
FIGURE 81 JAPAN VISION CARE CURRENT AND FUTURE END USER ANALYSIS, 2025–2034, (USD MILLION)
FIGURE 82 AUSTRALIA VISION CARE CURRENT AND FUTURE TYPE ANALYSIS, 2025–2034, (USD MILLION)
FIGURE 83 AUSTRALIA VISION CARE CURRENT AND FUTURE END USER ANALYSIS, 2025–2034, (USD MILLION)
FIGURE 84 CAMBODIA VISION CARE CURRENT AND FUTURE TYPE ANALYSIS, 2025–2034, (USD MILLION)
FIGURE 85 CAMBODIA VISION CARE CURRENT AND FUTURE END USER ANALYSIS, 2025–2034, (USD MILLION)
FIGURE 86 FIJI VISION CARE CURRENT AND FUTURE TYPE ANALYSIS, 2025–2034, (USD MILLION)
FIGURE 87 FIJI VISION CARE CURRENT AND FUTURE END USER ANALYSIS, 2025–2034, (USD MILLION)
FIGURE 88 INDONESIA VISION CARE CURRENT AND FUTURE TYPE ANALYSIS, 2025–2034, (USD MILLION)
FIGURE 89 INDONESIA VISION CARE CURRENT AND FUTURE END USER ANALYSIS, 2025–2034, (USD MILLION)
FIGURE 90 SOUTH KOREA VISION CARE CURRENT AND FUTURE TYPE ANALYSIS, 2025–2034, (USD MILLION)
FIGURE 91 SOUTH KOREA VISION CARE CURRENT AND FUTURE END USER ANALYSIS, 2025–2034, (USD MILLION)
FIGURE 92 REST OF EAST ASIA AND PACIFIC VISION CARE CURRENT AND FUTURE TYPE ANALYSIS, 2025–2034, (USD MILLION)
FIGURE 93 REST OF EAST ASIA AND PACIFIC VISION CARE CURRENT AND FUTURE END USER ANALYSIS, 2025–2034, (USD MILLION)
FIGURE 94 SEA AND SOUTH ASIA VISION CARE CURRENT AND FUTURE MARKET VOLUME SHARE REGIONAL ANALYSIS, 2025–2034, (USD MILLION)
FIGURE 95 BANGLADESH VISION CARE CURRENT AND FUTURE TYPE ANALYSIS, 2025–2034, (USD MILLION)
FIGURE 96 BANGLADESH VISION CARE CURRENT AND FUTURE END USER ANALYSIS, 2025–2034, (USD MILLION)
FIGURE 97 NEW ZEALAND VISION CARE CURRENT AND FUTURE TYPE ANALYSIS, 2025–2034, (USD MILLION)
FIGURE 98 NEW ZEALAND VISION CARE CURRENT AND FUTURE END USER ANALYSIS, 2025–2034, (USD MILLION)
FIGURE 99 INDIA VISION CARE CURRENT AND FUTURE TYPE ANALYSIS, 2025–2034, (USD MILLION)
FIGURE 100 INDIA VISION CARE CURRENT AND FUTURE END USER ANALYSIS, 2025–2034, (USD MILLION)
FIGURE 101 SINGAPORE VISION CARE CURRENT AND FUTURE TYPE ANALYSIS, 2025–2034, (USD MILLION)
FIGURE 102 SINGAPORE VISION CARE CURRENT AND FUTURE END USER ANALYSIS, 2025–2034, (USD MILLION)
FIGURE 103 THAILAND VISION CARE CURRENT AND FUTURE TYPE ANALYSIS, 2025–2034, (USD MILLION)
FIGURE 104 THAILAND VISION CARE CURRENT AND FUTURE END USER ANALYSIS, 2025–2034, (USD MILLION)
FIGURE 105 TAIWAN VISION CARE CURRENT AND FUTURE TYPE ANALYSIS, 2025–2034, (USD MILLION)
FIGURE 106 TAIWAN VISION CARE CURRENT AND FUTURE END USER ANALYSIS, 2025–2034, (USD MILLION)
FIGURE 107 MALAYSIA VISION CARE CURRENT AND FUTURE TYPE ANALYSIS, 2025–2034, (USD MILLION)
FIGURE 108 MALAYSIA VISION CARE CURRENT AND FUTURE END USER ANALYSIS, 2025–2034, (USD MILLION)
FIGURE 109 REST OF SEA AND SOUTH ASIA VISION CARE CURRENT AND FUTURE TYPE ANALYSIS, 2025–2034, (USD MILLION)
FIGURE 110 REST OF SEA AND SOUTH ASIA VISION CARE CURRENT AND FUTURE END USER ANALYSIS, 2025–2034, (USD MILLION)
FIGURE 111 MIDDLE EAST AND AFRICA VISION CARE CURRENT AND FUTURE MARKET VOLUME SHARE REGIONAL ANALYSIS, 2025–2034, (USD MILLION)
FIGURE 112 GCC COUNTRIES VISION CARE CURRENT AND FUTURE TYPE ANALYSIS, 2025–2034, (USD MILLION)
FIGURE 113 GCC COUNTRIES VISION CARE CURRENT AND FUTURE END USER ANALYSIS, 2025–2034, (USD MILLION)
FIGURE 114 SAUDI ARABIA VISION CARE CURRENT AND FUTURE TYPE ANALYSIS, 2025–2034, (USD MILLION)
FIGURE 115 SAUDI ARABIA VISION CARE CURRENT AND FUTURE END USER ANALYSIS, 2025–2034, (USD MILLION)
FIGURE 116 UAE VISION CARE CURRENT AND FUTURE TYPE ANALYSIS, 2025–2034, (USD MILLION)
FIGURE 117 UAE VISION CARE CURRENT AND FUTURE END USER ANALYSIS, 2025–2034, (USD MILLION)
FIGURE 118 BAHRAIN VISION CARE CURRENT AND FUTURE TYPE ANALYSIS, 2025–2034, (USD MILLION)
FIGURE 119 BAHRAIN VISION CARE CURRENT AND FUTURE END USER ANALYSIS, 2025–2034, (USD MILLION)
FIGURE 120 KUWAIT VISION CARE CURRENT AND FUTURE TYPE ANALYSIS, 2025–2034, (USD MILLION)
FIGURE 121 KUWAIT VISION CARE CURRENT AND FUTURE END USER ANALYSIS, 2025–2034, (USD MILLION)
FIGURE 122 OMAN VISION CARE CURRENT AND FUTURE TYPE ANALYSIS, 2025–2034, (USD MILLION)
FIGURE 123 OMAN VISION CARE CURRENT AND FUTURE END USER ANALYSIS, 2025–2034, (USD MILLION)
FIGURE 124 QATAR VISION CARE CURRENT AND FUTURE TYPE ANALYSIS, 2025–2034, (USD MILLION)
FIGURE 125 QATAR VISION CARE CURRENT AND FUTURE END USER ANALYSIS, 2025–2034, (USD MILLION)
FIGURE 126 EGYPT VISION CARE CURRENT AND FUTURE TYPE ANALYSIS, 2025–2034, (USD MILLION)
FIGURE 127 EGYPT VISION CARE CURRENT AND FUTURE END USER ANALYSIS, 2025–2034, (USD MILLION)
FIGURE 128 NIGERIA VISION CARE CURRENT AND FUTURE TYPE ANALYSIS, 2025–2034, (USD MILLION)
FIGURE 129 NIGERIA VISION CARE CURRENT AND FUTURE END USER ANALYSIS, 2025–2034, (USD MILLION)
FIGURE 130 SOUTH AFRICA VISION CARE CURRENT AND FUTURE TYPE ANALYSIS, 2025–2034, (USD MILLION)
FIGURE 131 SOUTH AFRICA VISION CARE CURRENT AND FUTURE END USER ANALYSIS, 2025–2034, (USD MILLION)
FIGURE 132 ISRAEL VISION CARE CURRENT AND FUTURE TYPE ANALYSIS, 2025–2034, (USD MILLION)
FIGURE 133 ISRAEL VISION CARE CURRENT AND FUTURE END USER ANALYSIS, 2025–2034, (USD MILLION)
FIGURE 134 REST OF MEA VISION CARE CURRENT AND FUTURE TYPE ANALYSIS, 2025–2034, (USD MILLION)
FIGURE 135 REST OF MEA VISION CARE CURRENT AND FUTURE END USER ANALYSIS, 2025–2034, (USD MILLION)
FIGURE 136 U. S. MARKET SHARE ANALYSIS BY TYPE (2024)
FIGURE 137 U. S. MARKET SHARE ANALYSIS BY END USER (2024)
FIGURE 138 CANADA MARKET SHARE ANALYSIS BY TYPE (2024)
FIGURE 139 CANADA MARKET SHARE ANALYSIS BY END USER (2024)
FIGURE 140 MEXICO MARKET SHARE ANALYSIS BY TYPE (2024)
FIGURE 141 MEXICO MARKET SHARE ANALYSIS BY END USER (2024)
FIGURE 142 CHINA MARKET SHARE ANALYSIS BY TYPE (2024)
FIGURE 143 CHINA MARKET SHARE ANALYSIS BY END USER (2024)
FIGURE 144 JAPAN MARKET SHARE ANALYSIS BY TYPE (2024)
FIGURE 145 JAPAN MARKET SHARE ANALYSIS BY END USER (2024)
FIGURE 146 INDIA MARKET SHARE ANALYSIS BY TYPE (2024)
FIGURE 147 INDIA MARKET SHARE ANALYSIS BY END USER (2024)
FIGURE 148 SOUTH KOREA MARKET SHARE ANALYSIS BY TYPE (2024)
FIGURE 149 SOUTH KOREA MARKET SHARE ANALYSIS BY END USER (2024)
FIGURE 150 SAUDI ARABIA MARKET SHARE ANALYSIS BY TYPE (2024)
FIGURE 151 SAUDI ARABIA MARKET SHARE ANALYSIS BY END USER (2024)
FIGURE 152 UAE MARKET SHARE ANALYSIS BY TYPE (2024)
FIGURE 153 UAE MARKET SHARE ANALYSIS BY END USER (2024)
FIGURE 154 EGYPT MARKET SHARE ANALYSIS BY TYPE (2024)
FIGURE 155 EGYPT MARKET SHARE ANALYSIS BY END USER (2024)
FIGURE 156 NIGERIA MARKET SHARE ANALYSIS BY TYPE (2024)
FIGURE 157 NIGERIA MARKET SHARE ANALYSIS BY END USER (2024)
FIGURE 158 SOUTH AFRICA MARKET SHARE ANALYSIS BY TYPE (2024)
FIGURE 159 SOUTH AFRICA MARKET SHARE ANALYSIS BY END USER (2024)
FIGURE 160 GERMANY MARKET SHARE ANALYSIS BY TYPE (2024)
FIGURE 161 GERMANY MARKET SHARE ANALYSIS BY END USER (2024)
FIGURE 162 FRANCE MARKET SHARE ANALYSIS BY TYPE (2024)
FIGURE 163 FRANCE MARKET SHARE ANALYSIS BY END USER (2024)
FIGURE 164 UK MARKET SHARE ANALYSIS BY TYPE (2024)
FIGURE 165 UK MARKET SHARE ANALYSIS BY END USER (2024)
FIGURE 166 SPAIN MARKET SHARE ANALYSIS BY TYPE (2024)
FIGURE 167 SPAIN MARKET SHARE ANALYSIS BY END USER (2024)
FIGURE 168 ITALY MARKET SHARE ANALYSIS BY TYPE (2024)
FIGURE 169 ITALY MARKET SHARE ANALYSIS BY END USER (2024)
FIGURE 170 BRAZIL MARKET SHARE ANALYSIS BY TYPE (2024)
FIGURE 171 BRAZIL MARKET SHARE ANALYSIS BY END USER (2024)
FIGURE 172 ARGENTINA MARKET SHARE ANALYSIS BY TYPE (2024)
FIGURE 173 ARGENTINA MARKET SHARE ANALYSIS BY END USER (2024)
FIGURE 174 COLUMBIA MARKET SHARE ANALYSIS BY TYPE (2024)
FIGURE 175 COLUMBIA MARKET SHARE ANALYSIS BY END USER (2024)
FIGURE 176 GLOBAL VISION CARE CURRENT AND FUTURE MARKET KEY COUNTRY LEVEL ANALYSIS, 2024–2034, (USD MILLION)
FIGURE 177 FINANCIAL OVERVIEW:
Key Players Analysis:
The global vision care market is highly competitive and fragmented, characterized by the presence of a few dominant multinational corporations alongside numerous regional and local players. This fragmentation fosters innovation and provides a diverse range of products and services. Companies compete on factors such as product innovation, technological superiority, pricing strategies, distribution network strength, brand reputation, and customer service.
Alcon is identified as a leading player in the market and is anticipated to retain its dominant position throughout the forecast duration. Alcon's sustained leadership is attributed to its robust strategic plans, including aggressive investment in research and development for new vision care products, continuous technological innovations across its portfolio (surgical equipment, contact lenses, ocular health products), and strategic partnerships. The company also has a strong focus on expanding its presence in developing and emerging nations, leveraging these high-growth markets.
Market Key Players
Alcon
American Sunglass Manufacturing
Charlie Victor
Eyeking
Fielmann Ag
Hoya Corporation
Jins Eyewear Us, Inc.
Lcon, Inc.
Lensmam Co., Ltd.
Luxottica Group
Optex Australia
Polytouch
Rodenstock
Seed Co., Ltd.
Sightglass Vision, Inc
Sunshades Eyewear
Viewell.Inc
Zeiss International
EssilorLuxottica
CooperVision
Johnson & Johnson Vision
Bausch Health Companies Inc.
GrandVision
Menicon Co., Ltd.
Safilo Group
Drivers
Rising Global Incidence of Cataracts:
Cataracts cause nearly 50% of global blindness, driving strong demand for intraocular lenses (IOLs). Rising case numbers, especially in countries like India and the U.S., along with safer surgeries, advanced IOL technology, and supportive reimbursement policies, are propelling significant growth in the cataract treatment and IOL market segment.
Aging Global Population:
The global aging population is a key driver of vision care demand, as older adults face higher risks of conditions like cataracts, glaucoma, AMD, and presbyopia. This demographic shift fuels ongoing need for eye exams, corrective lenses, and surgeries, supporting steady growth in vision care products and services.
Increasing Screen Time and Digital Device Usage:
Widespread digital screen use has increased cases of eye strain and Computer Vision Syndrome, driving demand for blue light filtering lenses, anti-reflective coatings, and ergonomic eyewear to reduce visual discomfort.
Growing Awareness of Eye Health:
Awareness campaigns by health bodies and governments are promoting regular eye exams and protection from UV and pollution, encouraging consumers to proactively seek vision care products and preventive services.
Technological Advancements and Innovations:
Ongoing innovation in diagnostics, surgical methods, lens materials, and smart eyewear is transforming vision care. Emerging treatments like gene and stem cell therapy further broaden the market’s scope and possibilities.
Flourishing E-commerce Sector:
The rise of online retail is reshaping vision care access, offering convenience, competitive pricing, and virtual try-ons for products like contact lenses and glasses, especially benefiting remote and underserved regions.
Restraints
Vision Distortion Caused by Glasses:
Spectacle wearers with high prescriptions or astigmatism may face peripheral vision distortion, causing discomfort and adaptation issues. These challenges can reduce compliance with glasses, affecting overall vision care adherence.
Complications Associated with Contact Lenses:
Dry eye syndrome is a common issue with contact lens use, often worsened by extended wear or poor hygiene. Serious risks like infections and ulcers can deter users and limit market growth.
High Cost of Advanced Treatments and Products:
Advanced vision care technologies offer better outcomes but often come at high costs, limiting access for many; especially in developing regions or areas with limited insurance; thus restricting widespread adoption.
Lack of Awareness and Accessibility in Underserved Regions:
Despite rising awareness, rural and low-income areas face major gaps in eye care due to limited awareness, inadequate access to professionals, and poor infrastructure, leaving many with uncorrected vision problems.
Stringent Regulatory Frameworks:
Strict regulatory requirements in vision care ensure patient safety but often result in long approval timelines, high compliance costs, and delayed product launches, which can hinder innovation and slow market growth.
Trends
Focus on Research and Development (R&D) for Efficient Products:
A major trend in vision care is the growing emphasis by multinational companies and academic institutions on research and development to create more effective, patient-focused products. Innovations include advanced drug delivery systems for eye medications, personalized lenses tailored to individual eye profiles, and AI-driven diagnostic tools for earlier, more accurate disease detection. Rising visual impairments linked to aging, pollution, and sedentary lifestyles drive ongoing innovation in treatments like ointments, pills, and eye drops.
Integration of Cutting-Edge Technology:
The vision care market is rapidly embracing advanced technologies.
Computer-Assisted Ophthalmology: This involves the use of sophisticated software and hardware for precise surgical planning, intraoperative guidance, and post-operative monitoring, enhancing the accuracy and safety of procedures.
Tele-ophthalmology: The adoption of telemedicine platforms for remote eye screenings, consultations, and monitoring is expanding access to care, particularly in rural or underserved areas. This trend has been accelerated by global events, demonstrating its potential for efficient patient management.
Artificial Intelligence (AI) and Machine Learning (ML): AI is being integrated into diagnostic devices for automated analysis of retinal scans, glaucoma detection, and diabetic retinopathy screening, leading to earlier diagnosis and improved patient outcomes.
Gene Therapy and Stem Cell Therapy: These revolutionary treatments are emerging as potential cures for previously untreatable genetic eye diseases and conditions involving retinal degeneration, offering hope for restoring vision at a fundamental level.
Smart Eyewear: The development of smart glasses with integrated displays, augmented reality capabilities, and health monitoring features represents a nascent but promising trend that could redefine the functional and interactive aspects of eyewear.
Growth of E-commerce and Digital Channels:
The flourishing e-commerce sector is fundamentally altering the distribution landscape. Consumers are increasingly opting for online purchases of contact lenses, reading glasses, and sunglasses due to convenience, competitive pricing, and features like virtual try-on. This shift necessitates that traditional brick-and-mortar retailers also establish a robust online presence to remain competitive.
Spectacles as a Fashion Statement:
The growing popularity of spectacles as a fashion accessory, driven by celebrity endorsements, social media influence, and designer collaborations, has significantly expanded the market beyond purely corrective needs. This trend encourages consumers to own multiple pairs of glasses for different outfits or occasions, boosting sales volume and revenue.
Increased Awareness of UV-Related Visual Impairment:
Public health campaigns and educational efforts have heightened awareness regarding the long-term damage caused by UVA and UVB radiation, leading to increased adoption of sunglasses and lenses with UV protection.
Recent Developments (2024):
The year 2024 has witnessed several strategic moves by key players, underscoring the dynamic nature of the market:
Alcon (April 2024): Acquired Innovative Vision Technologies, a strategic move aimed at expanding its portfolio of advanced vision care solutions. This acquisition is expected to enhance Alcon’s product offerings, particularly in specialized areas, and further strengthen its already dominant position in the global vision care market by integrating cutting-edge technologies.
Essilor (March 2024): Launched its new line of blue light filtering lenses, EyeProtect Plus. This product directly addresses the growing concern of digital eye strain and the increasing demand for protection against prolonged digital screen exposure, showcasing Essilor's commitment to innovation in lens technology.
CooperVision (January 2024): Merged with Advanced Contact Lens Technologies. This merger is designed to combine expertise and resources, aiming to drive innovation in contact lens technology, optimize manufacturing processes, and expand market reach through a broader product portfolio and distribution network.
Johnson & Johnson Vision (February 2024): Introduced Acuvue Oasys Max, an advanced daily disposable contact lens. This new product offers improved moisture retention and enhanced UV protection, directly addressing key consumer demands for comfort and eye health, further solidifying J&J Vision's leadership in the contact lens segment.
Bausch Health Companies Inc. (May 2024): Acquired VisionCare Inc. This acquisition aims to broaden Bausch Health’s product range in vision care, particularly in areas like low vision aids and implantable devices, and enhance its technological capabilities in treating a wider spectrum of eye conditions.
GrandVision (March 2024): Completed a merger with OptiRetail Group. This strategic merger aims to significantly expand GrandVision's retail footprint, improve customer access to high-quality vision care products and services globally, and consolidate its position as a leading optical retailer.