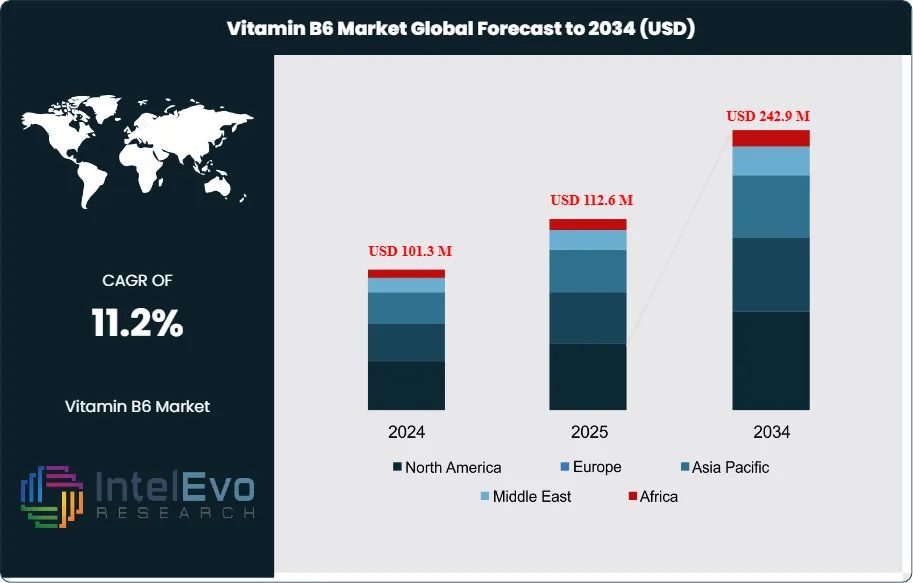
The Vitamin B6 Market is estimated at around USD 101.3 million in 2024 and is projected to reach nearly USD 242.9 million by 2034, growing at an estimated CAGR of about 11.2% during 2025–2034. Growing consumer focus on immunity, cognitive health, and nutritional deficiencies continues to accelerate category adoption. As preventive wellness becomes mainstream globally, Vitamin B6 demand is expanding across supplements, fortified foods, women’s health, and mental well-being. The decade ahead is expected to witness strong innovation in bioavailability-enhanced and clean-label formulations, further lifting the market’s long-term trajectory.
Building on steady multivitamin adoption, the market continues to scale from early-2020s baselines and is positioned for sustained mid- to high-single-digit expansion. Momentum reflects heightened health awareness and the broad physiological relevance of pyridoxine in amino-acid metabolism, neurotransmitter synthesis, and immune support.
According to U.S. FDA estimates, roughly 28–36% of the general population regularly consumes supplements containing vitamin B6. Therapeutic use cases span anemia, mood disorders, and cognitive decline, where B6 complements broader interventions by supporting hematological and neurological function.
On the demand side, growth is underpinned by aging populations, preventive-health behaviors, and fortified staples in emerging markets. Public-health priorities from organizations such as WHO and FAO—centered on food fortification, micronutrient programs, and nutrition education—are widening access and awareness. Supply-side dynamics are improving as synthesis and fermentation yields rise, supplier qualification tightens, and automation in premix blending enhances quality and consistency; however, input-cost volatility, batch-to-batch variability, and compliance burdens remain material risks.
Innovation is accelerating toward bioavailability-enhanced formats (sustained-release, liposomal, and B-complex co-formulations), clean-label and plant-derived sources, and AI-enabled personalization that matches dosing to biomarkers and lifestyle data. Digital retail and subscription models are compressing route-to-market timelines.
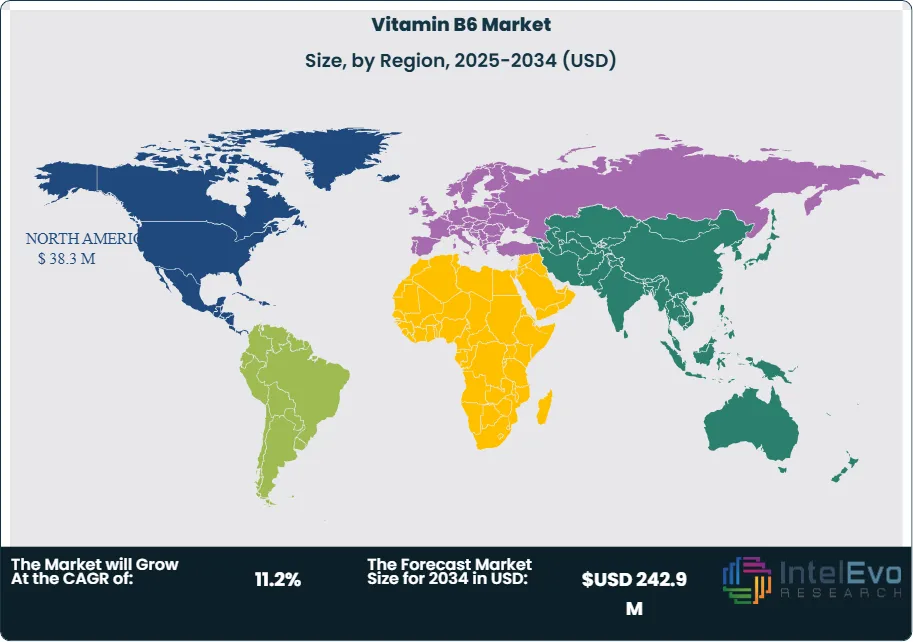
Regionally, North America remains the anchor, accounting for approximately 37.8% of 2024 revenue (about US$ 34.9 million) on the back of high per-capita spend and a sophisticated omnichannel ecosystem. Europe benefits from strong pharmacy channels and a robust clinical evidence base, though claim restrictions can temper marketing velocity. Asia Pacific is the fastest-rising opportunity, propelled by urbanization, middle-class expansion, and fortification mandates; China and India are expected to outpace the global average through 2034 as retail distribution deepens and local contract manufacturing scales. Latin America and the Middle East & Africa offer selective upside as fortification initiatives expand and price points localize.
For investors, near-term hotspots include differentiated delivery technologies, fermentation-based and natural-origin inputs, and B6-rich functional foods aligned with clean-label positioning and personalized wellness programs. Execution will depend on regulatory vigilance—particularly around maximum-permitted levels, labeling, and safety monitoring—and on reliable, diversified sourcing to shield margins against supply shocks.
Key Takeaways
Market Growth: The global vitamin B6 market totalled USD 101.3 million in 2024 and is projected to reach USD 242.9 million by 2034 at a CAGR of 11.2% (2024–2034), propelled by preventive-health spending, fortified foods, and mainstream supplement adoption. North America anchored demand in 2024, while Asia Pacific is set to outpace the global average through 2034.
Product Form: Capsules led with 45.7% share in 2024, supported by dose precision, stability in multi-ingredient blends, and the rapid uptake of vegetarian and sustained-release formats that enable premium pricing and adherence.
Application: Premenstrual syndrome (PMS) accounted for 34.8% of application revenues in 2024, reflecting strong consumer awareness and physician/pharmacist recommendations for symptom management, particularly within combination B-complex and women’s health SKUs.
Distribution Channel: Pharmacies & drug stores captured 50.4% of 2024 revenue, benefitting from pharmacist counseling, trust in regulated retail, and high conversion on clinically positioned SKUs versus pure-play mass or online channels.
Driver: Mainstream usage is deepening—28–36% of the U.S. population reports regular consumption of supplements containing vitamin B6—while WHO/FAO-backed fortification and nutrition education programs expand access and awareness in emerging markets.
Restraint: Regulatory dosage caps and claim scrutiny constrain high-dose innovation and labeling flexibility (e.g., U.S. adult UL ≈100 mg/day; EU’s UL is materially lower), increasing compliance costs and extending time-to-market for new formulations.
Opportunity: Asia Pacific represents the clearest upside, with anticipated double-digit CAGR driven by urbanization, retail penetration in China and India, and local contract manufacturing; targeted women’s health and cognitive-support SKUs can unlock incremental premium mix.
Trend: Product development is shifting to clean-label, plant-derived inputs and bioavailability-enhanced formats (e.g., sustained-release, liposomal), alongside personalized nutrition programs; leading suppliers (e.g., DSM-Firmenich, BASF, Lonza) are bundling premix, capsule technology, and data-enabled services to accelerate innovation.
Regional Analysis: North America led with 37.8% share in 2024 on high per-capita spend and omnichannel maturity; Europe remains sizable but conservative due to claim restrictions, while Asia Pacific is the investment hotspot given policy support for fortification and faster category formalization relative to Latin America and the Middle East & Africa.
Product Type Analysis
Capsules remain the anchor format as of 2025, building on their 45.7% share in 2024 and benefiting from dose precision, rapid disintegration, and strong compatibility with B-complex co-formulations. The shift toward plant-based, gelatin-free, and sustained-release capsules is widening appeal among vegetarian and clean-label consumers while supporting premium pricing. Contract manufacturers are scaling high-speed encapsulation lines and tighter in-process controls, improving uniformity and reducing batch rejects—key for global brands targeting regulated pharmacy channels.
Tablets retain relevance on cost efficiency and shelf stability, especially for large-volume SKUs and fortified staples in price-sensitive markets. Innovation is moving toward microencapsulation and direct compression blends that improve bioavailability and reduce excipient load, narrowing performance gaps with capsules. The “Others” category—powders, liquids, and gummies—expands through sports, maternal, and pediatric use cases; flavored liquids and stick packs are gaining traction in e-commerce and convenience formats, though they face higher logistics and shelf-life constraints.
Application Analysis
Women’s health continues to set the pace: premenstrual syndrome (PMS) accounted for 34.8% of application revenue in 2024 and remains the leading indication in 2025 as consumers seek non-prescription symptom relief. Evidence-backed positioning around mood, bloating, and fatigue—often paired with magnesium or chasteberry—sustains pharmacist recommendations and repeat purchases. Adjacent segments in perinatal care and post-partum support are emerging as brands expand evidence summaries and clinical claims within local regulations.
Beyond PMS, demand is diversifying across anemia support, fatigue, and cognition. B6’s role in amino-acid metabolism and neurotransmitter synthesis underpins growth in energy and neuro-support SKUs, frequently bundled with B12, iron, and folate. Sports recovery (muscle cramps) and sleep hygiene (insomnia) remain niche but rising, especially in markets with high digital-health engagement. As clinical substantiation matures and dosing is personalized, multi-benefit formulations are expected to outgrow single-claim products through 2034.
Distribution Channels Analysis
Pharmacies & drug stores commanded 50.4% of revenue in 2024 and continue to lead in 2025, supported by pharmacist counseling, higher trust in regulated retail, and insurance-adjacent traffic. Leading chains leverage private labels and evidence-led shelf sets to drive mix toward premium capsule formats and women’s health bundles.
Supermarkets broaden reach through fortified foods and value SKUs, while online channels post the fastest growth on subscription economics, influencer-led education, and rapid NPD cycles. Marketplaces and brand.com sites are using quiz-based personalization and compliance-aware content to increase conversion and retention; however, the online shift intensifies scrutiny on quality certificates and adverse-event monitoring, favoring suppliers with robust traceability.
Regional Analysis
North America remained the largest market with 37.8% share in 2024, and as of 2025 it retains leadership on high per-capita supplement spend, mature omnichannel distribution, and sustained consumer adoption (U.S. supplement usage ~75% of adults). Europe is sizable but more conservative, where stringent health-claim frameworks slow marketing velocity yet support premiumization in pharmacy-led formats.
Asia Pacific is the primary growth engine through 2034, underpinned by urbanization, rising disposable incomes, and government support for fortification in China, India, and Southeast Asia. E-commerce penetration and local contract manufacturing are accelerating access, making APAC the focal point for new product launches and value-engineered SKUs. Latin America and the Middle East & Africa present selective upside as pharmacy networks expand and affordability improves, with multinational–local partnerships critical to navigating pricing, labeling, and registration pathways.
By Product Type (Tablets, Capsules, Others), By Application (Anaemia, Fatigue, Insomnia, Muscle Cramps, Premenstrual Syndrome, Others), By Distribution Channels (Pharmacies & Drug Stores, Supermarkets, Online Channels)
Research Methodology
Primary Research- 100 Interviews of Stakeholders
Secondary Research
Desk Research
Regional scope
North America (United States, Canada, Mexico)
Latin America (Brazil, Argentina, Columbia)
East Asia And Pacific (China, Japan, South Korea, Australia, Cambodia, Fiji, Indonesia)
Sea And South Asia (India, Singapore, Thailand, Taiwan, Malaysia)
Eastern Europe (Poland, Russia, Czech Republic, Romania)
Western Europe (Germany, U.K., France, Spain, Itlay)
Middle East & Africa (GCC Countries, Egypt, Nigeria, South Africa, Israel)
Competitive Landscape
DSM-Firmenich, BASF SE, Zhejiang Tianxin Pharmaceutical Co., Ltd., Hubei Yuancheng Pharmaceutical Co., Ltd., Zhejiang Hangzhou Xinfu Pharmaceutical Co., Ltd., Emperor Chemical Co., Ltd., Jubilant Life Sciences, Shanghai Hegno Pharmaceutical Co., Ltd., Pride Chemical Inc., Lonza Group AG, Vertellus Holdings LLC, Foodchem International Corporation, Hexon Laboratories Pvt. Ltd., GlaxoSmithKline (GSK) – Vitamin Supplement Segment, Nature’s Bounty Co. (Nestlé Health Science), Jiangxi Tianxin Pharmaceutical Co., Ltd., HuiSheng Pharma
Customization Scope
Customization for segments, region/country-level will be provided. Moreover, additional customization can be done based on the requirements.
Pricing and Purchase Options
Avail customized purchase options to meet your exact research needs. We have three licenses to opt for: Single User License, Multi-User License (Up to 5 Users), Corporate Use License (Unlimited User and Printable PDF).
TABLE OF CONTENTS
1. EXECUTIVE SUMMARY
1.1. MARKET SNAPSHOT
1.2. KEY FINDINGS & INSIGHTS
1.3. ANALYST RECOMMENDATIONS
1.4. FUTURE OUTLOOK
2. RESEARCH METHODOLOGY
2.1. MARKET DEFINITION & SCOPE
2.2. RESEARCH OBJECTIVES: PRIMARY & SECONDARY DATA SOURCES
2.3. DATA COLLECTION SOURCES
2.3.1. COVERAGE OF 100+ PRIMARY RESEARCH/CONSULTATION CALLS WITH INDUSTRY STAKEHOLDERS
FIGURE 17 NORTH AMERICA VITAMIN B6 SYSTEM CURRENT AND FUTURE TYPE ANALYSIS, 2025–2034, (USD MILLION)
FIGURE 18 NORTH AMERICA VITAMIN B6 SYSTEM CURRENT AND FUTURE END USER ANALYSIS, 2025–2034, (USD MILLION)
FIGURE 19 MARKET SHARE BY COUNTRY
FIGURE 20 LATIN AMERICA VITAMIN B6 SYSTEM CURRENT AND FUTURE TYPE ANALYSIS, 2025–2034, (USD MILLION)
FIGURE 21 LATIN AMERICA VITAMIN B6 SYSTEM CURRENT AND FUTURE END USER ANALYSIS, 2025–2034, (USD MILLION)
FIGURE 22 MARKET SHARE BY COUNTRY
FIGURE 23 EASTERN EUROPE VITAMIN B6 SYSTEM CURRENT AND FUTURE TYPE ANALYSIS, 2025–2034, (USD MILLION)
FIGURE 24 EASTERN EUROPE VITAMIN B6 SYSTEM CURRENT AND FUTURE END USER ANALYSIS, 2025–2034, (USD MILLION)
FIGURE 25 MARKET SHARE BY COUNTRY
FIGURE 26 WESTERN EUROPE VITAMIN B6 SYSTEM CURRENT AND FUTURE TYPE ANALYSIS, 2025–2034, (USD MILLION)
FIGURE 27 WESTERN EUROPE VITAMIN B6 SYSTEM CURRENT AND FUTURE END USER ANALYSIS, 2025–2034, (USD MILLION)
FIGURE 28 MARKET SHARE BY COUNTRY
FIGURE 29 EAST ASIA AND PACIFIC VITAMIN B6 SYSTEM CURRENT AND FUTURE TYPE ANALYSIS, 2025–2034, (USD MILLION)
FIGURE 30 EAST ASIA AND PACIFIC VITAMIN B6 SYSTEM CURRENT AND FUTURE END USER ANALYSIS, 2025–2034, (USD MILLION)
FIGURE 31 MARKET SHARE BY COUNTRY
FIGURE 32 SEA AND SOUTH ASIA VITAMIN B6 SYSTEM CURRENT AND FUTURE TYPE ANALYSIS, 2025–2034, (USD MILLION)
FIGURE 33 SEA AND SOUTH ASIA VITAMIN B6 SYSTEM CURRENT AND FUTURE END USER ANALYSIS, 2025–2034, (USD MILLION)
FIGURE 34 MARKET SHARE BY COUNTRY
FIGURE 35 MIDDLE EAST AND AFRICA VITAMIN B6 SYSTEM CURRENT AND FUTURE TYPE ANALYSIS, 2025–2034, (USD MILLION)
FIGURE 36 MIDDLE EAST AND AFRICA VITAMIN B6 SYSTEM CURRENT AND FUTURE END USER ANALYSIS, 2025–2034, (USD MILLION)
FIGURE 37 NORTH AMERICA VITAMIN B6 SYSTEM CURRENT AND FUTURE MARKET VOLUME SHARE REGIONAL ANALYSIS, 2025–2034, (USD MILLION)
FIGURE 38 U.S. VITAMIN B6 SYSTEM CURRENT AND FUTURE TYPE ANALYSIS, 2025–2034, (USD MILLION)
FIGURE 39 U.S. VITAMIN B6 SYSTEM CURRENT AND FUTURE END USER ANALYSIS, 2025–2034, (USD MILLION)
FIGURE 40 CANADA VITAMIN B6 SYSTEM CURRENT AND FUTURE TYPE ANALYSIS, 2025–2034, (USD MILLION)
FIGURE 41 CANADA VITAMIN B6 SYSTEM CURRENT AND FUTURE END USER ANALYSIS, 2025–2034, (USD MILLION)
FIGURE 42 LATIN AMERICA VITAMIN B6 SYSTEM CURRENT AND FUTURE MARKET VOLUME SHARE REGIONAL ANALYSIS, 2025–2034, (USD MILLION)
FIGURE 43 MEXICO VITAMIN B6 SYSTEM CURRENT AND FUTURE TYPE ANALYSIS, 2025–2034, (USD MILLION)
FIGURE 44 MEXICO VITAMIN B6 SYSTEM CURRENT AND FUTURE END USER ANALYSIS, 2025–2034, (USD MILLION)
FIGURE 45 BRAZIL VITAMIN B6 SYSTEM CURRENT AND FUTURE TYPE ANALYSIS, 2025–2034, (USD MILLION)
FIGURE 46 BRAZIL VITAMIN B6 SYSTEM CURRENT AND FUTURE END USER ANALYSIS, 2025–2034, (USD MILLION)
FIGURE 47 ARGENTINA VITAMIN B6 SYSTEM CURRENT AND FUTURE TYPE ANALYSIS, 2025–2034, (USD MILLION)
FIGURE 48 ARGENTINA VITAMIN B6 SYSTEM CURRENT AND FUTURE END USER ANALYSIS, 2025–2034, (USD MILLION)
FIGURE 49 COLUMBIA VITAMIN B6 SYSTEM CURRENT AND FUTURE TYPE ANALYSIS, 2025–2034, (USD MILLION)
FIGURE 50 COLUMBIA VITAMIN B6 SYSTEM CURRENT AND FUTURE END USER ANALYSIS, 2025–2034, (USD MILLION)
FIGURE 51 REST OF LATIN AMERICA VITAMIN B6 SYSTEM CURRENT AND FUTURE TYPE ANALYSIS, 2025–2034, (USD MILLION)
FIGURE 52 REST OF LATIN AMERICA VITAMIN B6 SYSTEM CURRENT AND FUTURE END USER ANALYSIS, 2025–2034, (USD MILLION)
FIGURE 53 EASTERN EUROPE VITAMIN B6 SYSTEM CURRENT AND FUTURE MARKET VOLUME SHARE REGIONAL ANALYSIS, 2025–2034, (USD MILLION)
FIGURE 54 POLAND VITAMIN B6 SYSTEM CURRENT AND FUTURE TYPE ANALYSIS, 2025–2034, (USD MILLION)
FIGURE 55 POLAND VITAMIN B6 SYSTEM CURRENT AND FUTURE END USER ANALYSIS, 2025–2034, (USD MILLION)
FIGURE 56 RUSSIA VITAMIN B6 SYSTEM CURRENT AND FUTURE TYPE ANALYSIS, 2025–2034, (USD MILLION)
FIGURE 57 RUSSIA VITAMIN B6 SYSTEM CURRENT AND FUTURE END USER ANALYSIS, 2025–2034, (USD MILLION)
FIGURE 58 CZECH REPUBLIC VITAMIN B6 SYSTEM CURRENT AND FUTURE TYPE ANALYSIS, 2025–2034, (USD MILLION)
FIGURE 59 CZECH REPUBLIC VITAMIN B6 SYSTEM CURRENT AND FUTURE END USER ANALYSIS, 2025–2034, (USD MILLION)
FIGURE 60 ROMANIA VITAMIN B6 SYSTEM CURRENT AND FUTURE TYPE ANALYSIS, 2025–2034, (USD MILLION)
FIGURE 61 ROMANIA VITAMIN B6 SYSTEM CURRENT AND FUTURE END USER ANALYSIS, 2025–2034, (USD MILLION)
FIGURE 62 REST OF EASTERN EUROPE VITAMIN B6 SYSTEM CURRENT AND FUTURE TYPE ANALYSIS, 2025–2034, (USD MILLION)
FIGURE 63 REST OF EASTERN EUROPE VITAMIN B6 SYSTEM CURRENT AND FUTURE END USER ANALYSIS, 2025–2034, (USD MILLION)
FIGURE 64 WESTERN EUROPE VITAMIN B6 SYSTEM CURRENT AND FUTURE MARKET VOLUME SHARE REGIONAL ANALYSIS, 2025–2034, (USD MILLION)
FIGURE 65 GERMANY VITAMIN B6 SYSTEM CURRENT AND FUTURE TYPE ANALYSIS, 2025–2034, (USD MILLION)
FIGURE 66 GERMANY VITAMIN B6 SYSTEM CURRENT AND FUTURE END USER ANALYSIS, 2025–2034, (USD MILLION)
FIGURE 67 FRANCE VITAMIN B6 SYSTEM CURRENT AND FUTURE TYPE ANALYSIS, 2025–2034, (USD MILLION)
FIGURE 68 FRANCE VITAMIN B6 SYSTEM CURRENT AND FUTURE END USER ANALYSIS, 2025–2034, (USD MILLION)
FIGURE 69 UK VITAMIN B6 SYSTEM CURRENT AND FUTURE TYPE ANALYSIS, 2025–2034, (USD MILLION)
FIGURE 70 UK VITAMIN B6 SYSTEM CURRENT AND FUTURE END USER ANALYSIS, 2025–2034, (USD MILLION)
FIGURE 71 SPAIN VITAMIN B6 SYSTEM CURRENT AND FUTURE TYPE ANALYSIS, 2025–2034, (USD MILLION)
FIGURE 72 SPAIN VITAMIN B6 SYSTEM CURRENT AND FUTURE END USER ANALYSIS, 2025–2034, (USD MILLION)
FIGURE 73 ITALY VITAMIN B6 SYSTEM CURRENT AND FUTURE TYPE ANALYSIS, 2025–2034, (USD MILLION)
FIGURE 74 ITALY VITAMIN B6 SYSTEM CURRENT AND FUTURE END USER ANALYSIS, 2025–2034, (USD MILLION)
FIGURE 75 REST OF WESTERN EUROPE VITAMIN B6 SYSTEM CURRENT AND FUTURE TYPE ANALYSIS, 2025–2034, (USD MILLION)
FIGURE 76 REST OF WESTERN EUROPE VITAMIN B6 SYSTEM CURRENT AND FUTURE END USER ANALYSIS, 2025–2034, (USD MILLION)
FIGURE 77 EAST ASIA AND PACIFIC VITAMIN B6 SYSTEM CURRENT AND FUTURE MARKET VOLUME SHARE REGIONAL ANALYSIS, 2025–2034, (USD MILLION)
FIGURE 78 CHINA VITAMIN B6 SYSTEM CURRENT AND FUTURE TYPE ANALYSIS, 2025–2034, (USD MILLION)
FIGURE 79 CHINA VITAMIN B6 SYSTEM CURRENT AND FUTURE END USER ANALYSIS, 2025–2034, (USD MILLION)
FIGURE 80 JAPAN VITAMIN B6 SYSTEM CURRENT AND FUTURE TYPE ANALYSIS, 2025–2034, (USD MILLION)
FIGURE 81 JAPAN VITAMIN B6 SYSTEM CURRENT AND FUTURE END USER ANALYSIS, 2025–2034, (USD MILLION)
FIGURE 82 AUSTRALIA VITAMIN B6 SYSTEM CURRENT AND FUTURE TYPE ANALYSIS, 2025–2034, (USD MILLION)
FIGURE 83 AUSTRALIA VITAMIN B6 SYSTEM CURRENT AND FUTURE END USER ANALYSIS, 2025–2034, (USD MILLION)
FIGURE 84 CAMBODIA VITAMIN B6 SYSTEM CURRENT AND FUTURE TYPE ANALYSIS, 2025–2034, (USD MILLION)
FIGURE 85 CAMBODIA VITAMIN B6 SYSTEM CURRENT AND FUTURE END USER ANALYSIS, 2025–2034, (USD MILLION)
FIGURE 86 FIJI VITAMIN B6 SYSTEM CURRENT AND FUTURE TYPE ANALYSIS, 2025–2034, (USD MILLION)
FIGURE 87 FIJI VITAMIN B6 SYSTEM CURRENT AND FUTURE END USER ANALYSIS, 2025–2034, (USD MILLION)
FIGURE 88 INDONESIA VITAMIN B6 SYSTEM CURRENT AND FUTURE TYPE ANALYSIS, 2025–2034, (USD MILLION)
FIGURE 89 INDONESIA VITAMIN B6 SYSTEM CURRENT AND FUTURE END USER ANALYSIS, 2025–2034, (USD MILLION)
FIGURE 90 SOUTH KOREA VITAMIN B6 SYSTEM CURRENT AND FUTURE TYPE ANALYSIS, 2025–2034, (USD MILLION)
FIGURE 91 SOUTH KOREA VITAMIN B6 SYSTEM CURRENT AND FUTURE END USER ANALYSIS, 2025–2034, (USD MILLION)
FIGURE 92 REST OF EAST ASIA AND PACIFIC VITAMIN B6 SYSTEM CURRENT AND FUTURE TYPE ANALYSIS, 2025–2034, (USD MILLION)
FIGURE 93 REST OF EAST ASIA AND PACIFIC VITAMIN B6 SYSTEM CURRENT AND FUTURE END USER ANALYSIS, 2025–2034, (USD MILLION)
FIGURE 94 SEA AND SOUTH ASIA VITAMIN B6 SYSTEM CURRENT AND FUTURE MARKET VOLUME SHARE REGIONAL ANALYSIS, 2025–2034, (USD MILLION)
FIGURE 95 BANGLADESH VITAMIN B6 SYSTEM CURRENT AND FUTURE TYPE ANALYSIS, 2025–2034, (USD MILLION)
FIGURE 96 BANGLADESH VITAMIN B6 SYSTEM CURRENT AND FUTURE END USER ANALYSIS, 2025–2034, (USD MILLION)
FIGURE 97 NEW ZEALAND VITAMIN B6 SYSTEM CURRENT AND FUTURE TYPE ANALYSIS, 2025–2034, (USD MILLION)
FIGURE 98 NEW ZEALAND VITAMIN B6 SYSTEM CURRENT AND FUTURE END USER ANALYSIS, 2025–2034, (USD MILLION)
FIGURE 99 INDIA VITAMIN B6 SYSTEM CURRENT AND FUTURE TYPE ANALYSIS, 2025–2034, (USD MILLION)
FIGURE 100 INDIA VITAMIN B6 SYSTEM CURRENT AND FUTURE END USER ANALYSIS, 2025–2034, (USD MILLION)
FIGURE 101 SINGAPORE VITAMIN B6 SYSTEM CURRENT AND FUTURE TYPE ANALYSIS, 2025–2034, (USD MILLION)
FIGURE 102 SINGAPORE VITAMIN B6 SYSTEM CURRENT AND FUTURE END USER ANALYSIS, 2025–2034, (USD MILLION)
FIGURE 103 THAILAND VITAMIN B6 SYSTEM CURRENT AND FUTURE TYPE ANALYSIS, 2025–2034, (USD MILLION)
FIGURE 104 THAILAND VITAMIN B6 SYSTEM CURRENT AND FUTURE END USER ANALYSIS, 2025–2034, (USD MILLION)
FIGURE 105 TAIWAN VITAMIN B6 SYSTEM CURRENT AND FUTURE TYPE ANALYSIS, 2025–2034, (USD MILLION)
FIGURE 106 TAIWAN VITAMIN B6 SYSTEM CURRENT AND FUTURE END USER ANALYSIS, 2025–2034, (USD MILLION)
FIGURE 107 MALAYSIA VITAMIN B6 SYSTEM CURRENT AND FUTURE TYPE ANALYSIS, 2025–2034, (USD MILLION)
FIGURE 108 MALAYSIA VITAMIN B6 SYSTEM CURRENT AND FUTURE END USER ANALYSIS, 2025–2034, (USD MILLION)
FIGURE 109 REST OF SEA AND SOUTH ASIA VITAMIN B6 SYSTEM CURRENT AND FUTURE TYPE ANALYSIS, 2025–2034, (USD MILLION)
FIGURE 110 REST OF SEA AND SOUTH ASIA VITAMIN B6 SYSTEM CURRENT AND FUTURE END USER ANALYSIS, 2025–2034, (USD MILLION)
FIGURE 111 MIDDLE EAST AND AFRICA VITAMIN B6 SYSTEM CURRENT AND FUTURE MARKET VOLUME SHARE REGIONAL ANALYSIS, 2025–2034, (USD MILLION)
FIGURE 112 GCC COUNTRIES VITAMIN B6 SYSTEM CURRENT AND FUTURE TYPE ANALYSIS, 2025–2034, (USD MILLION)
FIGURE 113 GCC COUNTRIES VITAMIN B6 SYSTEM CURRENT AND FUTURE END USER ANALYSIS, 2025–2034, (USD MILLION)
FIGURE 114 SAUDI ARABIA VITAMIN B6 SYSTEM CURRENT AND FUTURE TYPE ANALYSIS, 2025–2034, (USD MILLION)
FIGURE 115 SAUDI ARABIA VITAMIN B6 SYSTEM CURRENT AND FUTURE END USER ANALYSIS, 2025–2034, (USD MILLION)
FIGURE 116 UAE VITAMIN B6 SYSTEM CURRENT AND FUTURE TYPE ANALYSIS, 2025–2034, (USD MILLION)
FIGURE 117 UAE VITAMIN B6 SYSTEM CURRENT AND FUTURE END USER ANALYSIS, 2025–2034, (USD MILLION)
FIGURE 118 BAHRAIN VITAMIN B6 SYSTEM CURRENT AND FUTURE TYPE ANALYSIS, 2025–2034, (USD MILLION)
FIGURE 119 BAHRAIN VITAMIN B6 SYSTEM CURRENT AND FUTURE END USER ANALYSIS, 2025–2034, (USD MILLION)
FIGURE 120 KUWAIT VITAMIN B6 SYSTEM CURRENT AND FUTURE TYPE ANALYSIS, 2025–2034, (USD MILLION)
FIGURE 121 KUWAIT VITAMIN B6 SYSTEM CURRENT AND FUTURE END USER ANALYSIS, 2025–2034, (USD MILLION)
FIGURE 122 OMAN VITAMIN B6 SYSTEM CURRENT AND FUTURE TYPE ANALYSIS, 2025–2034, (USD MILLION)
FIGURE 123 OMAN VITAMIN B6 SYSTEM CURRENT AND FUTURE END USER ANALYSIS, 2025–2034, (USD MILLION)
FIGURE 124 QATAR VITAMIN B6 SYSTEM CURRENT AND FUTURE TYPE ANALYSIS, 2025–2034, (USD MILLION)
FIGURE 125 QATAR VITAMIN B6 SYSTEM CURRENT AND FUTURE END USER ANALYSIS, 2025–2034, (USD MILLION)
FIGURE 126 EGYPT VITAMIN B6 SYSTEM CURRENT AND FUTURE TYPE ANALYSIS, 2025–2034, (USD MILLION)
FIGURE 127 EGYPT VITAMIN B6 SYSTEM CURRENT AND FUTURE END USER ANALYSIS, 2025–2034, (USD MILLION)
FIGURE 128 NIGERIA VITAMIN B6 SYSTEM CURRENT AND FUTURE TYPE ANALYSIS, 2025–2034, (USD MILLION)
FIGURE 129 NIGERIA VITAMIN B6 SYSTEM CURRENT AND FUTURE END USER ANALYSIS, 2025–2034, (USD MILLION)
FIGURE 130 SOUTH AFRICA VITAMIN B6 SYSTEM CURRENT AND FUTURE TYPE ANALYSIS, 2025–2034, (USD MILLION)
FIGURE 131 SOUTH AFRICA VITAMIN B6 SYSTEM CURRENT AND FUTURE END USER ANALYSIS, 2025–2034, (USD MILLION)
FIGURE 132 ISRAEL VITAMIN B6 SYSTEM CURRENT AND FUTURE TYPE ANALYSIS, 2025–2034, (USD MILLION)
FIGURE 133 ISRAEL VITAMIN B6 SYSTEM CURRENT AND FUTURE END USER ANALYSIS, 2025–2034, (USD MILLION)
FIGURE 134 REST OF MEA VITAMIN B6 SYSTEM CURRENT AND FUTURE TYPE ANALYSIS, 2025–2034, (USD MILLION)
FIGURE 135 REST OF MEA VITAMIN B6 SYSTEM CURRENT AND FUTURE END USER ANALYSIS, 2025–2034, (USD MILLION)
FIGURE 136 U. S. MARKET SHARE ANALYSIS BY TYPE (2024)
FIGURE 137 U. S. MARKET SHARE ANALYSIS BY END USER (2024)
FIGURE 138 CANADA MARKET SHARE ANALYSIS BY TYPE (2024)
FIGURE 139 CANADA MARKET SHARE ANALYSIS BY END USER (2024)
FIGURE 140 MEXICO MARKET SHARE ANALYSIS BY TYPE (2024)
FIGURE 141 MEXICO MARKET SHARE ANALYSIS BY END USER (2024)
FIGURE 142 CHINA MARKET SHARE ANALYSIS BY TYPE (2024)
FIGURE 143 CHINA MARKET SHARE ANALYSIS BY END USER (2024)
FIGURE 144 JAPAN MARKET SHARE ANALYSIS BY TYPE (2024)
FIGURE 145 JAPAN MARKET SHARE ANALYSIS BY END USER (2024)
FIGURE 146 INDIA MARKET SHARE ANALYSIS BY TYPE (2024)
FIGURE 147 INDIA MARKET SHARE ANALYSIS BY END USER (2024)
FIGURE 148 SOUTH KOREA MARKET SHARE ANALYSIS BY TYPE (2024)
FIGURE 149 SOUTH KOREA MARKET SHARE ANALYSIS BY END USER (2024)
FIGURE 150 SAUDI ARABIA MARKET SHARE ANALYSIS BY TYPE (2024)
FIGURE 151 SAUDI ARABIA MARKET SHARE ANALYSIS BY END USER (2024)
FIGURE 152 UAE MARKET SHARE ANALYSIS BY TYPE (2024)
FIGURE 153 UAE MARKET SHARE ANALYSIS BY END USER (2024)
FIGURE 154 EGYPT MARKET SHARE ANALYSIS BY TYPE (2024)
FIGURE 155 EGYPT MARKET SHARE ANALYSIS BY END USER (2024)
FIGURE 156 NIGERIA MARKET SHARE ANALYSIS BY TYPE (2024)
FIGURE 157 NIGERIA MARKET SHARE ANALYSIS BY END USER (2024)
FIGURE 158 SOUTH AFRICA MARKET SHARE ANALYSIS BY TYPE (2024)
FIGURE 159 SOUTH AFRICA MARKET SHARE ANALYSIS BY END USER (2024)
FIGURE 160 GERMANY MARKET SHARE ANALYSIS BY TYPE (2024)
FIGURE 161 GERMANY MARKET SHARE ANALYSIS BY END USER (2024)
FIGURE 162 FRANCE MARKET SHARE ANALYSIS BY TYPE (2024)
FIGURE 163 FRANCE MARKET SHARE ANALYSIS BY END USER (2024)
FIGURE 164 UK MARKET SHARE ANALYSIS BY TYPE (2024)
FIGURE 165 UK MARKET SHARE ANALYSIS BY END USER (2024)
FIGURE 166 SPAIN MARKET SHARE ANALYSIS BY TYPE (2024)
FIGURE 167 SPAIN MARKET SHARE ANALYSIS BY END USER (2024)
FIGURE 168 ITALY MARKET SHARE ANALYSIS BY TYPE (2024)
FIGURE 169 ITALY MARKET SHARE ANALYSIS BY END USER (2024)
FIGURE 170 BRAZIL MARKET SHARE ANALYSIS BY TYPE (2024)
FIGURE 171 BRAZIL MARKET SHARE ANALYSIS BY END USER (2024)
FIGURE 172 ARGENTINA MARKET SHARE ANALYSIS BY TYPE (2024)
FIGURE 173 ARGENTINA MARKET SHARE ANALYSIS BY END USER (2024)
FIGURE 174 COLUMBIA MARKET SHARE ANALYSIS BY TYPE (2024)
FIGURE 175 COLUMBIA MARKET SHARE ANALYSIS BY END USER (2024)
FIGURE 176 GLOBAL VITAMIN B6 SYSTEM CURRENT AND FUTURE MARKET KEY COUNTRY LEVEL ANALYSIS, 2024–2034, (USD MILLION)
FIGURE 177 FINANCIAL OVERVIEW:
Key Player Analysis
Zhejiang Medicine: A leader in vitamin APIs, Zhejiang Medicine maintains scale advantages in pyridoxine (vitamin B6) through vertically integrated sourcing, GMP-grade manufacturing, and long-standing global registrations. Its portfolio spans vitamin APIs and premix inputs for nutrition brands, with B6 positioned alongside broader B-complex offerings for pharma, food fortification, and dietary supplements. Since 2024, the company has prioritized automation across crystallization and finishing lines and introduced digital batch-traceability to strengthen audit readiness in the U.S. and EU. Zhejiang Medicine differentiates on quality consistency and regulatory depth, leveraging multi-continent dossiers and a diversified customer base that includes top premix blenders and pharmacy-led private labels. Management guidance indicates mid-single-digit volume growth and price discipline into 2025, with incremental capacity debottlenecking (estimated +10–12%) aimed at stabilizing lead times and protecting margins.
Jiangxi Tianxin Pharmaceutical Co., Ltd.: Positioned as a challenger with strong export orientation, Jiangxi Tianxin focuses on vitamin B6 API and intermediates, supported by cost-efficient synthesis routes and solvent-recovery systems that lower unit energy intensity. The company is scaling quality infrastructure—process analytics, near-infrared (NIR) in-line monitoring, and higher-spec cleanroom upgrades—to win higher-value contracts in North America and Europe. Strategic moves include multi-year supply agreements with premix players and expansion of regional distribution in Southeast Asia. Differentiators include competitive pricing, responsive lead times, and an expanding technical services team assisting customers with formulation stability and compatibility in B-complex blends. As of 2025, Jiangxi Tianxin targets high-single-digit revenue growth with a focus on mix upgrade toward pharma-grade B6 and sustained export volumes.
HuiSheng Pharma: An innovator in finished-dosage and specialty formats, HuiSheng Pharma concentrates on B6-enabled formulations for women’s health, energy/cognition, and functional foods. The company has invested in sustained-release and liposomal technologies, positioning SKUs for premium pharmacy and online channels across Asia Pacific. Partnerships with capsule suppliers for plant-based, gelatin-free formats and with local e-commerce operators support direct-to-consumer subscriptions. HuiSheng’s differentiators are rapid new-product development cycles (≤6–9 months), tight integration of real-world evidence into claims frameworks, and localized portfolio strategies (e.g., B6 + magnesium for PMS, B6 + B12 + iron for anemia support). In 2025, management is guiding double-digit growth from omnichannel expansion and incremental margin from premiumized delivery systems.
Hegno: A niche player moving upmarket, Hegno competes in B6 APIs and premix inputs with emphasis on sustainability and traceability. The company is piloting low-carbon utilities (renewables/gas hybrid) and solvent-recycling loops, aiming to cut scope 1 & 2 emissions intensity by a mid-teens percentage by 2026. Commercial strategy centers on regional customers in the Middle East & Africa and Latin America where pharmacy networks are formalizing and fortification programs are scaling. Differentiation stems from transparent supplier audits, batch-level certificates accessible via QR codes, and flexible MOQs for emerging brands. Hegno’s 2025 priorities include selective capacity additions, EU-grade documentation upgrades, and co-development projects with contract manufacturers for value-engineered B6 premixes.
Rising Health Awareness Accelerates Vitamin B6 Demand
As of 2025, the vitamin B6 market is tracking an ~8–9% CAGR toward 2034, underpinned by rising recognition of suboptimal micronutrient intake and the broad clinical relevance of pyridoxine to amino-acid metabolism, neurotransmitter synthesis, and immune support. In major markets, an estimated 30–35% of supplement users regularly purchase products containing vitamin B6, with women’s health, energy/cognition, and fortified staples driving repeat purchase. Public-health initiatives that prioritize fortification and targeted supplementation, together with pharmacist-led recommendations in regulated retail, are expanding access and trust. Strategically, this demand profile supports premiumization (bioavailability-enhanced formats, plant-based capsules) and multi-claim B-complex co-formulations, widening average selling prices and retailer margins.
Restraint:
Regulatory Intake Limits Constrain Innovation
Safety ceilings on chronic intake remain a binding constraint on innovation and labeling. The U.S. tolerable upper intake level (UL) is 100 mg/day for adults, while European limits are markedly lower (often 10–25 mg/day depending on market), tightening permissible claims and dosage architectures. Heightened vigilance around neuropathy risk at high, prolonged doses has accelerated post-market surveillance expectations, lot-level traceability, and third-party testing—raising compliance costs by mid-single digits of COGS for quality-led brands. These constraints compress differentiation at the high-dose end, elongate approval timelines for novel delivery systems, and shift competitive focus toward evidence strength, bioavailability, and clean-label sourcing.
Opportunity:
Expanding Opportunities in Women’s Health & Mental Wellness
Women’s health and mental well-being represent the most scalable adjacencies. PMS-oriented SKUs already account for a leading application share (c. 35% historically) and continue to compound as clinicians recommend non-prescription support; parallel momentum in mood and stress management enables stacked formulations with B6, magnesium, and B12/folate. Digitally enabled personalization—biomarker-guided dosing and subscription programs—can lift lifetime value 20–30% while reducing churn. Geographically, Asia Pacific is poised to deliver double-digit growth through 2030 on urbanization, e-commerce penetration, and local contract manufacturing; investors should expect APAC to contribute >40% of incremental global revenue over the medium term as fortified foods and pharmacy chains scale.
Trend:
Clean-Label & Advanced Delivery Formats Redefine the Market
The category is pivoting to clean-label, food-based, and bioavailability-enhanced delivery. Plant-derived, gelatin-free capsules and sustained-release or liposomal formats are migrating from premium niches into mainstream price tiers, aided by capsule and premix specialists (e.g., Lonza for advanced capsules; dsm-firmenich and BASF for premix and quality assurance). Concurrently, online channels are normalizing quiz-led personalization and subscription replenishment, while brands deploy QR-code traceability and independent certifications to substantiate quality. The net effect is a shift in competitive advantage from high milligram counts to format science, substantiated claims, and data-driven adherence, rewarding players with R&D depth, regulatory fluency, and integrated supply partnerships.
Recent Developments
Dec 2024 – Zhejiang Medicine: Announced a process-intensification program for pyridoxine HCl, targeting +10% output by mid-2026 through crystallization optimization and utilities upgrades (investment valued at over USDXX million). Strategic impact: Enhances capacity reliability and cost position for regulated markets.
Feb 2025 – Jiangxi Tianxin Pharmaceutical: Signed a multi-year supply agreement with a global premix blender to provide pharma-grade B6 for fortification and women’s health SKUs, with initial volumes covering ~15% of the partner’s annual B-complex demand. Strategic impact: Locks in export volumes and improves pricing visibility amid tightening quality standards.
Apr 2025 – HuiSheng Pharma: Launched a sustained-release B6 100 mg capsule line compatible with plant-based shells, supported by a 1,200-patient post-marketing study protocol to track adherence and tolerability; early sell-through in pilot pharmacies indicates ~20% higher repeat rates versus immediate-release SKUs. Strategic impact: Strengthens premium positioning and data-driven differentiation at the pharmacy counter.
Jul 2025 – Hegno: Commissioned a solvent-recovery and heat-integration system at its B6 facility, reducing unit energy consumption by an estimated 12–15% and cutting waste solvent by ~30%. Strategic impact: Improves ESG credentials and lowers COGS, supporting bids with multinational customers requiring sustainability disclosures.
Sep 2025 – Zhejiang Medicine & HuiSheng Pharma (Partnership): Entered a co-development MoU to integrate QR-code batch traceability and shared stability data across select B6 SKUs distributed in Asia Pacific, with rollout to >3,000 retail points by year-end. Strategic impact: Elevates quality transparency, accelerates market access, and raises switching costs for downstream brands.