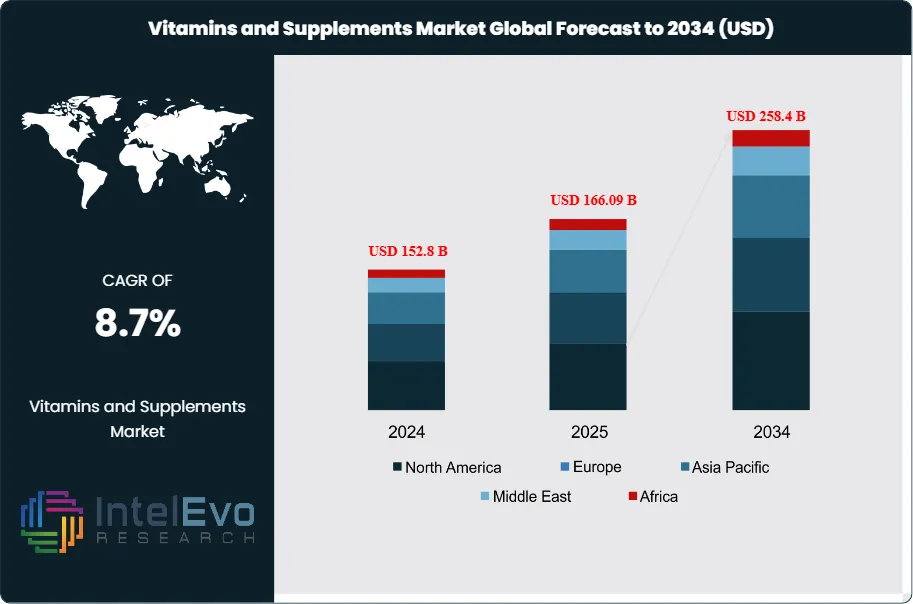
The Vitamins and Supplements Market size is projected to reach USD 258.4 billion by 2034, up from USD 152.8 billion in 2024, growing at a CAGR of 8.7% during the forecast period from 2025 to 2034. This growth is driven by rising consumer awareness of preventive healthcare, increased adoption of nutraceuticals, and a growing shift toward plant-based and personalized nutrition solutions.
The market is also witnessing strong momentum from e-commerce platforms, digital health tracking, and innovation in functional food formulations. As global lifestyles evolve, the demand for natural, immunity-boosting, and sustainable supplements continues to shape the next decade of the health and wellness industry.
As per analysts at Wissen Market Research, the COVID-19 pandemic significantly accelerated demand for vitamins and supplements, as consumers worldwide prioritized immunity and preventive health. The market has since maintained strong momentum, with ongoing product innovation, digital health trends, and rising health awareness fueling growth. However, supply chain disruptions and regulatory scrutiny continue to shape the competitive landscape.
Vitamins and supplements encompass a wide range of products, including multivitamins, single vitamins, minerals, botanicals, probiotics, and specialty supplements. The market is driven by increasing consumer focus on preventive healthcare, aging populations, and the popularity of personalized nutrition. E-commerce and direct-to-consumer channels are expanding rapidly, making supplements more accessible than ever.
Key Takeaways
Market Growth: The Vitamins and Supplements Market is projected to reach USD 258.4 billion by 2034, as consumers seek to boost immunity, manage chronic conditions, and support overall wellness.
Type Dominance: Multivitamins and single vitamin supplements account for over XX% of the market in 2024, followed by minerals (XX%), botanicals (XX%), and specialty supplements (XX%).
Platform Dominance: E-commerce and online pharmacies now represent over XX% of global sales, with brick-and-mortar retail and specialty health stores maintaining a strong presence.
End-User Dominance: Adults aged 35 and above are the largest consumer group, representing XX% of the market, followed by children (XX%), athletes (XX%), and pregnant women (XX%).
Driver: Rising health awareness, preventive healthcare trends, and the influence of social media and digital health platforms are fueling rapid adoption.
Restraint: Regulatory challenges, quality concerns, and the proliferation of counterfeit products present barriers to market growth.
Opportunity: Personalized nutrition, clean-label supplements, and the integration of wearable health tech offer significant opportunities for innovation and expansion.
Trend: The rise of plant-based and vegan supplements, functional gummies, and subscription-based models are reshaping consumer preferences and market strategies.
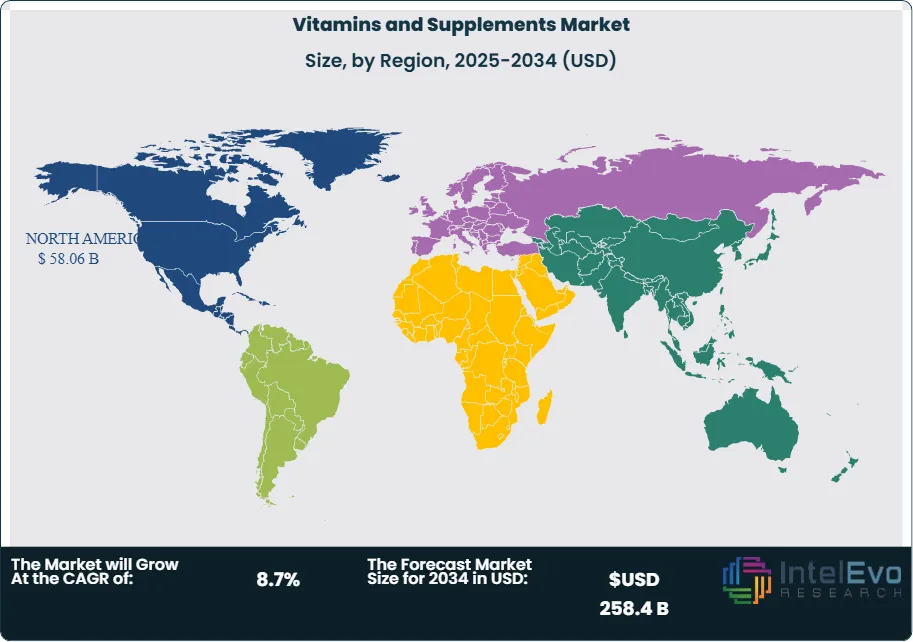
Regional Analysis: North America leads the global market with a 38% share in 2024, followed by Europe (XX%) and Asia Pacific (XX%). Latin America and the Middle East & Africa are emerging markets with rising health supplement adoption.
By Type
The vitamins and supplements market by type is segmented into vitamins and dietary supplements, both witnessing strong global demand due to growing health consciousness and preventive care adoption. Vitamins such as A, C, D, and B-complex remain popular for boosting immunity and overall well-being, while supplements like minerals, omega-3, probiotics, and herbal formulations cater to specific health needs. Consumers are increasingly shifting toward natural, organic, and plant-based supplements to avoid synthetic ingredients. Rising awareness of micronutrient deficiencies, aging populations, and fitness-oriented lifestyles are further driving market growth. The segment continues to evolve with innovations in functional blends and personalized nutrition products designed for targeted health benefits.
By Form
Based on form, the global vitamins and supplements market includes tablets, capsules, powders, liquids, softgels, and gummies. Among these, tablets and capsules dominate due to convenience, dosage accuracy, and longer shelf life. However, the demand for gummies and liquid supplements is surging, particularly among children and millennials, owing to their easy consumption and appealing flavors. Powdered supplements, such as protein and meal replacement blends, are also gaining popularity among fitness enthusiasts and athletes. The increasing preference for functional and on-the-go nutrition products is pushing manufacturers to innovate with new delivery formats that enhance bioavailability, taste, and consumer engagement, thereby expanding the overall market reach across diverse demographics.
By Distribution Channel
The distribution landscape of the vitamins and supplements market is rapidly evolving, driven by the digitalization of health retail. Pharmacies and drug stores continue to hold a dominant share due to consumer trust and professional guidance. However, online retail and e-commerce platforms are emerging as the fastest-growing segment, supported by subscription-based models, personalized product recommendations, and convenience of home delivery. Supermarkets, hypermarkets, and specialty health stores also contribute significantly to sales, offering a wide variety of brands. The rising penetration of mobile health apps and direct-to-consumer brands is transforming how consumers access and purchase nutritional products, signaling a clear shift toward digital and omnichannel retail strategies.
By End User Industry
The Vitamins and Supplements Market by End User Industry serves multiple sectors, including pharmaceuticals, nutraceuticals, food & beverages, sports nutrition, and personal care. The pharmaceutical industry leads the market, driven by prescription-based and preventive supplements for immunity, bone health, and chronic disease management. The nutraceuticals segment is expanding rapidly due to rising consumer preference for natural, plant-based, and functional products. In the food and beverage industry, fortification of everyday products such as cereals, dairy, and beverages is creating new growth opportunities. Sports nutrition continues to see robust demand from athletes and fitness enthusiasts seeking performance-enhancing formulations, while the personal care industry integrates supplements promoting skin, hair, and overall beauty wellness.
By Regional Analysis
Regionally, the Global Vitamins and Supplements Market demonstrates strong geographic diversity and growth potential. North America dominates due to high consumer awareness, premium product availability, and a robust regulatory framework. Europe follows, driven by an aging population, eco-friendly formulations, and strict quality standards. The Asia-Pacific region represents the fastest-growing market, fueled by economic growth, changing lifestyles, and increasing adoption of preventive healthcare in countries like China, India, and Japan. Latin America shows steady expansion due to improved healthcare access and retail penetration, while the Middle East & Africa region is emerging as a new frontier with rising disposable income and growing awareness about nutrition and wellness.
By Type (Vitamins, Supplements), By Form (Tablets, Capsules, Powders, Liquids, Gummies, Softgels), By Distribution Channel (Pharmacies & Drug Stores, Supermarkets & Hypermarkets, Online Retail & E-commerce, Specialty Health Stores, Direct Sales), By End User (Adults, Children, Geriatric Population, Pregnant Women, Athletes)
Research Methodology
Primary Research- 100 Interviews of Stakeholders
Secondary Research
Desk Research
Regional scope
North America (United States, Canada, Mexico)
Latin America (Brazil, Argentina, Columbia)
East Asia And Pacific (China, Japan, South Korea, Australia, Cambodia, Fiji, Indonesia)
Sea And South Asia (India, Singapore, Thailand, Taiwan, Malaysia)
Eastern Europe (Poland, Russia, Czech Republic, Romania)
Western Europe (Germany, U.K., France, Spain, Itlay)
Middle East & Africa (GCC Countries, Egypt, Nigeria, South Africa, Israel)
Competitive Landscape
Pfizer Inc., Amway Corp., Bayer AG, Herbalife Nutrition Ltd., Abbott Laboratories, Nature’s Bounty Co., Glanbia PLC, GNC Holdings, LLC, Nestlé Health Science, NOW Foods, NutraScience Labs, DSM Nutritional Products, Himalaya Wellness, Unilever PLC (Horlicks, Olly), Church & Dwight Co., Inc.
Customization Scope
Customization for segments, region/country-level will be provided. Moreover, additional customization can be done based on the requirements.
Pricing and Purchase Options
Avail customized purchase options to meet your exact research needs. We have three licenses to opt for: Single User License, Multi-User License (Up to 5 Users), Corporate Use License (Unlimited User and Printable PDF).
TABLE OF CONTENTS
1. EXECUTIVE SUMMARY
1.1. MARKET SNAPSHOT
1.2. KEY FINDINGS & INSIGHTS
1.3. ANALYST RECOMMENDATIONS
1.4. FUTURE OUTLOOK
2. RESEARCH METHODOLOGY
2.1. MARKET DEFINITION & SCOPE
2.2. RESEARCH OBJECTIVES: PRIMARY & SECONDARY DATA SOURCES
2.3. DATA COLLECTION SOURCES
2.3.1. COVERAGE OF 100+ PRIMARY RESEARCH/CONSULTATION CALLS WITH INDUSTRY STAKEHOLDERS
FIGURE 17 NORTH AMERICA VITAMINS AND SUPPLEMENTS CURRENT AND FUTURE TYPE ANALYSIS, 2025–2034, (USD MILLION)
FIGURE 18 NORTH AMERICA VITAMINS AND SUPPLEMENTS CURRENT AND FUTURE END USER ANALYSIS, 2025–2034, (USD MILLION)
FIGURE 19 MARKET SHARE BY COUNTRY
FIGURE 20 LATIN AMERICA VITAMINS AND SUPPLEMENTS CURRENT AND FUTURE TYPE ANALYSIS, 2025–2034, (USD MILLION)
FIGURE 21 LATIN AMERICA VITAMINS AND SUPPLEMENTS CURRENT AND FUTURE END USER ANALYSIS, 2025–2034, (USD MILLION)
FIGURE 22 MARKET SHARE BY COUNTRY
FIGURE 23 EASTERN EUROPE VITAMINS AND SUPPLEMENTS CURRENT AND FUTURE TYPE ANALYSIS, 2025–2034, (USD MILLION)
FIGURE 24 EASTERN EUROPE VITAMINS AND SUPPLEMENTS CURRENT AND FUTURE END USER ANALYSIS, 2025–2034, (USD MILLION)
FIGURE 25 MARKET SHARE BY COUNTRY
FIGURE 26 WESTERN EUROPE VITAMINS AND SUPPLEMENTS CURRENT AND FUTURE TYPE ANALYSIS, 2025–2034, (USD MILLION)
FIGURE 27 WESTERN EUROPE VITAMINS AND SUPPLEMENTS CURRENT AND FUTURE END USER ANALYSIS, 2025–2034, (USD MILLION)
FIGURE 28 MARKET SHARE BY COUNTRY
FIGURE 29 EAST ASIA AND PACIFIC VITAMINS AND SUPPLEMENTS CURRENT AND FUTURE TYPE ANALYSIS, 2025–2034, (USD MILLION)
FIGURE 30 EAST ASIA AND PACIFIC VITAMINS AND SUPPLEMENTS CURRENT AND FUTURE END USER ANALYSIS, 2025–2034, (USD MILLION)
FIGURE 31 MARKET SHARE BY COUNTRY
FIGURE 32 SEA AND SOUTH ASIA VITAMINS AND SUPPLEMENTS CURRENT AND FUTURE TYPE ANALYSIS, 2025–2034, (USD MILLION)
FIGURE 33 SEA AND SOUTH ASIA VITAMINS AND SUPPLEMENTS CURRENT AND FUTURE END USER ANALYSIS, 2025–2034, (USD MILLION)
FIGURE 34 MARKET SHARE BY COUNTRY
FIGURE 35 MIDDLE EAST AND AFRICA VITAMINS AND SUPPLEMENTS CURRENT AND FUTURE TYPE ANALYSIS, 2025–2034, (USD MILLION)
FIGURE 36 MIDDLE EAST AND AFRICA VITAMINS AND SUPPLEMENTS CURRENT AND FUTURE END USER ANALYSIS, 2025–2034, (USD MILLION)
FIGURE 37 NORTH AMERICA VITAMINS AND SUPPLEMENTS CURRENT AND FUTURE MARKET VOLUME SHARE REGIONAL ANALYSIS, 2025–2034, (USD MILLION)
FIGURE 38 U.S. VITAMINS AND SUPPLEMENTS CURRENT AND FUTURE TYPE ANALYSIS, 2025–2034, (USD MILLION)
FIGURE 39 U.S. VITAMINS AND SUPPLEMENTS CURRENT AND FUTURE END USER ANALYSIS, 2025–2034, (USD MILLION)
FIGURE 40 CANADA VITAMINS AND SUPPLEMENTS CURRENT AND FUTURE TYPE ANALYSIS, 2025–2034, (USD MILLION)
FIGURE 41 CANADA VITAMINS AND SUPPLEMENTS CURRENT AND FUTURE END USER ANALYSIS, 2025–2034, (USD MILLION)
FIGURE 42 LATIN AMERICA VITAMINS AND SUPPLEMENTS CURRENT AND FUTURE MARKET VOLUME SHARE REGIONAL ANALYSIS, 2025–2034, (USD MILLION)
FIGURE 43 MEXICO VITAMINS AND SUPPLEMENTS CURRENT AND FUTURE TYPE ANALYSIS, 2025–2034, (USD MILLION)
FIGURE 44 MEXICO VITAMINS AND SUPPLEMENTS CURRENT AND FUTURE END USER ANALYSIS, 2025–2034, (USD MILLION)
FIGURE 45 BRAZIL VITAMINS AND SUPPLEMENTS CURRENT AND FUTURE TYPE ANALYSIS, 2025–2034, (USD MILLION)
FIGURE 46 BRAZIL VITAMINS AND SUPPLEMENTS CURRENT AND FUTURE END USER ANALYSIS, 2025–2034, (USD MILLION)
FIGURE 47 ARGENTINA VITAMINS AND SUPPLEMENTS CURRENT AND FUTURE TYPE ANALYSIS, 2025–2034, (USD MILLION)
FIGURE 48 ARGENTINA VITAMINS AND SUPPLEMENTS CURRENT AND FUTURE END USER ANALYSIS, 2025–2034, (USD MILLION)
FIGURE 49 COLUMBIA VITAMINS AND SUPPLEMENTS CURRENT AND FUTURE TYPE ANALYSIS, 2025–2034, (USD MILLION)
FIGURE 50 COLUMBIA VITAMINS AND SUPPLEMENTS CURRENT AND FUTURE END USER ANALYSIS, 2025–2034, (USD MILLION)
FIGURE 51 REST OF LATIN AMERICA VITAMINS AND SUPPLEMENTS CURRENT AND FUTURE TYPE ANALYSIS, 2025–2034, (USD MILLION)
FIGURE 52 REST OF LATIN AMERICA VITAMINS AND SUPPLEMENTS CURRENT AND FUTURE END USER ANALYSIS, 2025–2034, (USD MILLION)
FIGURE 53 EASTERN EUROPE VITAMINS AND SUPPLEMENTS CURRENT AND FUTURE MARKET VOLUME SHARE REGIONAL ANALYSIS, 2025–2034, (USD MILLION)
FIGURE 54 POLAND VITAMINS AND SUPPLEMENTS CURRENT AND FUTURE TYPE ANALYSIS, 2025–2034, (USD MILLION)
FIGURE 55 POLAND VITAMINS AND SUPPLEMENTS CURRENT AND FUTURE END USER ANALYSIS, 2025–2034, (USD MILLION)
FIGURE 56 RUSSIA VITAMINS AND SUPPLEMENTS CURRENT AND FUTURE TYPE ANALYSIS, 2025–2034, (USD MILLION)
FIGURE 57 RUSSIA VITAMINS AND SUPPLEMENTS CURRENT AND FUTURE END USER ANALYSIS, 2025–2034, (USD MILLION)
FIGURE 58 CZECH REPUBLIC VITAMINS AND SUPPLEMENTS CURRENT AND FUTURE TYPE ANALYSIS, 2025–2034, (USD MILLION)
FIGURE 59 CZECH REPUBLIC VITAMINS AND SUPPLEMENTS CURRENT AND FUTURE END USER ANALYSIS, 2025–2034, (USD MILLION)
FIGURE 60 ROMANIA VITAMINS AND SUPPLEMENTS CURRENT AND FUTURE TYPE ANALYSIS, 2025–2034, (USD MILLION)
FIGURE 61 ROMANIA VITAMINS AND SUPPLEMENTS CURRENT AND FUTURE END USER ANALYSIS, 2025–2034, (USD MILLION)
FIGURE 62 REST OF EASTERN EUROPE VITAMINS AND SUPPLEMENTS CURRENT AND FUTURE TYPE ANALYSIS, 2025–2034, (USD MILLION)
FIGURE 63 REST OF EASTERN EUROPE VITAMINS AND SUPPLEMENTS CURRENT AND FUTURE END USER ANALYSIS, 2025–2034, (USD MILLION)
FIGURE 64 WESTERN EUROPE VITAMINS AND SUPPLEMENTS CURRENT AND FUTURE MARKET VOLUME SHARE REGIONAL ANALYSIS, 2025–2034, (USD MILLION)
FIGURE 65 GERMANY VITAMINS AND SUPPLEMENTS CURRENT AND FUTURE TYPE ANALYSIS, 2025–2034, (USD MILLION)
FIGURE 66 GERMANY VITAMINS AND SUPPLEMENTS CURRENT AND FUTURE END USER ANALYSIS, 2025–2034, (USD MILLION)
FIGURE 67 FRANCE VITAMINS AND SUPPLEMENTS CURRENT AND FUTURE TYPE ANALYSIS, 2025–2034, (USD MILLION)
FIGURE 68 FRANCE VITAMINS AND SUPPLEMENTS CURRENT AND FUTURE END USER ANALYSIS, 2025–2034, (USD MILLION)
FIGURE 69 UK VITAMINS AND SUPPLEMENTS CURRENT AND FUTURE TYPE ANALYSIS, 2025–2034, (USD MILLION)
FIGURE 70 UK VITAMINS AND SUPPLEMENTS CURRENT AND FUTURE END USER ANALYSIS, 2025–2034, (USD MILLION)
FIGURE 71 SPAIN VITAMINS AND SUPPLEMENTS CURRENT AND FUTURE TYPE ANALYSIS, 2025–2034, (USD MILLION)
FIGURE 72 SPAIN VITAMINS AND SUPPLEMENTS CURRENT AND FUTURE END USER ANALYSIS, 2025–2034, (USD MILLION)
FIGURE 73 ITALY VITAMINS AND SUPPLEMENTS CURRENT AND FUTURE TYPE ANALYSIS, 2025–2034, (USD MILLION)
FIGURE 74 ITALY VITAMINS AND SUPPLEMENTS CURRENT AND FUTURE END USER ANALYSIS, 2025–2034, (USD MILLION)
FIGURE 75 REST OF WESTERN EUROPE VITAMINS AND SUPPLEMENTS CURRENT AND FUTURE TYPE ANALYSIS, 2025–2034, (USD MILLION)
FIGURE 76 REST OF WESTERN EUROPE VITAMINS AND SUPPLEMENTS CURRENT AND FUTURE END USER ANALYSIS, 2025–2034, (USD MILLION)
FIGURE 77 EAST ASIA AND PACIFIC VITAMINS AND SUPPLEMENTS CURRENT AND FUTURE MARKET VOLUME SHARE REGIONAL ANALYSIS, 2025–2034, (USD MILLION)
FIGURE 78 CHINA VITAMINS AND SUPPLEMENTS CURRENT AND FUTURE TYPE ANALYSIS, 2025–2034, (USD MILLION)
FIGURE 79 CHINA VITAMINS AND SUPPLEMENTS CURRENT AND FUTURE END USER ANALYSIS, 2025–2034, (USD MILLION)
FIGURE 80 JAPAN VITAMINS AND SUPPLEMENTS CURRENT AND FUTURE TYPE ANALYSIS, 2025–2034, (USD MILLION)
FIGURE 81 JAPAN VITAMINS AND SUPPLEMENTS CURRENT AND FUTURE END USER ANALYSIS, 2025–2034, (USD MILLION)
FIGURE 82 AUSTRALIA VITAMINS AND SUPPLEMENTS CURRENT AND FUTURE TYPE ANALYSIS, 2025–2034, (USD MILLION)
FIGURE 83 AUSTRALIA VITAMINS AND SUPPLEMENTS CURRENT AND FUTURE END USER ANALYSIS, 2025–2034, (USD MILLION)
FIGURE 84 CAMBODIA VITAMINS AND SUPPLEMENTS CURRENT AND FUTURE TYPE ANALYSIS, 2025–2034, (USD MILLION)
FIGURE 85 CAMBODIA VITAMINS AND SUPPLEMENTS CURRENT AND FUTURE END USER ANALYSIS, 2025–2034, (USD MILLION)
FIGURE 86 FIJI VITAMINS AND SUPPLEMENTS CURRENT AND FUTURE TYPE ANALYSIS, 2025–2034, (USD MILLION)
FIGURE 87 FIJI VITAMINS AND SUPPLEMENTS CURRENT AND FUTURE END USER ANALYSIS, 2025–2034, (USD MILLION)
FIGURE 88 INDONESIA VITAMINS AND SUPPLEMENTS CURRENT AND FUTURE TYPE ANALYSIS, 2025–2034, (USD MILLION)
FIGURE 89 INDONESIA VITAMINS AND SUPPLEMENTS CURRENT AND FUTURE END USER ANALYSIS, 2025–2034, (USD MILLION)
FIGURE 90 SOUTH KOREA VITAMINS AND SUPPLEMENTS CURRENT AND FUTURE TYPE ANALYSIS, 2025–2034, (USD MILLION)
FIGURE 91 SOUTH KOREA VITAMINS AND SUPPLEMENTS CURRENT AND FUTURE END USER ANALYSIS, 2025–2034, (USD MILLION)
FIGURE 92 REST OF EAST ASIA AND PACIFIC VITAMINS AND SUPPLEMENTS CURRENT AND FUTURE TYPE ANALYSIS, 2025–2034, (USD MILLION)
FIGURE 93 REST OF EAST ASIA AND PACIFIC VITAMINS AND SUPPLEMENTS CURRENT AND FUTURE END USER ANALYSIS, 2025–2034, (USD MILLION)
FIGURE 94 SEA AND SOUTH ASIA VITAMINS AND SUPPLEMENTS CURRENT AND FUTURE MARKET VOLUME SHARE REGIONAL ANALYSIS, 2025–2034, (USD MILLION)
FIGURE 95 BANGLADESH VITAMINS AND SUPPLEMENTS CURRENT AND FUTURE TYPE ANALYSIS, 2025–2034, (USD MILLION)
FIGURE 96 BANGLADESH VITAMINS AND SUPPLEMENTS CURRENT AND FUTURE END USER ANALYSIS, 2025–2034, (USD MILLION)
FIGURE 97 NEW ZEALAND VITAMINS AND SUPPLEMENTS CURRENT AND FUTURE TYPE ANALYSIS, 2025–2034, (USD MILLION)
FIGURE 98 NEW ZEALAND VITAMINS AND SUPPLEMENTS CURRENT AND FUTURE END USER ANALYSIS, 2025–2034, (USD MILLION)
FIGURE 99 INDIA VITAMINS AND SUPPLEMENTS CURRENT AND FUTURE TYPE ANALYSIS, 2025–2034, (USD MILLION)
FIGURE 100 INDIA VITAMINS AND SUPPLEMENTS CURRENT AND FUTURE END USER ANALYSIS, 2025–2034, (USD MILLION)
FIGURE 101 SINGAPORE VITAMINS AND SUPPLEMENTS CURRENT AND FUTURE TYPE ANALYSIS, 2025–2034, (USD MILLION)
FIGURE 102 SINGAPORE VITAMINS AND SUPPLEMENTS CURRENT AND FUTURE END USER ANALYSIS, 2025–2034, (USD MILLION)
FIGURE 103 THAILAND VITAMINS AND SUPPLEMENTS CURRENT AND FUTURE TYPE ANALYSIS, 2025–2034, (USD MILLION)
FIGURE 104 THAILAND VITAMINS AND SUPPLEMENTS CURRENT AND FUTURE END USER ANALYSIS, 2025–2034, (USD MILLION)
FIGURE 105 TAIWAN VITAMINS AND SUPPLEMENTS CURRENT AND FUTURE TYPE ANALYSIS, 2025–2034, (USD MILLION)
FIGURE 106 TAIWAN VITAMINS AND SUPPLEMENTS CURRENT AND FUTURE END USER ANALYSIS, 2025–2034, (USD MILLION)
FIGURE 107 MALAYSIA VITAMINS AND SUPPLEMENTS CURRENT AND FUTURE TYPE ANALYSIS, 2025–2034, (USD MILLION)
FIGURE 108 MALAYSIA VITAMINS AND SUPPLEMENTS CURRENT AND FUTURE END USER ANALYSIS, 2025–2034, (USD MILLION)
FIGURE 109 REST OF SEA AND SOUTH ASIA VITAMINS AND SUPPLEMENTS CURRENT AND FUTURE TYPE ANALYSIS, 2025–2034, (USD MILLION)
FIGURE 110 REST OF SEA AND SOUTH ASIA VITAMINS AND SUPPLEMENTS CURRENT AND FUTURE END USER ANALYSIS, 2025–2034, (USD MILLION)
FIGURE 111 MIDDLE EAST AND AFRICA VITAMINS AND SUPPLEMENTS CURRENT AND FUTURE MARKET VOLUME SHARE REGIONAL ANALYSIS, 2025–2034, (USD MILLION)
FIGURE 112 GCC COUNTRIES VITAMINS AND SUPPLEMENTS CURRENT AND FUTURE TYPE ANALYSIS, 2025–2034, (USD MILLION)
FIGURE 113 GCC COUNTRIES VITAMINS AND SUPPLEMENTS CURRENT AND FUTURE END USER ANALYSIS, 2025–2034, (USD MILLION)
FIGURE 114 SAUDI ARABIA VITAMINS AND SUPPLEMENTS CURRENT AND FUTURE TYPE ANALYSIS, 2025–2034, (USD MILLION)
FIGURE 115 SAUDI ARABIA VITAMINS AND SUPPLEMENTS CURRENT AND FUTURE END USER ANALYSIS, 2025–2034, (USD MILLION)
FIGURE 116 UAE VITAMINS AND SUPPLEMENTS CURRENT AND FUTURE TYPE ANALYSIS, 2025–2034, (USD MILLION)
FIGURE 117 UAE VITAMINS AND SUPPLEMENTS CURRENT AND FUTURE END USER ANALYSIS, 2025–2034, (USD MILLION)
FIGURE 118 BAHRAIN VITAMINS AND SUPPLEMENTS CURRENT AND FUTURE TYPE ANALYSIS, 2025–2034, (USD MILLION)
FIGURE 119 BAHRAIN VITAMINS AND SUPPLEMENTS CURRENT AND FUTURE END USER ANALYSIS, 2025–2034, (USD MILLION)
FIGURE 120 KUWAIT VITAMINS AND SUPPLEMENTS CURRENT AND FUTURE TYPE ANALYSIS, 2025–2034, (USD MILLION)
FIGURE 121 KUWAIT VITAMINS AND SUPPLEMENTS CURRENT AND FUTURE END USER ANALYSIS, 2025–2034, (USD MILLION)
FIGURE 122 OMAN VITAMINS AND SUPPLEMENTS CURRENT AND FUTURE TYPE ANALYSIS, 2025–2034, (USD MILLION)
FIGURE 123 OMAN VITAMINS AND SUPPLEMENTS CURRENT AND FUTURE END USER ANALYSIS, 2025–2034, (USD MILLION)
FIGURE 124 QATAR VITAMINS AND SUPPLEMENTS CURRENT AND FUTURE TYPE ANALYSIS, 2025–2034, (USD MILLION)
FIGURE 125 QATAR VITAMINS AND SUPPLEMENTS CURRENT AND FUTURE END USER ANALYSIS, 2025–2034, (USD MILLION)
FIGURE 126 EGYPT VITAMINS AND SUPPLEMENTS CURRENT AND FUTURE TYPE ANALYSIS, 2025–2034, (USD MILLION)
FIGURE 127 EGYPT VITAMINS AND SUPPLEMENTS CURRENT AND FUTURE END USER ANALYSIS, 2025–2034, (USD MILLION)
FIGURE 128 NIGERIA VITAMINS AND SUPPLEMENTS CURRENT AND FUTURE TYPE ANALYSIS, 2025–2034, (USD MILLION)
FIGURE 129 NIGERIA VITAMINS AND SUPPLEMENTS CURRENT AND FUTURE END USER ANALYSIS, 2025–2034, (USD MILLION)
FIGURE 130 SOUTH AFRICA VITAMINS AND SUPPLEMENTS CURRENT AND FUTURE TYPE ANALYSIS, 2025–2034, (USD MILLION)
FIGURE 131 SOUTH AFRICA VITAMINS AND SUPPLEMENTS CURRENT AND FUTURE END USER ANALYSIS, 2025–2034, (USD MILLION)
FIGURE 132 ISRAEL VITAMINS AND SUPPLEMENTS CURRENT AND FUTURE TYPE ANALYSIS, 2025–2034, (USD MILLION)
FIGURE 133 ISRAEL VITAMINS AND SUPPLEMENTS CURRENT AND FUTURE END USER ANALYSIS, 2025–2034, (USD MILLION)
FIGURE 134 REST OF MEA VITAMINS AND SUPPLEMENTS CURRENT AND FUTURE TYPE ANALYSIS, 2025–2034, (USD MILLION)
FIGURE 135 REST OF MEA VITAMINS AND SUPPLEMENTS CURRENT AND FUTURE END USER ANALYSIS, 2025–2034, (USD MILLION)
FIGURE 136 U. S. MARKET SHARE ANALYSIS BY TYPE (2024)
FIGURE 137 U. S. MARKET SHARE ANALYSIS BY END USER (2024)
FIGURE 138 CANADA MARKET SHARE ANALYSIS BY TYPE (2024)
FIGURE 139 CANADA MARKET SHARE ANALYSIS BY END USER (2024)
FIGURE 140 MEXICO MARKET SHARE ANALYSIS BY TYPE (2024)
FIGURE 141 MEXICO MARKET SHARE ANALYSIS BY END USER (2024)
FIGURE 142 CHINA MARKET SHARE ANALYSIS BY TYPE (2024)
FIGURE 143 CHINA MARKET SHARE ANALYSIS BY END USER (2024)
FIGURE 144 JAPAN MARKET SHARE ANALYSIS BY TYPE (2024)
FIGURE 145 JAPAN MARKET SHARE ANALYSIS BY END USER (2024)
FIGURE 146 INDIA MARKET SHARE ANALYSIS BY TYPE (2024)
FIGURE 147 INDIA MARKET SHARE ANALYSIS BY END USER (2024)
FIGURE 148 SOUTH KOREA MARKET SHARE ANALYSIS BY TYPE (2024)
FIGURE 149 SOUTH KOREA MARKET SHARE ANALYSIS BY END USER (2024)
FIGURE 150 SAUDI ARABIA MARKET SHARE ANALYSIS BY TYPE (2024)
FIGURE 151 SAUDI ARABIA MARKET SHARE ANALYSIS BY END USER (2024)
FIGURE 152 UAE MARKET SHARE ANALYSIS BY TYPE (2024)
FIGURE 153 UAE MARKET SHARE ANALYSIS BY END USER (2024)
FIGURE 154 EGYPT MARKET SHARE ANALYSIS BY TYPE (2024)
FIGURE 155 EGYPT MARKET SHARE ANALYSIS BY END USER (2024)
FIGURE 156 NIGERIA MARKET SHARE ANALYSIS BY TYPE (2024)
FIGURE 157 NIGERIA MARKET SHARE ANALYSIS BY END USER (2024)
FIGURE 158 SOUTH AFRICA MARKET SHARE ANALYSIS BY TYPE (2024)
FIGURE 159 SOUTH AFRICA MARKET SHARE ANALYSIS BY END USER (2024)
FIGURE 160 GERMANY MARKET SHARE ANALYSIS BY TYPE (2024)
FIGURE 161 GERMANY MARKET SHARE ANALYSIS BY END USER (2024)
FIGURE 162 FRANCE MARKET SHARE ANALYSIS BY TYPE (2024)
FIGURE 163 FRANCE MARKET SHARE ANALYSIS BY END USER (2024)
FIGURE 164 UK MARKET SHARE ANALYSIS BY TYPE (2024)
FIGURE 165 UK MARKET SHARE ANALYSIS BY END USER (2024)
FIGURE 166 SPAIN MARKET SHARE ANALYSIS BY TYPE (2024)
FIGURE 167 SPAIN MARKET SHARE ANALYSIS BY END USER (2024)
FIGURE 168 ITALY MARKET SHARE ANALYSIS BY TYPE (2024)
FIGURE 169 ITALY MARKET SHARE ANALYSIS BY END USER (2024)
FIGURE 170 BRAZIL MARKET SHARE ANALYSIS BY TYPE (2024)
FIGURE 171 BRAZIL MARKET SHARE ANALYSIS BY END USER (2024)
FIGURE 172 ARGENTINA MARKET SHARE ANALYSIS BY TYPE (2024)
FIGURE 173 ARGENTINA MARKET SHARE ANALYSIS BY END USER (2024)
FIGURE 174 COLUMBIA MARKET SHARE ANALYSIS BY TYPE (2024)
FIGURE 175 COLUMBIA MARKET SHARE ANALYSIS BY END USER (2024)
FIGURE 176 GLOBAL VITAMINS AND SUPPLEMENTS CURRENT AND FUTURE MARKET KEY COUNTRY LEVEL ANALYSIS, 2024–2034, (USD MILLION)
FIGURE 177 FINANCIAL OVERVIEW:
Key Players Analysis
Pfizer Inc.: Pfizer Inc. is one of the most prominent global players in the vitamins and supplements market, offering clinically proven products under trusted brands such as Centrum and Caltrate. The company’s competitive advantage lies in its extensive research capabilities, strong brand equity, and wide distribution network. Pfizer continues to focus on innovation through advanced nutrient formulations and personalized supplementation solutions. With strategic global partnerships and e-commerce integration, Pfizer strengthens its consumer base across emerging and developed economies.
Amway Corp.: Amway Corporation, through its flagship brand Nutrilite, remains a global leader in plant-based and organic nutritional supplements. The company is known for its vertically integrated supply chain, controlling every stage from organic farming to manufacturing. Amway emphasizes clean-label, phytonutrient-rich products that cater to holistic health and wellness. The company’s global distribution through direct selling and digital retail channels ensures consistent market reach. With ongoing R&D investments and expansion into AI-driven personalized nutrition, Amway continues to drive innovation in preventive healthcare and wellness supplements.
Bayer AG: Bayer AG commands a significant share of the global vitamins and supplements market through its brands One A Day, Berocca, and Redoxon. The company leverages advanced nutritional science and medical expertise to deliver high-quality, clinically validated products. Bayer’s growth strategy includes mergers, innovation in effervescent and gummy formulations, and integration with digital wellness platforms. Its strong European and North American presence, combined with growing e-commerce sales, positions Bayer as a major contributor to market expansion, particularly in personalized and functional nutrition.
Herbalife Nutrition Ltd.: Herbalife Nutrition Ltd. is a global leader in dietary and sports nutrition supplements. The company focuses on high-quality, science-backed products designed for weight management, wellness, and energy optimization. Herbalife’s global business model relies on community-based direct selling and digital marketing initiatives. It continues to expand its product portfolio with herbal, plant-based, and protein-rich offerings. Through strong customer engagement and sustainability initiatives, Herbalife maintains a robust global brand image and a growing consumer base across the Americas, Europe, and Asia-Pacific regions.
Abbott Laboratories: Abbott Laboratories is a major player in the vitamins and supplements industry, with strong consumer trust in its Ensure, Pediasure, and Similac product lines. The company focuses on nutrition solutions across all age groups, from infants to the elderly. Abbott’s innovation-driven approach, grounded in clinical nutrition research, sets it apart in the health and wellness market. Its global manufacturing facilities, extensive retail network, and expansion into digital health tracking tools support consistent growth. Abbott continues to lead in quality assurance and diversification within functional and medical-grade nutritional supplements.
Market Key Players
Pfizer Inc.
Amway Corp.
Bayer AG
Herbalife Nutrition Ltd.
Abbott Laboratories
Nature’s Bounty Co.
Glanbia PLC
GNC Holdings, LLC
Nestlé Health Science
NOW Foods
NutraScience Labs
DSM Nutritional Products
Himalaya Wellness
Unilever PLC (Horlicks, Olly)
Church & Dwight Co., Inc.
Drivers
Growing Health Awareness and Preventive Healthcare
The growth of the global vitamins and supplements market is primarily driven by increasing health awareness and the shift toward preventive healthcare. Consumers are becoming more proactive in maintaining immunity and overall wellness through nutritional supplementation. The rising prevalence of chronic diseases, expanding geriatric population, and growing interest in fitness and mental health further fuel demand. Additionally, technological advancements in supplement formulation, such as nanoencapsulation and bioavailability enhancement, are improving product efficacy. The surge in e-commerce sales, personalized nutrition plans, and the popularity of plant-based, organic supplements are also significant contributors to market expansion.
Restraints
Regulatory Hurdles and Product Standardization Issues
Despite robust growth potential, the market faces challenges such as stringent regulatory frameworks and product standardization issues across regions. Variations in labeling, testing, and approval processes often delay product launches. Moreover, the market is highly fragmented, leading to competition from counterfeit or low-quality products that erode consumer trust. Rising raw material costs, particularly for natural and herbal ingredients, can impact profit margins. In some regions, limited awareness of proper dosage and potential side effects of overconsumption also hinders market adoption. Ensuring scientific validation and transparency remains a critical challenge for manufacturers aiming to maintain credibility and consumer loyalty.
Opportunities
Personalized Nutrition and Emerging Market Expansion
The vitamins and supplements market presents vast opportunities through innovation in functional and personalized nutrition. Advances in AI-driven health tracking, genetic testing, and microbiome analysis are enabling customized supplement solutions tailored to individual needs. The growing demand for clean-label, vegan, and allergen-free formulations offers a strong growth avenue for manufacturers. Expansion into emerging economies such as India, China, and Brazil, where disposable incomes and health consciousness are rising, provides significant untapped potential. Additionally, partnerships between supplement brands and digital health platforms can boost engagement, while sustainable sourcing and eco-friendly packaging create long-term competitive advantages.
Trends
Plant-Based, Gummy Supplements, and Digital Integration
The industry is witnessing strong trends toward plant-based and organic supplements, aligning with global sustainability goals and consumer demand for natural ingredients. Gummy vitamins, functional beverages, and fortified foods are rapidly gaining popularity among millennials and children for their taste and convenience. There is also a noticeable shift toward online direct-to-consumer sales models, enabling brands to offer subscription services and personalized recommendations. Integration of AI, IoT, and wearable health tech in nutrition monitoring is shaping the next phase of market evolution. Furthermore, strategic mergers and acquisitions are consolidating market positions and expanding global product portfolios in the vitamins and supplements sector.
Recent Developments
June 2025: Nestlé Health Science launched a new line of personalized vitamin packs, integrating AI-driven health assessments.
May 2025: Bayer AG introduced plant-based multivitamin gummies targeting vegan consumers in North America and Europe.
April 2025: Herbalife Nutrition expanded its e-commerce platform in Southeast Asia, offering direct-to-consumer delivery and virtual wellness coaching.
March 2025: Amway announced a partnership with a leading wearable tech company to offer supplement recommendations based on real-time health data.