Global VOC’s Rotor Market Size, Share & Analysis By Material (Zeolite, Carbon), By Application (Automotive, Chemical, Semi-conductor), By End-User Industry Regions & Key Players – Environmental Regulations & Forecast 2025–2034
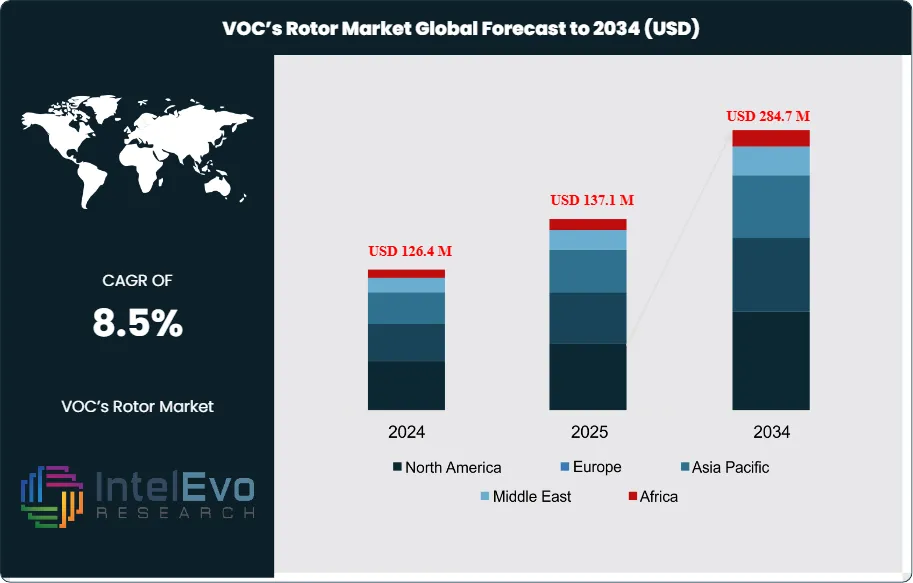
The Volatile Organic Compounds (VOCs) Rotors market is valued at USD 126.4 million in 2024 and is projected to reach approximately USD 284.7 million by 2034, reflecting a solid CAGR of about 8.5% during 2025–2034. Stricter global emission norms, rising industrial automation, and rapid adoption of energy-efficient air treatment systems are accelerating demand across chemical, electronics, and automotive manufacturing sectors. As clean-air compliance becomes a core operational mandate, industries are increasingly shifting from traditional abatement systems to high-performance rotor technologies. With sustainability reporting and ESG commitments gaining momentum, VOC rotor installations are expected to surge across both advanced and emerging economies.
Over the past decade, the VOC rotors market has grown steadily due to increasing regulatory scrutiny, rising awareness of industrial emissions, and the expanding role of air quality management across multiple industries. Historically rooted in applications within the chemical and automotive sectors, VOC rotors have become essential for mitigating emissions that contribute to ozone layer depletion and poor indoor air quality. With governments tightening emission standards, particularly in North America, Europe, and parts of Asia, industrial operators are investing in specialized air purification systems. Dehumidifiers equipped with VOC rotors now represent a critical component in maintaining compliance, reducing environmental impact, and ensuring occupational safety.
Demand is further fueled by heightened public awareness of air pollution and its health impacts. Consumer pressure and corporate sustainability commitments have accelerated the shift toward emission monitoring and abatement solutions. On the supply side, manufacturers are responding with enhanced materials, such as high-silica zeolite and activated carbon substrates, which offer better adsorption efficiency and longer operational lifespans. Zeolite-based honeycomb structures remain the industry standard due to their durability and low regeneration energy requirements.
Technological development continues to shape the adoption curve. Bactericidal VOC rotor technologies and systems capable of targeting a broader spectrum of airborne contaminants are gaining traction in highly regulated sectors such as food processing and pharmaceuticals. As a result, VOC rotors are now increasingly embedded in environmental control systems beyond their traditional industrial base.
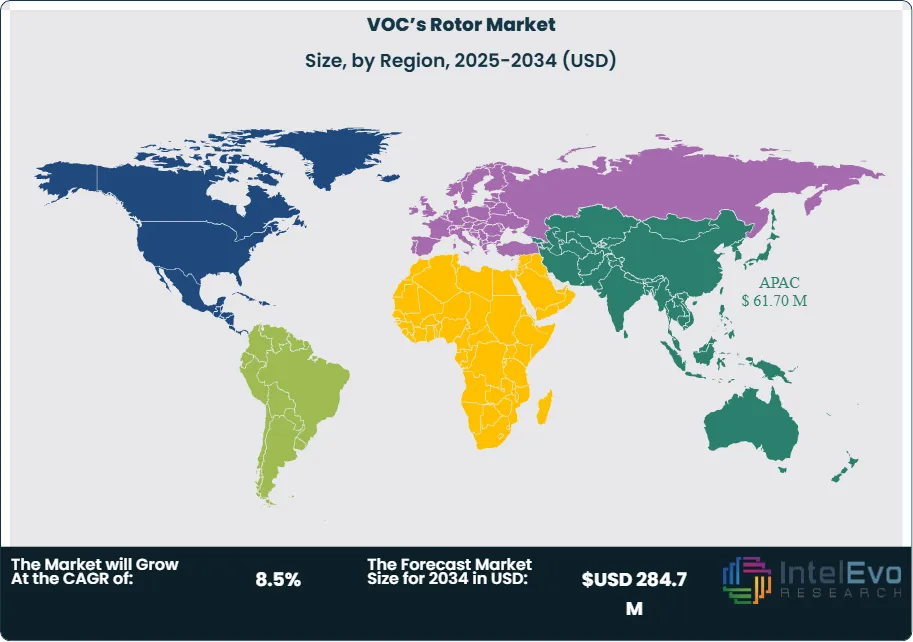
Regionally, Asia Pacific remains the fastest-growing market, driven by rapid industrialization in China, India, and Southeast Asia. Europe and North America lead in terms of technology adoption and regulatory enforcement, making them lucrative zones for advanced VOC rotor systems. Meanwhile, emerging economies in Latin America and the Middle East are becoming investment hotspots, as environmental compliance moves higher on national agendas.
The global VOC rotors market presents a clear growth trajectory, shaped by policy shifts, technological progress, and evolving end-user demands. Market players that can align product development with stringent environmental targets will be best positioned to capture long-term value.
Key Takeaways
Market Growth: The global VOC rotor market was valued at USD 126.4 million in 2024 and is projected to reach USD 284.7 million by 2034, registering a CAGR of 8.5% over the forecast period. Growth is driven by tightening emission norms, rising environmental awareness, and increasing demand for air purification across industrial sectors.
Product Type: Zeolite-based VOC rotors dominate the market, accounting for over 60% of global revenue in 2024 due to their high thermal stability, regeneration efficiency, and longer operational lifespan compared to activated carbon variants.
End Use Industry: The automotive and chemical sectors collectively represented more than 55% of VOC rotor demand in 2024. These industries face stringent air emission regulations, driving continuous investment in air treatment systems.
Driver: Rising environmental regulation is a primary growth driver. In Europe, the Industrial Emissions Directive (IED) and in the U.S., the EPA’s National Emission Standards for Hazardous Air Pollutants (NESHAP) mandate VOC control systems in industrial facilities.
Restraint: High initial capital expenditure limits adoption among small and medium enterprises. Installation of a VOC rotor-based system can range from US$50,000 to US$500,000 depending on capacity, deterring entry in cost-sensitive markets.
Opportunity: The pharmaceutical and food processing industries offer untapped potential, with the segment expected to grow at a CAGR of 8.5% through 2028. Demand is rising for sterilized air environments and emission control in these sectors.
Trend: Manufacturers are integrating bactericidal coatings and automation-enabled monitoring systems into VOC rotors. Companies like Seibu Giken and Munters are investing in hybrid solutions that combine rotor technology with AI-based air quality diagnostics.
Regional Analysis: Asia Pacific leads in volume growth, driven by industrial expansion in China and India, and is expected to grow at a CAGR above 8% through 2028. Europe and North America remain high-value markets due to stringent regulatory frameworks and high technology adoption rates.
Type Analysis
The VOC rotor market is primarily segmented into zeolite-based and activated carbon-based types, with zeolite rotors commanding the majority share in 2025. These systems are preferred for their high thermal stability, long operational life, and low energy consumption during regeneration. Zeolite rotors now account for over 65% of total market revenue, largely due to their use in industries where high-temperature resistance and consistent performance are essential. They also perform better in high-humidity environments, making them suitable for regions with varied climate conditions.
In contrast, activated carbon rotors continue to serve applications with lower temperature requirements and cost sensitivity. Though less durable, they are still widely adopted in small-scale facilities, especially in developing markets. However, their market share is gradually declining as more end users shift toward long-term operational efficiency. Looking ahead, the dominance of zeolite-based systems is expected to grow further, particularly in industries with stringent emission controls such as pharmaceuticals and food processing.
Application Analysis
VOC rotors are increasingly integrated across automotive, chemical, and semiconductor manufacturing processes, where emissions control is mandatory. In 2025, the chemical sector holds the largest application share at approximately 42% of global demand. These facilities generate significant volumes of VOCs during production, necessitating high-capacity rotor systems for compliance with tightening emission regulations across regions such as the EU and North America.
The automotive industry remains a key contributor to market demand, especially across coating and painting operations where solvent-based VOCs are released. As vehicle production rebounds in 2025, demand for VOC abatement in automotive paint shops is expected to grow at a 6.8% CAGR through 2030. Meanwhile, the semiconductor sector is emerging as a high-growth segment. Cleanroom environments and emission restrictions in electronics manufacturing are prompting adoption of high-efficiency rotors, particularly in East Asia.
End-Use Analysis
VOC rotors are deployed across residential, commercial, and industrial buildings, with industrial applications accounting for over 70% of total installations in 2025. This dominance is driven by the need for continuous VOC control in manufacturing plants, processing units, and warehouses. Industrial users favor zeolite-based systems for their performance reliability and cost efficiency over time.
While commercial buildings, such as laboratories and large office complexes, have historically lagged in VOC rotor adoption, new building codes focused on indoor air quality are prompting gradual uptake. In contrast, residential applications remain limited to niche areas, such as high-end housing or residential zones near industrial clusters. However, government-led air quality initiatives in densely populated cities may gradually expand usage in the residential segment over the forecast period.
Regional Analysis
Asia Pacific leads global VOC rotor demand, accounting for more than 45% of global revenue in 2025, driven by industrial growth in China, India, and South Korea. Rapid urbanization and strict air pollution regulations in these countries are accelerating installation of VOC control technologies. China’s ongoing enforcement of its Blue Sky Protection Plan continues to push chemical and electronics manufacturers toward compliant air treatment systems.
Europe and North America remain key high-value markets. The EU's Industrial Emissions Directive and the U.S. Clean Air Act both mandate stringent VOC limits, spurring steady demand across automotive, chemical, and semiconductor facilities. Meanwhile, Latin America and the Middle East & Africa are in early adoption stages. Growth in these regions is tied to increasing industrialization and rising environmental awareness, particularly in Brazil, the UAE, and Saudi Arabia. As regulatory frameworks mature, these regions are likely to present substantial long-term opportunities.
By Material Type (Zeolite, Activated carbon), By Application (Automotive, Chemical, Semi-conductor)
Research Methodology
Primary Research- 100 Interviews of Stakeholders
Secondary Research
Desk Research
Regional scope
North America (United States, Canada, Mexico)
Latin America (Brazil, Argentina, Columbia)
East Asia And Pacific (China, Japan, South Korea, Australia, Cambodia, Fiji, Indonesia)
Sea And South Asia (India, Singapore, Thailand, Taiwan, Malaysia)
Eastern Europe (Poland, Russia, Czech Republic, Romania)
Western Europe (Germany, U.K., France, Spain, Itlay)
Middle East & Africa (GCC Countries, Egypt, Nigeria, South Africa, Israel)
Competitive Landscape
Seibu Giken Co. Ltd., Gulf Coast Environmental Systems (GCES), Munters Group AB, Nichias Corporation
Customization Scope
Customization for segments, region/country-level will be provided. Moreover, additional customization can be done based on the requirements.
Pricing and Purchase Options
Avail customized purchase options to meet your exact research needs. We have three licenses to opt for: Single User License, Multi-User License (Up to 5 Users), Corporate Use License (Unlimited User and Printable PDF).
TABLE OF CONTENTS
1. EXECUTIVE SUMMARY
1.1. MARKET SNAPSHOT
1.2. KEY FINDINGS & INSIGHTS
1.3. ANALYST RECOMMENDATIONS
1.4. FUTURE OUTLOOK
2. RESEARCH METHODOLOGY
2.1. MARKET DEFINITION & SCOPE
2.2. RESEARCH OBJECTIVES: PRIMARY & SECONDARY DATA SOURCES
2.3. DATA COLLECTION SOURCES
2.3.1. COVERAGE OF 100+ PRIMARY RESEARCH/CONSULTATION CALLS WITH INDUSTRY STAKEHOLDERS
FIGURE 17 NORTH AMERICA VOC’S ROTOR CURRENT AND FUTURE TYPE ANALYSIS, 2025–2034, (USD MILLION)
FIGURE 18 NORTH AMERICA VOC’S ROTOR CURRENT AND FUTURE END USER ANALYSIS, 2025–2034, (USD MILLION)
FIGURE 19 MARKET SHARE BY COUNTRY
FIGURE 20 LATIN AMERICA VOC’S ROTOR CURRENT AND FUTURE TYPE ANALYSIS, 2025–2034, (USD MILLION)
FIGURE 21 LATIN AMERICA VOC’S ROTOR CURRENT AND FUTURE END USER ANALYSIS, 2025–2034, (USD MILLION)
FIGURE 22 MARKET SHARE BY COUNTRY
FIGURE 23 EASTERN EUROPE VOC’S ROTOR CURRENT AND FUTURE TYPE ANALYSIS, 2025–2034, (USD MILLION)
FIGURE 24 EASTERN EUROPE VOC’S ROTOR CURRENT AND FUTURE END USER ANALYSIS, 2025–2034, (USD MILLION)
FIGURE 25 MARKET SHARE BY COUNTRY
FIGURE 26 WESTERN EUROPE VOC’S ROTOR CURRENT AND FUTURE TYPE ANALYSIS, 2025–2034, (USD MILLION)
FIGURE 27 WESTERN EUROPE VOC’S ROTOR CURRENT AND FUTURE END USER ANALYSIS, 2025–2034, (USD MILLION)
FIGURE 28 MARKET SHARE BY COUNTRY
FIGURE 29 EAST ASIA AND PACIFIC VOC’S ROTOR CURRENT AND FUTURE TYPE ANALYSIS, 2025–2034, (USD MILLION)
FIGURE 30 EAST ASIA AND PACIFIC VOC’S ROTOR CURRENT AND FUTURE END USER ANALYSIS, 2025–2034, (USD MILLION)
FIGURE 31 MARKET SHARE BY COUNTRY
FIGURE 32 SEA AND SOUTH ASIA VOC’S ROTOR CURRENT AND FUTURE TYPE ANALYSIS, 2025–2034, (USD MILLION)
FIGURE 33 SEA AND SOUTH ASIA VOC’S ROTOR CURRENT AND FUTURE END USER ANALYSIS, 2025–2034, (USD MILLION)
FIGURE 34 MARKET SHARE BY COUNTRY
FIGURE 35 MIDDLE EAST AND AFRICA VOC’S ROTOR CURRENT AND FUTURE TYPE ANALYSIS, 2025–2034, (USD MILLION)
FIGURE 36 MIDDLE EAST AND AFRICA VOC’S ROTOR CURRENT AND FUTURE END USER ANALYSIS, 2025–2034, (USD MILLION)
FIGURE 37 NORTH AMERICA VOC’S ROTOR CURRENT AND FUTURE MARKET VOLUME SHARE REGIONAL ANALYSIS, 2025–2034, (USD MILLION)
FIGURE 38 U.S. VOC’S ROTOR CURRENT AND FUTURE TYPE ANALYSIS, 2025–2034, (USD MILLION)
FIGURE 39 U.S. VOC’S ROTOR CURRENT AND FUTURE END USER ANALYSIS, 2025–2034, (USD MILLION)
FIGURE 40 CANADA VOC’S ROTOR CURRENT AND FUTURE TYPE ANALYSIS, 2025–2034, (USD MILLION)
FIGURE 41 CANADA VOC’S ROTOR CURRENT AND FUTURE END USER ANALYSIS, 2025–2034, (USD MILLION)
FIGURE 42 LATIN AMERICA VOC’S ROTOR CURRENT AND FUTURE MARKET VOLUME SHARE REGIONAL ANALYSIS, 2025–2034, (USD MILLION)
FIGURE 43 MEXICO VOC’S ROTOR CURRENT AND FUTURE TYPE ANALYSIS, 2025–2034, (USD MILLION)
FIGURE 44 MEXICO VOC’S ROTOR CURRENT AND FUTURE END USER ANALYSIS, 2025–2034, (USD MILLION)
FIGURE 45 BRAZIL VOC’S ROTOR CURRENT AND FUTURE TYPE ANALYSIS, 2025–2034, (USD MILLION)
FIGURE 46 BRAZIL VOC’S ROTOR CURRENT AND FUTURE END USER ANALYSIS, 2025–2034, (USD MILLION)
FIGURE 47 ARGENTINA VOC’S ROTOR CURRENT AND FUTURE TYPE ANALYSIS, 2025–2034, (USD MILLION)
FIGURE 48 ARGENTINA VOC’S ROTOR CURRENT AND FUTURE END USER ANALYSIS, 2025–2034, (USD MILLION)
FIGURE 49 COLUMBIA VOC’S ROTOR CURRENT AND FUTURE TYPE ANALYSIS, 2025–2034, (USD MILLION)
FIGURE 50 COLUMBIA VOC’S ROTOR CURRENT AND FUTURE END USER ANALYSIS, 2025–2034, (USD MILLION)
FIGURE 51 REST OF LATIN AMERICA VOC’S ROTOR CURRENT AND FUTURE TYPE ANALYSIS, 2025–2034, (USD MILLION)
FIGURE 52 REST OF LATIN AMERICA VOC’S ROTOR CURRENT AND FUTURE END USER ANALYSIS, 2025–2034, (USD MILLION)
FIGURE 53 EASTERN EUROPE VOC’S ROTOR CURRENT AND FUTURE MARKET VOLUME SHARE REGIONAL ANALYSIS, 2025–2034, (USD MILLION)
FIGURE 54 POLAND VOC’S ROTOR CURRENT AND FUTURE TYPE ANALYSIS, 2025–2034, (USD MILLION)
FIGURE 55 POLAND VOC’S ROTOR CURRENT AND FUTURE END USER ANALYSIS, 2025–2034, (USD MILLION)
FIGURE 56 RUSSIA VOC’S ROTOR CURRENT AND FUTURE TYPE ANALYSIS, 2025–2034, (USD MILLION)
FIGURE 57 RUSSIA VOC’S ROTOR CURRENT AND FUTURE END USER ANALYSIS, 2025–2034, (USD MILLION)
FIGURE 58 CZECH REPUBLIC VOC’S ROTOR CURRENT AND FUTURE TYPE ANALYSIS, 2025–2034, (USD MILLION)
FIGURE 59 CZECH REPUBLIC VOC’S ROTOR CURRENT AND FUTURE END USER ANALYSIS, 2025–2034, (USD MILLION)
FIGURE 60 ROMANIA VOC’S ROTOR CURRENT AND FUTURE TYPE ANALYSIS, 2025–2034, (USD MILLION)
FIGURE 61 ROMANIA VOC’S ROTOR CURRENT AND FUTURE END USER ANALYSIS, 2025–2034, (USD MILLION)
FIGURE 62 REST OF EASTERN EUROPE VOC’S ROTOR CURRENT AND FUTURE TYPE ANALYSIS, 2025–2034, (USD MILLION)
FIGURE 63 REST OF EASTERN EUROPE VOC’S ROTOR CURRENT AND FUTURE END USER ANALYSIS, 2025–2034, (USD MILLION)
FIGURE 64 WESTERN EUROPE VOC’S ROTOR CURRENT AND FUTURE MARKET VOLUME SHARE REGIONAL ANALYSIS, 2025–2034, (USD MILLION)
FIGURE 65 GERMANY VOC’S ROTOR CURRENT AND FUTURE TYPE ANALYSIS, 2025–2034, (USD MILLION)
FIGURE 66 GERMANY VOC’S ROTOR CURRENT AND FUTURE END USER ANALYSIS, 2025–2034, (USD MILLION)
FIGURE 67 FRANCE VOC’S ROTOR CURRENT AND FUTURE TYPE ANALYSIS, 2025–2034, (USD MILLION)
FIGURE 68 FRANCE VOC’S ROTOR CURRENT AND FUTURE END USER ANALYSIS, 2025–2034, (USD MILLION)
FIGURE 69 UK VOC’S ROTOR CURRENT AND FUTURE TYPE ANALYSIS, 2025–2034, (USD MILLION)
FIGURE 70 UK VOC’S ROTOR CURRENT AND FUTURE END USER ANALYSIS, 2025–2034, (USD MILLION)
FIGURE 71 SPAIN VOC’S ROTOR CURRENT AND FUTURE TYPE ANALYSIS, 2025–2034, (USD MILLION)
FIGURE 72 SPAIN VOC’S ROTOR CURRENT AND FUTURE END USER ANALYSIS, 2025–2034, (USD MILLION)
FIGURE 73 ITALY VOC’S ROTOR CURRENT AND FUTURE TYPE ANALYSIS, 2025–2034, (USD MILLION)
FIGURE 74 ITALY VOC’S ROTOR CURRENT AND FUTURE END USER ANALYSIS, 2025–2034, (USD MILLION)
FIGURE 75 REST OF WESTERN EUROPE VOC’S ROTOR CURRENT AND FUTURE TYPE ANALYSIS, 2025–2034, (USD MILLION)
FIGURE 76 REST OF WESTERN EUROPE VOC’S ROTOR CURRENT AND FUTURE END USER ANALYSIS, 2025–2034, (USD MILLION)
FIGURE 77 EAST ASIA AND PACIFIC VOC’S ROTOR CURRENT AND FUTURE MARKET VOLUME SHARE REGIONAL ANALYSIS, 2025–2034, (USD MILLION)
FIGURE 78 CHINA VOC’S ROTOR CURRENT AND FUTURE TYPE ANALYSIS, 2025–2034, (USD MILLION)
FIGURE 79 CHINA VOC’S ROTOR CURRENT AND FUTURE END USER ANALYSIS, 2025–2034, (USD MILLION)
FIGURE 80 JAPAN VOC’S ROTOR CURRENT AND FUTURE TYPE ANALYSIS, 2025–2034, (USD MILLION)
FIGURE 81 JAPAN VOC’S ROTOR CURRENT AND FUTURE END USER ANALYSIS, 2025–2034, (USD MILLION)
FIGURE 82 AUSTRALIA VOC’S ROTOR CURRENT AND FUTURE TYPE ANALYSIS, 2025–2034, (USD MILLION)
FIGURE 83 AUSTRALIA VOC’S ROTOR CURRENT AND FUTURE END USER ANALYSIS, 2025–2034, (USD MILLION)
FIGURE 84 CAMBODIA VOC’S ROTOR CURRENT AND FUTURE TYPE ANALYSIS, 2025–2034, (USD MILLION)
FIGURE 85 CAMBODIA VOC’S ROTOR CURRENT AND FUTURE END USER ANALYSIS, 2025–2034, (USD MILLION)
FIGURE 86 FIJI VOC’S ROTOR CURRENT AND FUTURE TYPE ANALYSIS, 2025–2034, (USD MILLION)
FIGURE 87 FIJI VOC’S ROTOR CURRENT AND FUTURE END USER ANALYSIS, 2025–2034, (USD MILLION)
FIGURE 88 INDONESIA VOC’S ROTOR CURRENT AND FUTURE TYPE ANALYSIS, 2025–2034, (USD MILLION)
FIGURE 89 INDONESIA VOC’S ROTOR CURRENT AND FUTURE END USER ANALYSIS, 2025–2034, (USD MILLION)
FIGURE 90 SOUTH KOREA VOC’S ROTOR CURRENT AND FUTURE TYPE ANALYSIS, 2025–2034, (USD MILLION)
FIGURE 91 SOUTH KOREA VOC’S ROTOR CURRENT AND FUTURE END USER ANALYSIS, 2025–2034, (USD MILLION)
FIGURE 92 REST OF EAST ASIA AND PACIFIC VOC’S ROTOR CURRENT AND FUTURE TYPE ANALYSIS, 2025–2034, (USD MILLION)
FIGURE 93 REST OF EAST ASIA AND PACIFIC VOC’S ROTOR CURRENT AND FUTURE END USER ANALYSIS, 2025–2034, (USD MILLION)
FIGURE 94 SEA AND SOUTH ASIA VOC’S ROTOR CURRENT AND FUTURE MARKET VOLUME SHARE REGIONAL ANALYSIS, 2025–2034, (USD MILLION)
FIGURE 95 BANGLADESH VOC’S ROTOR CURRENT AND FUTURE TYPE ANALYSIS, 2025–2034, (USD MILLION)
FIGURE 96 BANGLADESH VOC’S ROTOR CURRENT AND FUTURE END USER ANALYSIS, 2025–2034, (USD MILLION)
FIGURE 97 NEW ZEALAND VOC’S ROTOR CURRENT AND FUTURE TYPE ANALYSIS, 2025–2034, (USD MILLION)
FIGURE 98 NEW ZEALAND VOC’S ROTOR CURRENT AND FUTURE END USER ANALYSIS, 2025–2034, (USD MILLION)
FIGURE 99 INDIA VOC’S ROTOR CURRENT AND FUTURE TYPE ANALYSIS, 2025–2034, (USD MILLION)
FIGURE 100 INDIA VOC’S ROTOR CURRENT AND FUTURE END USER ANALYSIS, 2025–2034, (USD MILLION)
FIGURE 101 SINGAPORE VOC’S ROTOR CURRENT AND FUTURE TYPE ANALYSIS, 2025–2034, (USD MILLION)
FIGURE 102 SINGAPORE VOC’S ROTOR CURRENT AND FUTURE END USER ANALYSIS, 2025–2034, (USD MILLION)
FIGURE 103 THAILAND VOC’S ROTOR CURRENT AND FUTURE TYPE ANALYSIS, 2025–2034, (USD MILLION)
FIGURE 104 THAILAND VOC’S ROTOR CURRENT AND FUTURE END USER ANALYSIS, 2025–2034, (USD MILLION)
FIGURE 105 TAIWAN VOC’S ROTOR CURRENT AND FUTURE TYPE ANALYSIS, 2025–2034, (USD MILLION)
FIGURE 106 TAIWAN VOC’S ROTOR CURRENT AND FUTURE END USER ANALYSIS, 2025–2034, (USD MILLION)
FIGURE 107 MALAYSIA VOC’S ROTOR CURRENT AND FUTURE TYPE ANALYSIS, 2025–2034, (USD MILLION)
FIGURE 108 MALAYSIA VOC’S ROTOR CURRENT AND FUTURE END USER ANALYSIS, 2025–2034, (USD MILLION)
FIGURE 109 REST OF SEA AND SOUTH ASIA VOC’S ROTOR CURRENT AND FUTURE TYPE ANALYSIS, 2025–2034, (USD MILLION)
FIGURE 110 REST OF SEA AND SOUTH ASIA VOC’S ROTOR CURRENT AND FUTURE END USER ANALYSIS, 2025–2034, (USD MILLION)
FIGURE 111 MIDDLE EAST AND AFRICA VOC’S ROTOR CURRENT AND FUTURE MARKET VOLUME SHARE REGIONAL ANALYSIS, 2025–2034, (USD MILLION)
FIGURE 112 GCC COUNTRIES VOC’S ROTOR CURRENT AND FUTURE TYPE ANALYSIS, 2025–2034, (USD MILLION)
FIGURE 113 GCC COUNTRIES VOC’S ROTOR CURRENT AND FUTURE END USER ANALYSIS, 2025–2034, (USD MILLION)
FIGURE 114 SAUDI ARABIA VOC’S ROTOR CURRENT AND FUTURE TYPE ANALYSIS, 2025–2034, (USD MILLION)
FIGURE 115 SAUDI ARABIA VOC’S ROTOR CURRENT AND FUTURE END USER ANALYSIS, 2025–2034, (USD MILLION)
FIGURE 116 UAE VOC’S ROTOR CURRENT AND FUTURE TYPE ANALYSIS, 2025–2034, (USD MILLION)
FIGURE 117 UAE VOC’S ROTOR CURRENT AND FUTURE END USER ANALYSIS, 2025–2034, (USD MILLION)
FIGURE 118 BAHRAIN VOC’S ROTOR CURRENT AND FUTURE TYPE ANALYSIS, 2025–2034, (USD MILLION)
FIGURE 119 BAHRAIN VOC’S ROTOR CURRENT AND FUTURE END USER ANALYSIS, 2025–2034, (USD MILLION)
FIGURE 120 KUWAIT VOC’S ROTOR CURRENT AND FUTURE TYPE ANALYSIS, 2025–2034, (USD MILLION)
FIGURE 121 KUWAIT VOC’S ROTOR CURRENT AND FUTURE END USER ANALYSIS, 2025–2034, (USD MILLION)
FIGURE 122 OMAN VOC’S ROTOR CURRENT AND FUTURE TYPE ANALYSIS, 2025–2034, (USD MILLION)
FIGURE 123 OMAN VOC’S ROTOR CURRENT AND FUTURE END USER ANALYSIS, 2025–2034, (USD MILLION)
FIGURE 124 QATAR VOC’S ROTOR CURRENT AND FUTURE TYPE ANALYSIS, 2025–2034, (USD MILLION)
FIGURE 125 QATAR VOC’S ROTOR CURRENT AND FUTURE END USER ANALYSIS, 2025–2034, (USD MILLION)
FIGURE 126 EGYPT VOC’S ROTOR CURRENT AND FUTURE TYPE ANALYSIS, 2025–2034, (USD MILLION)
FIGURE 127 EGYPT VOC’S ROTOR CURRENT AND FUTURE END USER ANALYSIS, 2025–2034, (USD MILLION)
FIGURE 128 NIGERIA VOC’S ROTOR CURRENT AND FUTURE TYPE ANALYSIS, 2025–2034, (USD MILLION)
FIGURE 129 NIGERIA VOC’S ROTOR CURRENT AND FUTURE END USER ANALYSIS, 2025–2034, (USD MILLION)
FIGURE 130 SOUTH AFRICA VOC’S ROTOR CURRENT AND FUTURE TYPE ANALYSIS, 2025–2034, (USD MILLION)
FIGURE 131 SOUTH AFRICA VOC’S ROTOR CURRENT AND FUTURE END USER ANALYSIS, 2025–2034, (USD MILLION)
FIGURE 132 ISRAEL VOC’S ROTOR CURRENT AND FUTURE TYPE ANALYSIS, 2025–2034, (USD MILLION)
FIGURE 133 ISRAEL VOC’S ROTOR CURRENT AND FUTURE END USER ANALYSIS, 2025–2034, (USD MILLION)
FIGURE 134 REST OF MEA VOC’S ROTOR CURRENT AND FUTURE TYPE ANALYSIS, 2025–2034, (USD MILLION)
FIGURE 135 REST OF MEA VOC’S ROTOR CURRENT AND FUTURE END USER ANALYSIS, 2025–2034, (USD MILLION)
FIGURE 136 U. S. MARKET SHARE ANALYSIS BY TYPE (2024)
FIGURE 137 U. S. MARKET SHARE ANALYSIS BY END USER (2024)
FIGURE 138 CANADA MARKET SHARE ANALYSIS BY TYPE (2024)
FIGURE 139 CANADA MARKET SHARE ANALYSIS BY END USER (2024)
FIGURE 140 MEXICO MARKET SHARE ANALYSIS BY TYPE (2024)
FIGURE 141 MEXICO MARKET SHARE ANALYSIS BY END USER (2024)
FIGURE 142 CHINA MARKET SHARE ANALYSIS BY TYPE (2024)
FIGURE 143 CHINA MARKET SHARE ANALYSIS BY END USER (2024)
FIGURE 144 JAPAN MARKET SHARE ANALYSIS BY TYPE (2024)
FIGURE 145 JAPAN MARKET SHARE ANALYSIS BY END USER (2024)
FIGURE 146 INDIA MARKET SHARE ANALYSIS BY TYPE (2024)
FIGURE 147 INDIA MARKET SHARE ANALYSIS BY END USER (2024)
FIGURE 148 SOUTH KOREA MARKET SHARE ANALYSIS BY TYPE (2024)
FIGURE 149 SOUTH KOREA MARKET SHARE ANALYSIS BY END USER (2024)
FIGURE 150 SAUDI ARABIA MARKET SHARE ANALYSIS BY TYPE (2024)
FIGURE 151 SAUDI ARABIA MARKET SHARE ANALYSIS BY END USER (2024)
FIGURE 152 UAE MARKET SHARE ANALYSIS BY TYPE (2024)
FIGURE 153 UAE MARKET SHARE ANALYSIS BY END USER (2024)
FIGURE 154 EGYPT MARKET SHARE ANALYSIS BY TYPE (2024)
FIGURE 155 EGYPT MARKET SHARE ANALYSIS BY END USER (2024)
FIGURE 156 NIGERIA MARKET SHARE ANALYSIS BY TYPE (2024)
FIGURE 157 NIGERIA MARKET SHARE ANALYSIS BY END USER (2024)
FIGURE 158 SOUTH AFRICA MARKET SHARE ANALYSIS BY TYPE (2024)
FIGURE 159 SOUTH AFRICA MARKET SHARE ANALYSIS BY END USER (2024)
FIGURE 160 GERMANY MARKET SHARE ANALYSIS BY TYPE (2024)
FIGURE 161 GERMANY MARKET SHARE ANALYSIS BY END USER (2024)
FIGURE 162 FRANCE MARKET SHARE ANALYSIS BY TYPE (2024)
FIGURE 163 FRANCE MARKET SHARE ANALYSIS BY END USER (2024)
FIGURE 164 UK MARKET SHARE ANALYSIS BY TYPE (2024)
FIGURE 165 UK MARKET SHARE ANALYSIS BY END USER (2024)
FIGURE 166 SPAIN MARKET SHARE ANALYSIS BY TYPE (2024)
FIGURE 167 SPAIN MARKET SHARE ANALYSIS BY END USER (2024)
FIGURE 168 ITALY MARKET SHARE ANALYSIS BY TYPE (2024)
FIGURE 169 ITALY MARKET SHARE ANALYSIS BY END USER (2024)
FIGURE 170 BRAZIL MARKET SHARE ANALYSIS BY TYPE (2024)
FIGURE 171 BRAZIL MARKET SHARE ANALYSIS BY END USER (2024)
FIGURE 172 ARGENTINA MARKET SHARE ANALYSIS BY TYPE (2024)
FIGURE 173 ARGENTINA MARKET SHARE ANALYSIS BY END USER (2024)
FIGURE 174 COLUMBIA MARKET SHARE ANALYSIS BY TYPE (2024)
FIGURE 175 COLUMBIA MARKET SHARE ANALYSIS BY END USER (2024)
FIGURE 176 GLOBAL VOC’S ROTOR CURRENT AND FUTURE MARKET KEY COUNTRY LEVEL ANALYSIS, 2024–2034, (USD MILLION)
FIGURE 177 FINANCIAL OVERVIEW:
Key Player Analysis
Seibu Giken Co., Ltd.: Seibu Giken holds a leadership position in the global VOC rotor market, backed by its deep technical expertise and extensive portfolio of air treatment solutions. The company’s core offering includes its proprietary zeolite-based VOC concentrator rotors, known for high thermal resistance and long operating life. In 2025, Seibu Giken maintains a strong presence across Asia, particularly in Japan, South Korea, and China, supplying systems for automotive, electronics, and chemical manufacturing facilities.
The company continues to invest heavily in R&D, with a clear focus on developing energy-efficient systems that comply with evolving VOC regulations in the U.S. and EU. Recent advancements include smart rotor systems equipped with real-time diagnostics and automated performance monitoring. In addition, Seibu Giken is expanding its partnerships with OEMs in Europe to strengthen its presence in high-value markets. Its ability to offer fully integrated VOC abatement systems with a low total cost of ownership remains a key differentiator.
Munters Group AB: Munters is positioned as a key challenger in the VOC rotor segment, leveraging its global footprint and engineering capabilities in climate and air treatment systems. The company’s VOC solutions are integrated into a broader portfolio that serves food, pharmaceuticals, and industrial customers. Munters’ zeolite rotor systems are widely used in facilities requiring strict emissions control and energy efficiency.
As of 2025, Munters continues to pursue inorganic growth through strategic acquisitions. Its 2024 acquisition of a regional air treatment firm in Southeast Asia has strengthened its supply chain and service capability in emerging markets. Munters is also driving forward with AI-enabled VOC concentrator systems that allow predictive maintenance and remote monitoring—aligning with broader trends in industrial automation. Its regional diversity and focus on sustainability make it a preferred partner for multinational customers looking to comply with both local and international air quality standards.
Nichias Corporation: Nichias is recognized as a niche player with a focused approach to high-performance materials and VOC management technologies. While its overall market share remains smaller than larger competitors, the company serves critical segments such as semiconductors and precision manufacturing. Its VOC rotor products are valued for their durability and compatibility with cleanroom environments, giving it an edge in highly specialized use cases.
In 2025, Nichias is concentrating on enhancing the chemical resistance of its rotors and optimizing performance in ultra-low emission environments. The company is also expanding its reach in Taiwan and Singapore, where semiconductor fabrication demand is growing. Its technical specialization and ability to meet stringent application standards position it as a strategic supplier in the high-tech manufacturing segment.
ProFlute AB: ProFlute is emerging as a specialist supplier in the global VOC rotor market, with a growing presence across Europe and the Middle East. The company’s product line includes both standard and custom-designed rotors using proprietary adsorbent coatings tailored for different VOC profiles. While smaller in scale, ProFlute competes effectively by offering flexible configurations and short delivery timelines.
As of 2025, the company is targeting growth through collaborative R&D and licensing agreements. It has recently partnered with regional air handling system integrators in the GCC region to provide VOC control systems for petrochemical and industrial plants. ProFlute’s focus on mid-sized industrial operators and its ability to customize solutions afford it a competitive niche in a crowded market.
As of 2025, the tightening of environmental emission standards across major industrial economies remains a key growth catalyst for the VOC rotor market. Regulatory bodies such as the U.S. Environmental Protection Agency (EPA) and the European Commission continue to enforce strict limits on volatile organic compound emissions, particularly in chemical, automotive, and electronics manufacturing. In China, the implementation of the 14th Five-Year Plan on air pollution control has intensified compliance requirements. This regulatory pressure is driving capital investments into emission control systems, with VOC rotors being central to meeting these thresholds. As industries shift from traditional abatement systems to more efficient rotor-based solutions, the market is expected to grow at a steady CAGR of over 7% through 2030.
Restraint:
High Capital Costs Limiting VOC Rotor Implementation
High upfront costs remain a significant adoption barrier, particularly for small and mid-sized enterprises operating in price-sensitive markets. Installing a VOC rotor system can range from US$50,000 to over US$500,000 depending on capacity and configuration. This cost includes not just equipment but also engineering, installation, and maintenance. Many companies, especially in developing economies, delay upgrades or opt for less efficient alternatives to reduce capital expenditure. This limits market penetration in regions where regulatory enforcement is still maturing. Without financial incentives or subsidies, growth potential remains constrained outside Tier 1 industrial zones.
Opportunity:
Growing Adoption in Food Processing and Pharmaceutical Facilities
The food processing and pharmaceutical industries are emerging as high-growth end-use segments. Both sectors face stricter indoor air quality and contamination control requirements, particularly in cleanroom and packaging environments. With VOC emissions from sanitizers, solvents, and packaging adhesives coming under greater scrutiny, manufacturers are increasingly integrating rotor-based purification systems into new facilities. This segment is projected to grow at a CAGR of 8.5% through 2030, offering significant upside for suppliers targeting GMP-compliant (Good Manufacturing Practice) environments. Market players that can develop compact, energy-efficient rotor systems tailored to hygienic standards stand to gain competitive advantage.
Trend:
Smart Monitoring and Automation Transforming VOC Rotor Systems
The integration of smart monitoring and automation features into VOC rotor systems is reshaping product offerings in 2025. Manufacturers such as Munters and Seibu Giken are developing sensor-enabled systems that provide real-time performance diagnostics, predictive maintenance alerts, and remote operation capabilities. These intelligent solutions are gaining traction in advanced manufacturing sectors where downtime is costly and compliance is non-negotiable. By enabling better control and lower operational costs, this trend is not only improving adoption rates but also influencing procurement decisions in Europe, Japan, and South Korea.
Recent Developments
Dec 2024 – Munters Group AB: Munters completed the acquisition of a mid-sized VOC rotor manufacturer based in Thailand, valued at approximately USD 42 million. The move strengthens its manufacturing base and distribution network across Southeast Asia.
Feb 2025 – Seibu Giken Co., Ltd.: Seibu Giken launched a new high-efficiency VOC rotor system featuring AI-enabled diagnostics and real-time performance monitoring, aimed at semiconductor and electronics applications. The product is expected to reduce energy consumption by up to 18%, enhancing competitiveness in high-tech sectors.
Apr 2025 – ProFlute AB: ProFlute signed a licensing agreement with a UAE-based industrial air solutions provider to co-develop VOC rotor systems tailored for petrochemical facilities in the Gulf Cooperation Council (GCC) region. This partnership expands ProFlute’s access to one of the fastest-growing markets for emission control technologies.
Jul 2025 – Nichias Corporation: Nichias announced a USD 28 million investment to expand its VOC rotor production capacity at its Hiroshima plant, targeting a 25% increase in output by mid-2026. The move aims to meet rising demand from pharmaceutical and precision manufacturing customers across Asia.
Sep 2025 – Honeywell International Inc.: Honeywell entered the VOC rotor segment with the introduction of an integrated air purification system combining rotor-based VOC concentrators and low-NOx thermal oxidizers. The system is designed for large-scale industrial clients and is expected to generate over USD 60 million in revenue by 2027. This entry signals intensified competition and technological consolidation in the market.