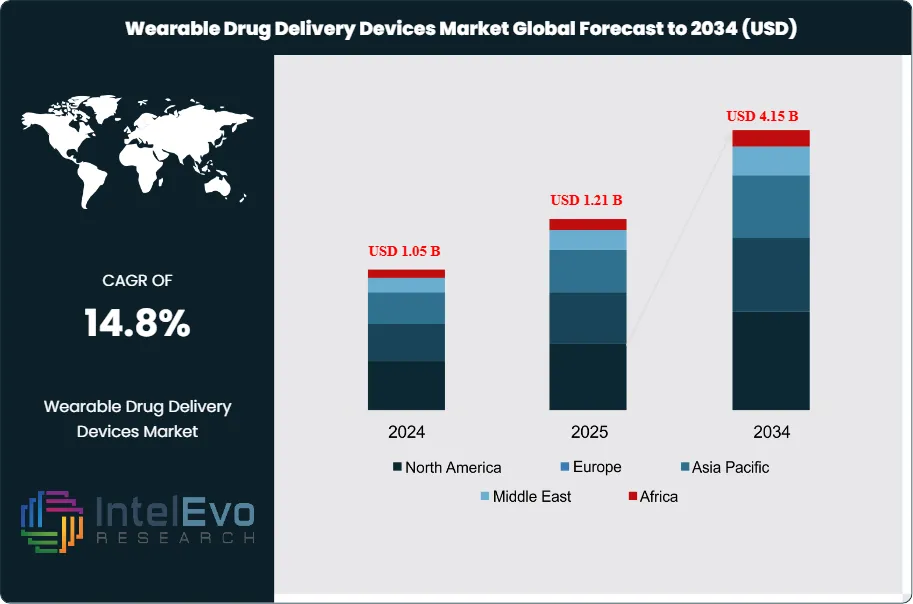
The wearable drug delivery devices market size is projected to be worth around USD 1.05 Billion in 2024 and is expected to surge to USD 4.15 Billion by 2034, expanding at an impressive CAGR of 14.8% during the forecast period from 2025 to 2034. From insulin to oncology treatments, tiny, on-body injectors are replacing traditional syringes. This massive market expansion is a clear indicator that patients and pharma companies are prioritizing discreet, efficient, and technology-enabled drug administration.
The wearable drug delivery devices market is experiencing significant growth due to technological advancements and the increasing prevalence of chronic diseases. These devices, which include insulin pumps, transdermal patches, and infusion pumps, offer patients a more convenient and efficient way to manage their medication regimens. In the healthcare sector, wearable drug delivery systems enhance patient compliance by allowing for continuous drug administration and monitoring, which is particularly beneficial for managing conditions such as diabetes and chronic pain.
The market's expansion is driven by several factors, including the rising demand for personalized medicine and home healthcare solutions. Innovations in materials and design have led to the development of more comfortable and user-friendly devices, facilitating better patient adherence. Furthermore, the integration of smart technologies, such as mobile app connectivity and real-time monitoring, enhances the effectiveness of these devices by allowing healthcare providers to track patient outcomes more effectively.
However, the wearable drug delivery devices market also faces challenges, including concerns about device reliability, potential adverse reactions to medications, and regulatory hurdles. The high cost of these devices can also limit their accessibility, particularly in emerging markets.
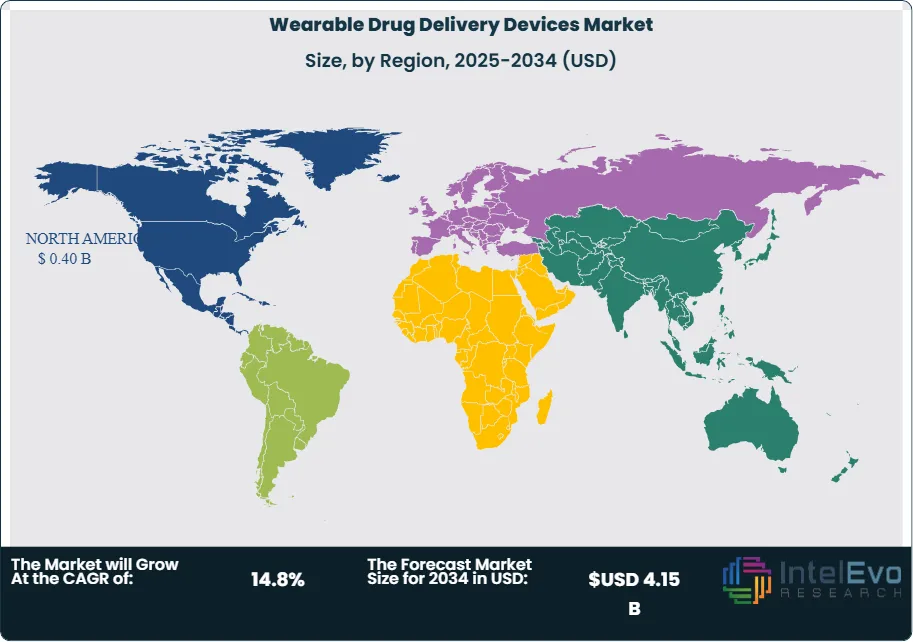
Geographically, North America holds a dominant position in the market due to advanced healthcare infrastructure and high healthcare expenditure. Europe follows closely, driven by a strong emphasis on innovation and patient-centric solutions. The Asia Pacific region is anticipated to witness the highest growth rate, fueled by increasing investments in healthcare technology and a growing geriatric population.
Key players in the market include companies like Medtronic, Insulet Corporation, and Abbott Laboratories, which are focused on expanding their product portfolios and enhancing device capabilities. Despite disruptions caused by the COVID-19 pandemic, the market is recovering, with a renewed focus on remote healthcare solutions and patient-centered care. As technological advancements continue to emerge, particularly in telemedicine and connected devices, the demand for wearable drug delivery devices is expected to rise significantly, ensuring their relevance in the future of healthcare.
Key Takeaways:
Market Growth: The Wearable Drug Delivery Devices is expected to reach USD 4.15 Billion by 2034, growing at a robust CAGR of 14.8%, indicating strong market expansion.
Product Dominance: in the global wearable drug delivery devices market, patch-based devices dominate due to their ease of use and effectiveness in continuous drug administration. Infusion pumps follow closely, especially for chronic conditions like diabetes. The integration of smart technology in these devices enhances their appeal, driving patient adherence and optimizing therapeutic outcomes. Overall, convenience and innovation fuel market leadership.
Application: The Diabetes Management application dominates the wearable drug delivery devices market, driven by the increasing prevalence of diabetes globally. Innovations such as insulin pumps and continuous glucose monitors enhance patient convenience and adherence to treatment regimens. These devices offer real-time monitoring and personalized insulin delivery, significantly improving the quality of life for diabetes patients and reducing complications.
Driver: The wearable drug delivery devices market is driven by the rising prevalence of chronic diseases, such as diabetes and cardiovascular conditions, which require continuous medication management. Additionally, the demand for minimally invasive treatment options and advancements in technology, including smart features and real-time monitoring, enhance patient compliance and improve therapeutic outcomes, further propelling market growth.
Restraint: The Global Wearable Drug Delivery Devices Market faces several restraints, including high manufacturing costs that can limit accessibility and affordability for patients. Regulatory hurdles and the need for extensive clinical trials can delay product approvals. Additionally, concerns about data privacy and security, along with the complexity of device usage, may hinder adoption among patients and healthcare providers.
Opportunity: The wearable drug delivery devices market presents significant opportunities due to the increasing prevalence of chronic diseases and patient demand for non-invasive treatments. Innovations in technology, such as smart wearables and telemedicine integration, enhance patient compliance and medication management. Expanding healthcare access in emerging markets further supports growth, creating avenues for manufacturers to introduce advanced, user-friendly devices.
Trend: The wearable drug delivery devices market is trending toward increased automation, personalized medicine, integration with digital health technologies, and enhanced patient monitoring, driving convenience and improving therapeutic outcomes for chronic conditions.
Regional Analysis: North America leads the wearable drug delivery devices market, followed by Europe. Asia-Pacific shows the fastest growth due to increasing chronic diseases and rising healthcare awareness in emerging economies.
Product Analysis:
The Global Wearable Drug Delivery Devices Market features innovative products like patch-based systems, infusion pumps, auto-injectors, and smart wearables. Patch-based devices provide painless transdermal drug delivery, while infusion pumps enable continuous medication administration, crucial for chronic conditions like diabetes. Auto-injectors facilitate self-administration of injectable medications, enhancing patient compliance. Smart wearables incorporate sensors and connectivity, allowing real-time monitoring and data sharing with healthcare providers. These devices prioritize user-friendly designs, often focusing on minimizing invasiveness and improving medication adherence, catering to diverse therapeutic areas, including diabetes management, pain relief, and hormonal therapies, thereby transforming patient care and medication delivery.
Application Analysis:
The application analysis of the Global Wearable Drug Delivery Devices Market highlights key segments, including diabetes management, cardiovascular disease treatment, pain management, hormonal disorders, and respiratory disorders. Diabetes management is a prominent application, featuring insulin pumps and continuous glucose monitors that enhance patient compliance. In cardiovascular care, wearable devices deliver medications like anticoagulants. Pain management applications utilize devices for controlled opioid delivery. Hormonal therapy includes wearables for hormone replacement, while respiratory disorder management focuses on devices for delivering inhaled medications. Overall, these applications cater to the growing demand for convenient, efficient, and patient-centered drug administration solutions.
Region Analysis:
North America Leads With 40% Market Share In Wearable Drug Delivery Devices: The Asia-Pacific region is experiencing the most rapid growth in the Wearable Drug Delivery Devices Market. Factors contributing to this expansion include a burgeoning population, increasing prevalence of chronic diseases, and rising healthcare expenditure. Countries like China and India are investing heavily in healthcare technology, resulting in the adoption of advanced medical devices. The region’s expanding middle class is also driving demand for innovative and accessible healthcare solutions. Moreover, supportive government initiatives and improvements in healthcare infrastructure facilitate the introduction of cutting-edge drug delivery technologies. The growing emphasis on patient-centric care further propels the market’s momentum in this dynamic region.
By Product Type (Patch Pumps/Injectors (On-Body Injectors), Wearable Infusion Pumps, Continuous Glucose Monitoring (CGM) Integrated Pumps, Others (e.g., Microneedle Systems, Smart Vests)), By Technology/Mechanism (Electromechanical Devices, Mechanical Devices (Spring-based, Rotary Pump), Microfluidic Systems), By Application, (Diabetes Management, Oncology (Cancer Treatment), Autoimmune Disorders, Pain Management, Cardiovascular Diseases (CVD), Others), By End User (Hospitals and Clinics, Home Care Settings/Ambulatory Care Centers, Research Organizations)
Research Methodology
Primary Research- 100 Interviews of Stakeholders
Secondary Research
Desk Research
Regional scope
North America (United States, Canada, Mexico)
Latin America (Brazil, Argentina, Columbia)
East Asia And Pacific (China, Japan, South Korea, Australia, Cambodia, Fiji, Indonesia)
Sea And South Asia (India, Singapore, Thailand, Taiwan, Malaysia)
Eastern Europe (Poland, Russia, Czech Republic, Romania)
Western Europe (Germany, U.K., France, Spain, Itlay)
Middle East & Africa (GCC Countries, Egypt, Nigeria, South Africa, Israel)
Competitive Landscape
Medtronic, Insulet Corporation, Tandem Diabetes Care, Amgen Inc., Ypsomed AG, Becton Dickinson and Co., Eli Lilly and Company, Roche Diagnostics, Pfizer Inc., United Therapeutics Corp., Smiths Medical, Debiotech SA, Novo Nordisk A/S, AstraZeneca, Johnson & Johnson, Baxter International Inc., West Pharmaceutical Services, CeQur SA, Unilife Corporation, Gerresheimer AG
Customization Scope
Customization for segments, region/country-level will be provided. Moreover, additional customization can be done based on the requirements.
Pricing and Purchase Options
Avail customized purchase options to meet your exact research needs. We have three licenses to opt for: Single User License, Multi-User License (Up to 5 Users), Corporate Use License (Unlimited User and Printable PDF).
TABLE OF CONTENTS
1. EXECUTIVE SUMMARY
1.1. MARKET SNAPSHOT
1.2. KEY FINDINGS & INSIGHTS
1.3. ANALYST RECOMMENDATIONS
1.4. FUTURE OUTLOOK
2. RESEARCH METHODOLOGY
2.1. MARKET DEFINITION & SCOPE
2.2. RESEARCH OBJECTIVES: PRIMARY & SECONDARY DATA SOURCES
2.3. DATA COLLECTION SOURCES
2.3.1. COVERAGE OF 100+ PRIMARY RESEARCH/CONSULTATION CALLS WITH INDUSTRY STAKEHOLDERS
FIGURE 17 NORTH AMERICA WEARABLE DRUG DELIVERY DEVICES CURRENT AND FUTURE TYPE ANALYSIS, 2025–2034, (USD MILLION)
FIGURE 18 NORTH AMERICA WEARABLE DRUG DELIVERY DEVICES CURRENT AND FUTURE END USER ANALYSIS, 2025–2034, (USD MILLION)
FIGURE 19 MARKET SHARE BY COUNTRY
FIGURE 20 LATIN AMERICA WEARABLE DRUG DELIVERY DEVICES CURRENT AND FUTURE TYPE ANALYSIS, 2025–2034, (USD MILLION)
FIGURE 21 LATIN AMERICA WEARABLE DRUG DELIVERY DEVICES CURRENT AND FUTURE END USER ANALYSIS, 2025–2034, (USD MILLION)
FIGURE 22 MARKET SHARE BY COUNTRY
FIGURE 23 EASTERN EUROPE WEARABLE DRUG DELIVERY DEVICES CURRENT AND FUTURE TYPE ANALYSIS, 2025–2034, (USD MILLION)
FIGURE 24 EASTERN EUROPE WEARABLE DRUG DELIVERY DEVICES CURRENT AND FUTURE END USER ANALYSIS, 2025–2034, (USD MILLION)
FIGURE 25 MARKET SHARE BY COUNTRY
FIGURE 26 WESTERN EUROPE WEARABLE DRUG DELIVERY DEVICES CURRENT AND FUTURE TYPE ANALYSIS, 2025–2034, (USD MILLION)
FIGURE 27 WESTERN EUROPE WEARABLE DRUG DELIVERY DEVICES CURRENT AND FUTURE END USER ANALYSIS, 2025–2034, (USD MILLION)
FIGURE 28 MARKET SHARE BY COUNTRY
FIGURE 29 EAST ASIA AND PACIFIC WEARABLE DRUG DELIVERY DEVICES CURRENT AND FUTURE TYPE ANALYSIS, 2025–2034, (USD MILLION)
FIGURE 30 EAST ASIA AND PACIFIC WEARABLE DRUG DELIVERY DEVICES CURRENT AND FUTURE END USER ANALYSIS, 2025–2034, (USD MILLION)
FIGURE 31 MARKET SHARE BY COUNTRY
FIGURE 32 SEA AND SOUTH ASIA WEARABLE DRUG DELIVERY DEVICES CURRENT AND FUTURE TYPE ANALYSIS, 2025–2034, (USD MILLION)
FIGURE 33 SEA AND SOUTH ASIA WEARABLE DRUG DELIVERY DEVICES CURRENT AND FUTURE END USER ANALYSIS, 2025–2034, (USD MILLION)
FIGURE 34 MARKET SHARE BY COUNTRY
FIGURE 35 MIDDLE EAST AND AFRICA WEARABLE DRUG DELIVERY DEVICES CURRENT AND FUTURE TYPE ANALYSIS, 2025–2034, (USD MILLION)
FIGURE 36 MIDDLE EAST AND AFRICA WEARABLE DRUG DELIVERY DEVICES CURRENT AND FUTURE END USER ANALYSIS, 2025–2034, (USD MILLION)
FIGURE 37 NORTH AMERICA WEARABLE DRUG DELIVERY DEVICES CURRENT AND FUTURE MARKET VOLUME SHARE REGIONAL ANALYSIS, 2025–2034, (USD MILLION)
FIGURE 38 U.S. WEARABLE DRUG DELIVERY DEVICES CURRENT AND FUTURE TYPE ANALYSIS, 2025–2034, (USD MILLION)
FIGURE 39 U.S. WEARABLE DRUG DELIVERY DEVICES CURRENT AND FUTURE END USER ANALYSIS, 2025–2034, (USD MILLION)
FIGURE 40 CANADA WEARABLE DRUG DELIVERY DEVICES CURRENT AND FUTURE TYPE ANALYSIS, 2025–2034, (USD MILLION)
FIGURE 41 CANADA WEARABLE DRUG DELIVERY DEVICES CURRENT AND FUTURE END USER ANALYSIS, 2025–2034, (USD MILLION)
FIGURE 42 LATIN AMERICA WEARABLE DRUG DELIVERY DEVICES CURRENT AND FUTURE MARKET VOLUME SHARE REGIONAL ANALYSIS, 2025–2034, (USD MILLION)
FIGURE 43 MEXICO WEARABLE DRUG DELIVERY DEVICES CURRENT AND FUTURE TYPE ANALYSIS, 2025–2034, (USD MILLION)
FIGURE 44 MEXICO WEARABLE DRUG DELIVERY DEVICES CURRENT AND FUTURE END USER ANALYSIS, 2025–2034, (USD MILLION)
FIGURE 45 BRAZIL WEARABLE DRUG DELIVERY DEVICES CURRENT AND FUTURE TYPE ANALYSIS, 2025–2034, (USD MILLION)
FIGURE 46 BRAZIL WEARABLE DRUG DELIVERY DEVICES CURRENT AND FUTURE END USER ANALYSIS, 2025–2034, (USD MILLION)
FIGURE 47 ARGENTINA WEARABLE DRUG DELIVERY DEVICES CURRENT AND FUTURE TYPE ANALYSIS, 2025–2034, (USD MILLION)
FIGURE 48 ARGENTINA WEARABLE DRUG DELIVERY DEVICES CURRENT AND FUTURE END USER ANALYSIS, 2025–2034, (USD MILLION)
FIGURE 49 COLUMBIA WEARABLE DRUG DELIVERY DEVICES CURRENT AND FUTURE TYPE ANALYSIS, 2025–2034, (USD MILLION)
FIGURE 50 COLUMBIA WEARABLE DRUG DELIVERY DEVICES CURRENT AND FUTURE END USER ANALYSIS, 2025–2034, (USD MILLION)
FIGURE 51 REST OF LATIN AMERICA WEARABLE DRUG DELIVERY DEVICES CURRENT AND FUTURE TYPE ANALYSIS, 2025–2034, (USD MILLION)
FIGURE 52 REST OF LATIN AMERICA WEARABLE DRUG DELIVERY DEVICES CURRENT AND FUTURE END USER ANALYSIS, 2025–2034, (USD MILLION)
FIGURE 53 EASTERN EUROPE WEARABLE DRUG DELIVERY DEVICES CURRENT AND FUTURE MARKET VOLUME SHARE REGIONAL ANALYSIS, 2025–2034, (USD MILLION)
FIGURE 54 POLAND WEARABLE DRUG DELIVERY DEVICES CURRENT AND FUTURE TYPE ANALYSIS, 2025–2034, (USD MILLION)
FIGURE 55 POLAND WEARABLE DRUG DELIVERY DEVICES CURRENT AND FUTURE END USER ANALYSIS, 2025–2034, (USD MILLION)
FIGURE 56 RUSSIA WEARABLE DRUG DELIVERY DEVICES CURRENT AND FUTURE TYPE ANALYSIS, 2025–2034, (USD MILLION)
FIGURE 57 RUSSIA WEARABLE DRUG DELIVERY DEVICES CURRENT AND FUTURE END USER ANALYSIS, 2025–2034, (USD MILLION)
FIGURE 58 CZECH REPUBLIC WEARABLE DRUG DELIVERY DEVICES CURRENT AND FUTURE TYPE ANALYSIS, 2025–2034, (USD MILLION)
FIGURE 59 CZECH REPUBLIC WEARABLE DRUG DELIVERY DEVICES CURRENT AND FUTURE END USER ANALYSIS, 2025–2034, (USD MILLION)
FIGURE 60 ROMANIA WEARABLE DRUG DELIVERY DEVICES CURRENT AND FUTURE TYPE ANALYSIS, 2025–2034, (USD MILLION)
FIGURE 61 ROMANIA WEARABLE DRUG DELIVERY DEVICES CURRENT AND FUTURE END USER ANALYSIS, 2025–2034, (USD MILLION)
FIGURE 62 REST OF EASTERN EUROPE WEARABLE DRUG DELIVERY DEVICES CURRENT AND FUTURE TYPE ANALYSIS, 2025–2034, (USD MILLION)
FIGURE 63 REST OF EASTERN EUROPE WEARABLE DRUG DELIVERY DEVICES CURRENT AND FUTURE END USER ANALYSIS, 2025–2034, (USD MILLION)
FIGURE 64 WESTERN EUROPE WEARABLE DRUG DELIVERY DEVICES CURRENT AND FUTURE MARKET VOLUME SHARE REGIONAL ANALYSIS, 2025–2034, (USD MILLION)
FIGURE 65 GERMANY WEARABLE DRUG DELIVERY DEVICES CURRENT AND FUTURE TYPE ANALYSIS, 2025–2034, (USD MILLION)
FIGURE 66 GERMANY WEARABLE DRUG DELIVERY DEVICES CURRENT AND FUTURE END USER ANALYSIS, 2025–2034, (USD MILLION)
FIGURE 67 FRANCE WEARABLE DRUG DELIVERY DEVICES CURRENT AND FUTURE TYPE ANALYSIS, 2025–2034, (USD MILLION)
FIGURE 68 FRANCE WEARABLE DRUG DELIVERY DEVICES CURRENT AND FUTURE END USER ANALYSIS, 2025–2034, (USD MILLION)
FIGURE 69 UK WEARABLE DRUG DELIVERY DEVICES CURRENT AND FUTURE TYPE ANALYSIS, 2025–2034, (USD MILLION)
FIGURE 70 UK WEARABLE DRUG DELIVERY DEVICES CURRENT AND FUTURE END USER ANALYSIS, 2025–2034, (USD MILLION)
FIGURE 71 SPAIN WEARABLE DRUG DELIVERY DEVICES CURRENT AND FUTURE TYPE ANALYSIS, 2025–2034, (USD MILLION)
FIGURE 72 SPAIN WEARABLE DRUG DELIVERY DEVICES CURRENT AND FUTURE END USER ANALYSIS, 2025–2034, (USD MILLION)
FIGURE 73 ITALY WEARABLE DRUG DELIVERY DEVICES CURRENT AND FUTURE TYPE ANALYSIS, 2025–2034, (USD MILLION)
FIGURE 74 ITALY WEARABLE DRUG DELIVERY DEVICES CURRENT AND FUTURE END USER ANALYSIS, 2025–2034, (USD MILLION)
FIGURE 75 REST OF WESTERN EUROPE WEARABLE DRUG DELIVERY DEVICES CURRENT AND FUTURE TYPE ANALYSIS, 2025–2034, (USD MILLION)
FIGURE 76 REST OF WESTERN EUROPE WEARABLE DRUG DELIVERY DEVICES CURRENT AND FUTURE END USER ANALYSIS, 2025–2034, (USD MILLION)
FIGURE 77 EAST ASIA AND PACIFIC WEARABLE DRUG DELIVERY DEVICES CURRENT AND FUTURE MARKET VOLUME SHARE REGIONAL ANALYSIS, 2025–2034, (USD MILLION)
FIGURE 78 CHINA WEARABLE DRUG DELIVERY DEVICES CURRENT AND FUTURE TYPE ANALYSIS, 2025–2034, (USD MILLION)
FIGURE 79 CHINA WEARABLE DRUG DELIVERY DEVICES CURRENT AND FUTURE END USER ANALYSIS, 2025–2034, (USD MILLION)
FIGURE 80 JAPAN WEARABLE DRUG DELIVERY DEVICES CURRENT AND FUTURE TYPE ANALYSIS, 2025–2034, (USD MILLION)
FIGURE 81 JAPAN WEARABLE DRUG DELIVERY DEVICES CURRENT AND FUTURE END USER ANALYSIS, 2025–2034, (USD MILLION)
FIGURE 82 AUSTRALIA WEARABLE DRUG DELIVERY DEVICES CURRENT AND FUTURE TYPE ANALYSIS, 2025–2034, (USD MILLION)
FIGURE 83 AUSTRALIA WEARABLE DRUG DELIVERY DEVICES CURRENT AND FUTURE END USER ANALYSIS, 2025–2034, (USD MILLION)
FIGURE 84 CAMBODIA WEARABLE DRUG DELIVERY DEVICES CURRENT AND FUTURE TYPE ANALYSIS, 2025–2034, (USD MILLION)
FIGURE 85 CAMBODIA WEARABLE DRUG DELIVERY DEVICES CURRENT AND FUTURE END USER ANALYSIS, 2025–2034, (USD MILLION)
FIGURE 86 FIJI WEARABLE DRUG DELIVERY DEVICES CURRENT AND FUTURE TYPE ANALYSIS, 2025–2034, (USD MILLION)
FIGURE 87 FIJI WEARABLE DRUG DELIVERY DEVICES CURRENT AND FUTURE END USER ANALYSIS, 2025–2034, (USD MILLION)
FIGURE 88 INDONESIA WEARABLE DRUG DELIVERY DEVICES CURRENT AND FUTURE TYPE ANALYSIS, 2025–2034, (USD MILLION)
FIGURE 89 INDONESIA WEARABLE DRUG DELIVERY DEVICES CURRENT AND FUTURE END USER ANALYSIS, 2025–2034, (USD MILLION)
FIGURE 90 SOUTH KOREA WEARABLE DRUG DELIVERY DEVICES CURRENT AND FUTURE TYPE ANALYSIS, 2025–2034, (USD MILLION)
FIGURE 91 SOUTH KOREA WEARABLE DRUG DELIVERY DEVICES CURRENT AND FUTURE END USER ANALYSIS, 2025–2034, (USD MILLION)
FIGURE 92 REST OF EAST ASIA AND PACIFIC WEARABLE DRUG DELIVERY DEVICES CURRENT AND FUTURE TYPE ANALYSIS, 2025–2034, (USD MILLION)
FIGURE 93 REST OF EAST ASIA AND PACIFIC WEARABLE DRUG DELIVERY DEVICES CURRENT AND FUTURE END USER ANALYSIS, 2025–2034, (USD MILLION)
FIGURE 94 SEA AND SOUTH ASIA WEARABLE DRUG DELIVERY DEVICES CURRENT AND FUTURE MARKET VOLUME SHARE REGIONAL ANALYSIS, 2025–2034, (USD MILLION)
FIGURE 95 BANGLADESH WEARABLE DRUG DELIVERY DEVICES CURRENT AND FUTURE TYPE ANALYSIS, 2025–2034, (USD MILLION)
FIGURE 96 BANGLADESH WEARABLE DRUG DELIVERY DEVICES CURRENT AND FUTURE END USER ANALYSIS, 2025–2034, (USD MILLION)
FIGURE 97 NEW ZEALAND WEARABLE DRUG DELIVERY DEVICES CURRENT AND FUTURE TYPE ANALYSIS, 2025–2034, (USD MILLION)
FIGURE 98 NEW ZEALAND WEARABLE DRUG DELIVERY DEVICES CURRENT AND FUTURE END USER ANALYSIS, 2025–2034, (USD MILLION)
FIGURE 99 INDIA WEARABLE DRUG DELIVERY DEVICES CURRENT AND FUTURE TYPE ANALYSIS, 2025–2034, (USD MILLION)
FIGURE 100 INDIA WEARABLE DRUG DELIVERY DEVICES CURRENT AND FUTURE END USER ANALYSIS, 2025–2034, (USD MILLION)
FIGURE 101 SINGAPORE WEARABLE DRUG DELIVERY DEVICES CURRENT AND FUTURE TYPE ANALYSIS, 2025–2034, (USD MILLION)
FIGURE 102 SINGAPORE WEARABLE DRUG DELIVERY DEVICES CURRENT AND FUTURE END USER ANALYSIS, 2025–2034, (USD MILLION)
FIGURE 103 THAILAND WEARABLE DRUG DELIVERY DEVICES CURRENT AND FUTURE TYPE ANALYSIS, 2025–2034, (USD MILLION)
FIGURE 104 THAILAND WEARABLE DRUG DELIVERY DEVICES CURRENT AND FUTURE END USER ANALYSIS, 2025–2034, (USD MILLION)
FIGURE 105 TAIWAN WEARABLE DRUG DELIVERY DEVICES CURRENT AND FUTURE TYPE ANALYSIS, 2025–2034, (USD MILLION)
FIGURE 106 TAIWAN WEARABLE DRUG DELIVERY DEVICES CURRENT AND FUTURE END USER ANALYSIS, 2025–2034, (USD MILLION)
FIGURE 107 MALAYSIA WEARABLE DRUG DELIVERY DEVICES CURRENT AND FUTURE TYPE ANALYSIS, 2025–2034, (USD MILLION)
FIGURE 108 MALAYSIA WEARABLE DRUG DELIVERY DEVICES CURRENT AND FUTURE END USER ANALYSIS, 2025–2034, (USD MILLION)
FIGURE 109 REST OF SEA AND SOUTH ASIA WEARABLE DRUG DELIVERY DEVICES CURRENT AND FUTURE TYPE ANALYSIS, 2025–2034, (USD MILLION)
FIGURE 110 REST OF SEA AND SOUTH ASIA WEARABLE DRUG DELIVERY DEVICES CURRENT AND FUTURE END USER ANALYSIS, 2025–2034, (USD MILLION)
FIGURE 111 MIDDLE EAST AND AFRICA WEARABLE DRUG DELIVERY DEVICES CURRENT AND FUTURE MARKET VOLUME SHARE REGIONAL ANALYSIS, 2025–2034, (USD MILLION)
FIGURE 112 GCC COUNTRIES WEARABLE DRUG DELIVERY DEVICES CURRENT AND FUTURE TYPE ANALYSIS, 2025–2034, (USD MILLION)
FIGURE 113 GCC COUNTRIES WEARABLE DRUG DELIVERY DEVICES CURRENT AND FUTURE END USER ANALYSIS, 2025–2034, (USD MILLION)
FIGURE 114 SAUDI ARABIA WEARABLE DRUG DELIVERY DEVICES CURRENT AND FUTURE TYPE ANALYSIS, 2025–2034, (USD MILLION)
FIGURE 115 SAUDI ARABIA WEARABLE DRUG DELIVERY DEVICES CURRENT AND FUTURE END USER ANALYSIS, 2025–2034, (USD MILLION)
FIGURE 116 UAE WEARABLE DRUG DELIVERY DEVICES CURRENT AND FUTURE TYPE ANALYSIS, 2025–2034, (USD MILLION)
FIGURE 117 UAE WEARABLE DRUG DELIVERY DEVICES CURRENT AND FUTURE END USER ANALYSIS, 2025–2034, (USD MILLION)
FIGURE 118 BAHRAIN WEARABLE DRUG DELIVERY DEVICES CURRENT AND FUTURE TYPE ANALYSIS, 2025–2034, (USD MILLION)
FIGURE 119 BAHRAIN WEARABLE DRUG DELIVERY DEVICES CURRENT AND FUTURE END USER ANALYSIS, 2025–2034, (USD MILLION)
FIGURE 120 KUWAIT WEARABLE DRUG DELIVERY DEVICES CURRENT AND FUTURE TYPE ANALYSIS, 2025–2034, (USD MILLION)
FIGURE 121 KUWAIT WEARABLE DRUG DELIVERY DEVICES CURRENT AND FUTURE END USER ANALYSIS, 2025–2034, (USD MILLION)
FIGURE 122 OMAN WEARABLE DRUG DELIVERY DEVICES CURRENT AND FUTURE TYPE ANALYSIS, 2025–2034, (USD MILLION)
FIGURE 123 OMAN WEARABLE DRUG DELIVERY DEVICES CURRENT AND FUTURE END USER ANALYSIS, 2025–2034, (USD MILLION)
FIGURE 124 QATAR WEARABLE DRUG DELIVERY DEVICES CURRENT AND FUTURE TYPE ANALYSIS, 2025–2034, (USD MILLION)
FIGURE 125 QATAR WEARABLE DRUG DELIVERY DEVICES CURRENT AND FUTURE END USER ANALYSIS, 2025–2034, (USD MILLION)
FIGURE 126 EGYPT WEARABLE DRUG DELIVERY DEVICES CURRENT AND FUTURE TYPE ANALYSIS, 2025–2034, (USD MILLION)
FIGURE 127 EGYPT WEARABLE DRUG DELIVERY DEVICES CURRENT AND FUTURE END USER ANALYSIS, 2025–2034, (USD MILLION)
FIGURE 128 NIGERIA WEARABLE DRUG DELIVERY DEVICES CURRENT AND FUTURE TYPE ANALYSIS, 2025–2034, (USD MILLION)
FIGURE 129 NIGERIA WEARABLE DRUG DELIVERY DEVICES CURRENT AND FUTURE END USER ANALYSIS, 2025–2034, (USD MILLION)
FIGURE 130 SOUTH AFRICA WEARABLE DRUG DELIVERY DEVICES CURRENT AND FUTURE TYPE ANALYSIS, 2025–2034, (USD MILLION)
FIGURE 131 SOUTH AFRICA WEARABLE DRUG DELIVERY DEVICES CURRENT AND FUTURE END USER ANALYSIS, 2025–2034, (USD MILLION)
FIGURE 132 ISRAEL WEARABLE DRUG DELIVERY DEVICES CURRENT AND FUTURE TYPE ANALYSIS, 2025–2034, (USD MILLION)
FIGURE 133 ISRAEL WEARABLE DRUG DELIVERY DEVICES CURRENT AND FUTURE END USER ANALYSIS, 2025–2034, (USD MILLION)
FIGURE 134 REST OF MEA WEARABLE DRUG DELIVERY DEVICES CURRENT AND FUTURE TYPE ANALYSIS, 2025–2034, (USD MILLION)
FIGURE 135 REST OF MEA WEARABLE DRUG DELIVERY DEVICES CURRENT AND FUTURE END USER ANALYSIS, 2025–2034, (USD MILLION)
FIGURE 136 U. S. MARKET SHARE ANALYSIS BY TYPE (2024)
FIGURE 137 U. S. MARKET SHARE ANALYSIS BY END USER (2024)
FIGURE 138 CANADA MARKET SHARE ANALYSIS BY TYPE (2024)
FIGURE 139 CANADA MARKET SHARE ANALYSIS BY END USER (2024)
FIGURE 140 MEXICO MARKET SHARE ANALYSIS BY TYPE (2024)
FIGURE 141 MEXICO MARKET SHARE ANALYSIS BY END USER (2024)
FIGURE 142 CHINA MARKET SHARE ANALYSIS BY TYPE (2024)
FIGURE 143 CHINA MARKET SHARE ANALYSIS BY END USER (2024)
FIGURE 144 JAPAN MARKET SHARE ANALYSIS BY TYPE (2024)
FIGURE 145 JAPAN MARKET SHARE ANALYSIS BY END USER (2024)
FIGURE 146 INDIA MARKET SHARE ANALYSIS BY TYPE (2024)
FIGURE 147 INDIA MARKET SHARE ANALYSIS BY END USER (2024)
FIGURE 148 SOUTH KOREA MARKET SHARE ANALYSIS BY TYPE (2024)
FIGURE 149 SOUTH KOREA MARKET SHARE ANALYSIS BY END USER (2024)
FIGURE 150 SAUDI ARABIA MARKET SHARE ANALYSIS BY TYPE (2024)
FIGURE 151 SAUDI ARABIA MARKET SHARE ANALYSIS BY END USER (2024)
FIGURE 152 UAE MARKET SHARE ANALYSIS BY TYPE (2024)
FIGURE 153 UAE MARKET SHARE ANALYSIS BY END USER (2024)
FIGURE 154 EGYPT MARKET SHARE ANALYSIS BY TYPE (2024)
FIGURE 155 EGYPT MARKET SHARE ANALYSIS BY END USER (2024)
FIGURE 156 NIGERIA MARKET SHARE ANALYSIS BY TYPE (2024)
FIGURE 157 NIGERIA MARKET SHARE ANALYSIS BY END USER (2024)
FIGURE 158 SOUTH AFRICA MARKET SHARE ANALYSIS BY TYPE (2024)
FIGURE 159 SOUTH AFRICA MARKET SHARE ANALYSIS BY END USER (2024)
FIGURE 160 GERMANY MARKET SHARE ANALYSIS BY TYPE (2024)
FIGURE 161 GERMANY MARKET SHARE ANALYSIS BY END USER (2024)
FIGURE 162 FRANCE MARKET SHARE ANALYSIS BY TYPE (2024)
FIGURE 163 FRANCE MARKET SHARE ANALYSIS BY END USER (2024)
FIGURE 164 UK MARKET SHARE ANALYSIS BY TYPE (2024)
FIGURE 165 UK MARKET SHARE ANALYSIS BY END USER (2024)
FIGURE 166 SPAIN MARKET SHARE ANALYSIS BY TYPE (2024)
FIGURE 167 SPAIN MARKET SHARE ANALYSIS BY END USER (2024)
FIGURE 168 ITALY MARKET SHARE ANALYSIS BY TYPE (2024)
FIGURE 169 ITALY MARKET SHARE ANALYSIS BY END USER (2024)
FIGURE 170 BRAZIL MARKET SHARE ANALYSIS BY TYPE (2024)
FIGURE 171 BRAZIL MARKET SHARE ANALYSIS BY END USER (2024)
FIGURE 172 ARGENTINA MARKET SHARE ANALYSIS BY TYPE (2024)
FIGURE 173 ARGENTINA MARKET SHARE ANALYSIS BY END USER (2024)
FIGURE 174 COLUMBIA MARKET SHARE ANALYSIS BY TYPE (2024)
FIGURE 175 COLUMBIA MARKET SHARE ANALYSIS BY END USER (2024)
FIGURE 176 GLOBAL WEARABLE DRUG DELIVERY DEVICES CURRENT AND FUTURE MARKET KEY COUNTRY LEVEL ANALYSIS, 2024–2034, (USD MILLION)
FIGURE 177 FINANCIAL OVERVIEW:
Key Players Analysis:
Medtronic-Headquartered in Dublin, Ireland, is a global leader in medical technology and therapies. The company specializes in insulin pumps and continuous glucose monitoring systems, particularly for diabetes management. Medtronic's innovative wearable solutions enhance patient compliance and improve glycemic control. Their focus on advanced technologies and partnerships with healthcare providers solidifies their position in the wearable drug delivery market. Insulet Corporation-Based in Acton, Massachusetts, is best known for its Omnipod Insulin Management System. This tubeless, waterproof insulin pump is designed for ease of use, allowing diabetic patients to manage their insulin delivery seamlessly. Insulet emphasizes patient-centric design and continuous innovation, aiming to enhance the quality of life for individuals with diabetes through its wearable drug delivery solutions.
Tandem Diabetes Care-Located in San Diego, California, specializes in advanced insulin delivery systems. Their tX2 insulin pump is known for its compact design and integration with continuous glucose monitors. Tandem's focus on user-friendly devices and digital health solutions enhances diabetes management. The company continually invests in research and development to improve its product offerings and expand its market presence.
Amgen-Headquartered in Thousand Oaks, California, is a biotechnology giant focused on developing innovative therapies for serious illnesses. The company produces wearable auto-injectors for delivering biologics, allowing patients to self-administer treatments conveniently. Amgen emphasizes patient adherence and ease of use in its drug delivery devices. The company is committed to advancing biotechnology and improving patient outcomes through cutting-edge solutions.
Ypsomed- Based in Burgdorf, Switzerland, specializes in the development of injection systems and infusion devices. The company offers a range of products, including wearable insulin pumps and drug delivery systems for various therapies. Ypsomed focuses on user-friendly designs and high-quality manufacturing, catering to patients with chronic conditions. Their commitment to innovation and sustainability positions them as a key player in the wearable drug delivery market.
Becton-Dickinson and Co. (BD)- is a global medical technology company based in Franklin Lakes, New Jersey. BD offers a variety of drug delivery devices, including auto-injectors and infusion systems. Their products are designed to improve patient safety and medication adherence. BD invests heavily in research and development to enhance the effectiveness of its wearable drug delivery solutions, focusing on technology integration and user experience.
Eli Lilly-Headquartered in Indianapolis, Indiana, is a major player in the pharmaceutical industry, specializing in diabetes care. The company produces innovative insulin delivery systems, including wearable devices that enhance patient adherence. Eli Lilly focuses on research-driven solutions, aiming to improve the quality of life for diabetic patients through advanced drug delivery technologies. Their commitment to innovation drives their growth in the wearable drug delivery sector.
Roche Diagnostics-Based in Basel, Switzerland, is a leading healthcare company known for its diagnostics and drug delivery systems. The company offers continuous glucose monitoring devices and insulin pumps for diabetes management. Roche emphasizes integrating technology into healthcare to enhance patient outcomes. Their focus on innovation and quality positions them as a significant player in the wearable drug delivery devices market.
Pfizer-Headquartered in New York City, is a global biopharmaceutical leader known for developing innovative therapies. The company produces wearable auto-injectors for self-administering biologic drugs. Pfizer's commitment to improving patient experiences and adherence drives its investment in drug delivery technology. Their robust research and development pipeline ensures the continuous advancement of their wearable devices, catering to diverse therapeutic needs. United Therapeutics-Based in Silver Spring, Maryland, focuses on developing and commercializing innovative therapies for chronic and life-threatening conditions. The company offers wearable drug delivery pumps for patients with pulmonary hypertension. United Therapeutics is committed to improving patient quality of life through advanced technologies. Their emphasis on innovation and patient-centric solutions solidifies their position in the wearable drug delivery devices market.
Market Key Players
Medtronic
Insulet Corporation
Tandem Diabetes Care
Amgen Inc.
Ypsomed AG
Becton, Dickinson and Co.
Eli Lilly and Company
Roche Diagnostics
Pfizer Inc.
United Therapeutics Corp.
Smiths Medical
Debiotech SA
Novo Nordisk A/S
AstraZeneca
Johnson & Johnson
Baxter International Inc.
West Pharmaceutical Services
CeQur SA
Unilife Corporation
Gerresheimer AG
Driver:
Rising Prevalence of Chronic Diseases
The increasing incidence of chronic diseases such as diabetes, cardiovascular conditions, and respiratory ailments drives the demand for wearable drug delivery devices. Patients require continuous and efficient medication management, and wearable devices offer a convenient solution, ensuring adherence to treatment regimens while minimizing hospital visits and enhancing overall patient outcomes.
Technological Advancements
Rapid advancements in technology, such as miniaturization, wireless connectivity, and smart sensors, are revolutionizing wearable drug delivery devices. These innovations enable real-time monitoring, personalized drug dosing, and enhanced patient engagement. The integration of artificial intelligence and data analytics further improves medication management, promoting efficient and effective therapies tailored to individual patient needs, thereby accelerating market growth.
Increasing Patient Preference for Home Care
A growing preference for home care solutions is influencing the wearable drug delivery devices market. Patients increasingly seek convenient and effective methods to manage their health from home, reducing the need for frequent hospital visits. Wearable devices provide autonomy and comfort, allowing individuals to administer medications at their convenience while ensuring ongoing health monitoring, thus enhancing the overall patient experience.
Restrain:
High Cost of Devices
The initial investment in wearable drug delivery devices can be significantly high, making them less accessible for patients and healthcare providers. The expense associated with advanced technology, maintenance, and insurance coverage may hinder widespread adoption. This financial barrier particularly affects lower-income patients and regions with limited healthcare budgets, leading to underutilization.
Regulatory Challenges
Navigating the complex regulatory landscape poses a significant challenge for manufacturers of wearable drug delivery devices. Regulatory approvals from authorities such as the FDA can be lengthy and unpredictable. Compliance with stringent guidelines for safety, efficacy, and manufacturing processes can delay product launches and increase development costs, deterring smaller companies from entering the market.
Opportunities:
Expansion in Emerging Markets
The increasing prevalence of chronic diseases in emerging markets presents a significant opportunity for wearable drug delivery devices. As healthcare infrastructure improves and more patients seek innovative solutions, manufacturers can capitalize on this growing demand by introducing affordable, user-friendly devices tailored to these regions, thereby expanding their market presence and enhancing patient access to essential therapies.
Integration of Advanced Technologies
The integration of artificial intelligence and IoT in wearable drug delivery devices offers a promising opportunity for innovation. By enabling real-time monitoring and personalized medication adjustments based on individual patient data, these technologies can improve treatment outcomes and enhance patient adherence. Companies that invest in developing smart, connected devices will likely gain a competitive edge in the market.
Trends:
Increased Focus on Chronic Disease Management
With the rise in chronic diseases such as diabetes and cardiovascular disorders, there’s a growing demand for wearable drug delivery devices tailored to long-term management. These devices offer convenient and efficient drug administration, improving patient compliance. As awareness of chronic health issues rises, manufacturers are innovating solutions that provide continuous monitoring and effective drug delivery for better health outcomes.
Recent Development:
In April 2024, Air Liquide, based in Paris, began constructing a state-of-the-art krypton and xenon purification facility in Cheonan, Chungnam Province. This facility, set to be completed in 2025, will leverage Air Liquide's expertise in extreme cryogenics to produce ultra-high purity gases tailored for the semiconductor and space industries.
Additionally, in February 2024, Air Liquide achieved a significant milestone by deploying 62 new small gas production units across the industrial merchant and electronics sectors. This deployment highlights the company's ability to meet rising customer demands with customized solutions that ensure a continuous gas supply, address specific production needs, and contribute to reduced carbon emissions.
Also in February 2024, Messer, headquartered in Germany, emerged as the leading bidder for the Federal Helium Assets auction conducted by the GSA. This acquisition reinforces Messer's commitment to providing essential resources across multiple sectors. With its established track record, Messer has been selected to operate the Cliffside Gas Plant in Amarillo, Texas, showcasing its reliability and safety in managing critical infrastructure.

 Aerospace And Defence
 Agriculture
 Automotive And Transportation
 Banking And Finance
 Business
 Chemicals And Materials
 Consumer And Retail
 Electronics And Semiconductors
 Food And Beverages
 Machinery & Equipments
 Manufacturing And Construction
 Medical Devices
 Others
 Pharmaceuticals And Healthcare
 Power And Energy
 Sports
 Technology

, By Application(Diabetes Management, Pain Management, Cardiovascular Diseases, Hormonal Disorders, Respiratory Diseases, Cancer Treatment, Autoimmune Diseases), Region and Key Players - Industry Segment Overview, Market Dynamics, Competitive Strategies, Trends and Forecast 2025-2034")
, By Application(Diabetes Management, Pain Management, Cardiovascular Diseases, Hormonal Disorders, Respiratory Diseases, Cancer Treatment, Autoimmune Diseases), Region and Key Players - Industry Segment Overview, Market Dynamics, Competitive Strategies, Trends and Forecast 2025-2034")
, By Application(Diabetes Management, Pain Management, Cardiovascular Diseases, Hormonal Disorders, Respiratory Diseases, Cancer Treatment, Autoimmune Diseases), Region and Key Players - Industry Segment Overview, Market Dynamics, Competitive Strategies, Trends and Forecast 2025-2034")
, By Application(Diabetes Management, Pain Management, Cardiovascular Diseases, Hormonal Disorders, Respiratory Diseases, Cancer Treatment, Autoimmune Diseases), Region and Key Players - Industry Segment Overview, Market Dynamics, Competitive Strategies, Trends and Forecast 2025-2034")

