
- Home
- Industries
 Aerospace And Defence
 Agriculture
 Automotive And Transportation
 Banking And Finance
 Business
 Chemicals And Materials
 Consumer And Retail
 Electronics And Semiconductors
 Food And Beverages
 Machinery & Equipments
 Manufacturing And Construction
 Medical Devices
 Others
 Pharmaceuticals And Healthcare
 Power And Energy
 Sports
 Technology
- Services
- News Room
- About us
- Contact Us
-
Web3-as-a-Service Market Size, Forecast Growth & Trends | 12.4% CAGR
Global Web3-as-a-Service (W3aaS) Market Size, Share & Analysis By Deployment Mode (Cloud, On-Premises), By Industry Vertical (Financial Services, Gaming and Entertainment, Media and Marketing, Supply Chain and Logistics, Healthcare, Others), Web3 Adoption Trends, Business Models & Forecast 2025–2034

Report Overview
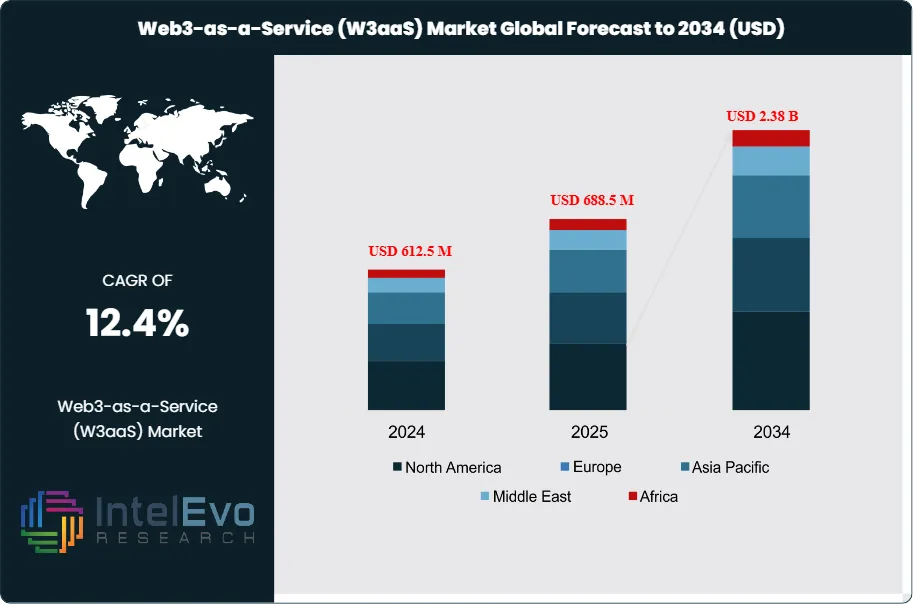
The Web3-as-a-Service (W3aaS) Market is valued at approximately USD 612.5 million in 2024 and is projected to reach nearly USD 2.38 billion by 2034, expanding at a CAGR of around 12.4% during 2025–2034. Enterprise adoption of decentralized infrastructure, tokenized workflows, and on-chain identity systems continues to accelerate global demand. As Web3 gaming, fintech, and cross-chain applications scale, W3aaS platforms are rapidly evolving into the backbone of next-generation digital ecosystems. The coming decade will be defined by interoperability, security-first architectures, and enterprise-grade blockchain orchestration.
Get More Information about this report -
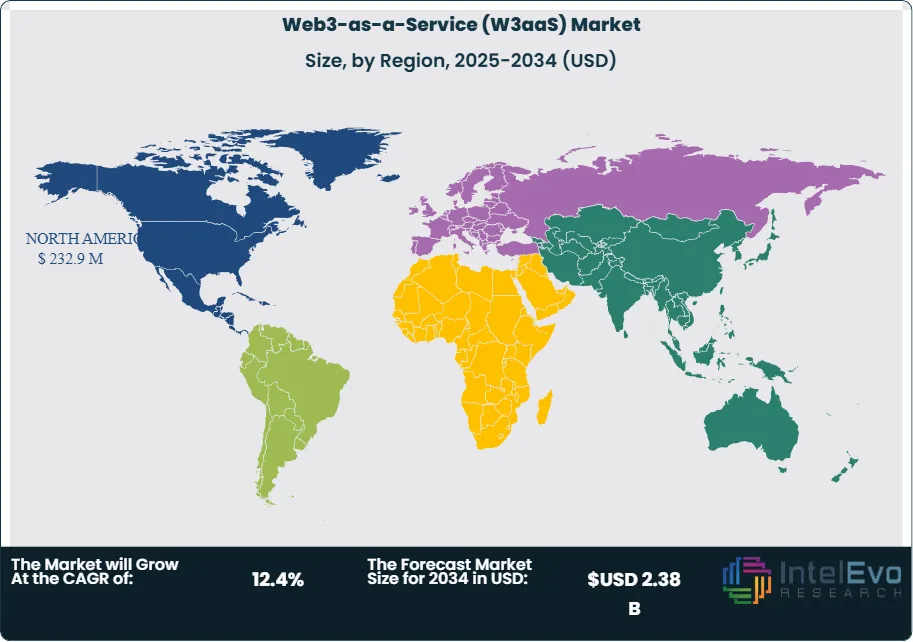
Request Free Sample ReportWhile still early in its maturity curve, the market is scaling beyond pilots as enterprises seek to harness decentralized infrastructure without owning the underlying complexity. North America currently sets the pace with over 40% share (USD 232.9 million in 2023), buoyed by cloud-native adoption and a deep vendor ecosystem, while Europe and Asia Pacific are accelerating on the back of data-sovereignty mandates, fintech innovation, and a surging Web3 gaming community. Size evolution over the decade is expected to be steady and resilient, with double-digit expansion supported by rising transaction volumes, broader dApp integration, and improved developer tooling that lowers time-to-production.
Demand-side catalysts include the push for tamper-evident data and auditability across supply chains, tokenized financial workflows, verifiable digital identity, and protected health records. On the supply side, hyperscalers and specialists are packaging node management, key custody, and smart-contract platforms into SLA-backed services that reduce cost and risk. Still, challenges persist: multi-chain fragmentation, uneven global regulation (notably KYC/AML and data-residency requirements), variable gas fees and latency, and an evolving threat landscape for smart contracts and wallets. The talent base is expanding yet scarce; an estimated 18,000 developers are active in open-source crypto/Web3 projects, signaling momentum but also highlighting the premium on skilled resources.
Technology innovation is reshaping adoption patterns. Interoperability layers and cross-chain messaging are easing portability of assets and logic; enhanced security primitives (HSM-backed custody, MPC wallets, and automated policy engines) are hardening operations; and user-friendly SDKs, APIs, and low-code orchestration are bringing non-specialist teams into the fold. Integration of DeFi and NFT modules within W3aaS stacks is widening use cases—from programmable payments to tokenized loyalty—while AI-assisted observability and anomaly detection improve uptime and compliance.
Regionally, North America remains the anchor, Europe is emerging as a compliance-driven adoptee, and Asia Pacific is an investment hotspot given vibrant gaming and fintech corridors; Web3 video games already count 73 million active users, a demand signal for scalable W3aaS back-ends. Funding is consolidating around picks-and-shovels: roughly 40% of Web3 startup capital targets data and analytics and about 20% goes to security, aligning with enterprise priorities for visibility and protection as the market advances toward its 2033 horizon.
 Market Size, Share & Analysis By Deployment Mode (Cloud, On-Premises), By Industry Vertical (Financial Services, Gaming and Entertainment, Media and Marketing, Supply Chain and Logistics, Healthcare, Others), Web3 Adoption Trends, Business Models & Forecast 2025–2034")
Key Takeaways
- Market Growth: The Web3-as-a-Service (W3aaS) market is projected to expand from USD 612.5 million in 2024 to USD 2.38 billion by 2034 at a 12.4% CAGR, propelled by enterprise demand for decentralized infrastructure, verifiable data, and faster dApp deployment. Momentum is reinforced by a growing builder base (~18,000 active open-source Web3 developers) and rising user activity in Web3 applications.
- Segment Dominance – Deployment Model: Cloud-based W3aaS commanded ~85% share in 2023, reflecting enterprises’ preference for elastic scaling, SLA-backed node management, and managed key/custody services. On-prem/private deployments remain a niche (~15%), typically adopted for strict data-residency or latency requirements.
- Segment Dominance – End Use: Financial Services led adoption with >31% market share in 2023 as banks, fintechs, and payment processors prioritize tokenized workflows, on-chain settlement, and compliance-ready identity rails. Early wins in cross-border payments and asset servicing are translating into sticky, consumption-based revenues for W3aaS providers.
- Driver: The need for tamper-evident records and auditability across supply chains, finance, and healthcare is accelerating W3aaS uptake; Web3 gaming’s >73 million active users further stress-test scale, pushing enterprises toward managed multi-chain back ends.
- Restraint: Regulatory fragmentation (KYC/AML, data-sovereignty) and smart-contract/security risks slow enterprise rollouts; notably, ~20% of Web3 startup funding targets security, signaling ongoing remediation costs and heightened diligence in vendor selection.
- Opportunity: Data, analytics, and observability modules are a clear white space—~40% of Web3 venture funding flows to data/analytics, and W3aaS platforms bundling cross-chain monitoring, policy automation, and compliance reporting are poised to outgrow the core market (≈14–16% CAGR through 2033).
- Trend: Rapid maturation of interoperability (cross-chain messaging/bridges), MPC/HSM-backed wallets, and low-code orchestration is lowering time-to-production; bundling of DeFi and NFT services into W3aaS stacks is broadening use cases from programmable payments to tokenized loyalty.
- Regional Analysis: North America led with ~40% share (USD 232.9 million) in 2023 on the back of advanced cloud uptake and vendor depth; Europe is scaling under compliance-driven initiatives (data-sovereignty, MiCA-aligned pilots). Asia Pacific is the fastest-rising hotspot—supported by gaming and fintech corridors—and is expected to post low-teens CAGR (~12–14%) to 2033, narrowing the gap with North America.
Deployment Mode Analysis
Cloud remains the structural backbone of Web3-as-a-Service in 2025, sustaining its historical leadership (≈85% share in 2023) as enterprises prioritize elastic scale, rapid rollout cycles, and SLA-backed node operations over capex-heavy builds. Managed platforms increasingly bundle multi-chain connectivity, MPC/HSM-based key management, audit-ready logging, and policy automation—cutting time-to-production from months to weeks and lowering total cost of ownership for pilot-to-production transitions. With the overall W3aaS market tracking a ~10–11% CAGR toward 2033, cloud deployments are expected to capture the majority of incremental spend through the medium term.
On-premises (and private cloud) adoption is steady where data-sovereignty, latency, and control are non-negotiable—particularly in regulated finance, public sector, and critical infrastructure. Organizations are deploying permissioned networks behind firewalls, integrating HSMs, and using selective bridging to public chains for settlement or provenance. The operating model is trending hybrid: production workloads and observability live in managed cloud, while sensitive smart contracts and keys reside on-prem, a pattern likely to keep on-prem share below one-fifth but growing in absolute terms as compliance workloads scale.
Industry Vertical Analysis
BFSI continues to anchor demand in 2025, building on a >37% share in 2023 as banks, fintechs, and market infrastructures move from proofs of concept to production for tokenized deposits, collateral, and programmable payments. Institutions are prioritizing on-chain settlement, KYC/AML-aligned identity rails, and asset servicing, with vendor selection weighted toward platforms offering audited security controls and sovereign hosting options. This segment’s spend profile is durable, subscription-heavy, and increasingly tied to mission-critical integration with core banking and treasury systems.
Beyond finance, adoption is broadening. Retail & e-commerce are leveraging tokenized loyalty and verifiable supply-chain provenance; media & entertainment are piloting rights management and fan engagement tokens; healthcare & pharmaceuticals focus on immutable clinical data, consent, and cold-chain tracking; and IT & telecom utilize decentralized identity and network telemetry. Ecosystem signals reinforce the trajectory: an active developer base (~18,000 contributors to open-source Web3) and large user communities in Web3 gaming (>73 million active users) stress-test scale and observability—areas where W3aaS providers are investing heavily. Data/analytics and security remain priority capabilities, drawing ~40% and ~20% of Web3 startup funding respectively, and shaping enterprise feature roadmaps.
Looking ahead, regulated industries (finance, healthcare, life sciences) should post above-market growth given compliance-driven digitization, while consumer-facing verticals (retail, media, gaming) accelerate as wallets and on-ramps become more invisible to end users. Providers that bundle cross-chain data services, policy engines, and automated compliance reporting are positioned to outgrow the core market.
Regional Analysis
North America maintains lead position into 2025, building on ~40% share (USD 232.9 million in 2023) thanks to deep cloud penetration, a mature vendor landscape, and enterprise budgets geared to production-grade SLAs. Europe is scaling under clearer rulemaking (e.g., MiCA-aligned pilots) and strong data-sovereignty requirements, favoring providers with sovereign-cloud and on-prem options. Both regions are emphasizing interoperability, security certifications, and integration with existing identity and payments infrastructure.
Asia Pacific is the fastest-rising growth engine, underpinned by vibrant gaming and fintech corridors in markets such as South Korea, Japan, Singapore, and India. As super-apps and payment networks experiment with tokenized loyalty and remittances, APAC is expected to expand at low-teens CAGR through 2033, narrowing the revenue gap with North America. Latin America is emerging on the back of stablecoin remittances and supply-chain provenance in agribusiness, while the Middle East & Africa—led by the UAE and Saudi Arabia—are becoming investment hotspots for government-backed digital-asset and identity initiatives.
In sum, regional dynamics increasingly reflect policy clarity and digital-infrastructure maturity: North America and Europe drive high-value, compliance-centric deployments; APAC scales consumer and fintech volume; and LatAm and MEA gain momentum through targeted public-private programs. Providers that localize compliance, offer sovereign hosting, and deliver cross-region data portability will capture disproportionate share of the next wave of W3aaS growth.
Get More Information about this report -
Request Free Sample ReportMarket Key Segments
By Deployment Mode
- Cloud
- On-Premises
By Industry Vertical
- Financial Services
- Gaming and Entertainment
- Media and Marketing
- Supply Chain and Logistics
- Healthcare
- Others
Regions
- North America
- Latin America
- East Asia And Pacific
- Sea And South Asia
- Eastern Europe
- Western Europe
- Middle East & Africa
| Report Attribute | Details |
| Market size (2024) | USD 612.5 M |
| Forecast Revenue (2034) | USD 2.38 B |
| CAGR (2024-2034) | 12.4% |
| Historical data | 2020-2023 |
| Base Year For Estimation | 2024 |
| Forecast Period | 2025-2034 |
| Report coverage | Revenue Forecast, Competitive Landscape, Market Dynamics, Growth Factors, Trends and Recent Developments |
| Segments covered | By Deployment Mode (Cloud, On-Premises), By Industry Vertical (Financial Services, Gaming and Entertainment, Media and Marketing, Supply Chain and Logistics, Healthcare, Others) |
| Research Methodology |
|
| Regional scope |
|
| Competitive Landscape | Avalanche Foundation, Cardano, Solana Labs, Chainlink, ConsenSys, Binance Smart Chain, Polkadot, Alchemy, Ethereum Foundation, Infura, Bison Trails, Other Key Players |
| Customization Scope | Customization for segments, region/country-level will be provided. Moreover, additional customization can be done based on the requirements. |
| Pricing and Purchase Options | Avail customized purchase options to meet your exact research needs. We have three licenses to opt for: Single User License, Multi-User License (Up to 5 Users), Corporate Use License (Unlimited User and Printable PDF). |
 Market Size, Share & Analysis By Deployment Mode (Cloud, On-Premises), By Industry Vertical (Financial Services, Gaming and Entertainment, Media and Marketing, Supply Chain and Logistics, Healthcare, Others), Web3 Adoption Trends, Business Models & Forecast 2025–2034")
 Market Size, Share & Analysis By Deployment Mode (Cloud, On-Premises), By Industry Vertical (Financial Services, Gaming and Entertainment, Media and Marketing, Supply Chain and Logistics, Healthcare, Others), Web3 Adoption Trends, Business Models & Forecast 2025–2034")
 Market Size, Share & Analysis By Deployment Mode (Cloud, On-Premises), By Industry Vertical (Financial Services, Gaming and Entertainment, Media and Marketing, Supply Chain and Logistics, Healthcare, Others), Web3 Adoption Trends, Business Models & Forecast 2025–2034")

Select Licence Type
Connect with our sales team
Web3-as-a-Service (W3aaS) Market
Published Date : 24 Nov 2025 | Formats :Why IntelEvoResearch
100%
Customer
Satisfaction
24x7+
Availability - we are always
there when you need us
200+
Fortune 50 Companies trust
IntelEvoResearch
80%
of our reports are exclusive
and first in the industry
100%
more data
and analysis
1000+
reports published
till date
