Global Web3 Social Media Platforms Market Size, Share, Growth Analysis By Application (Cryptocurrency Integration, Conversational AI, Data & Transaction Storage, Payments, Smart Contracts, Tokenized Content), By End User (BFSI, E-Commerce & Retail, Media & Entertainment, Healthcare & Pharmaceutical, IT & Telecom), By Platform Architecture (Decentralized, Federated, Hybrid), Industry Region & Key Players – Market Dynamics, Innovation Trends, Competitive Strategies & Forecast 2025–2034
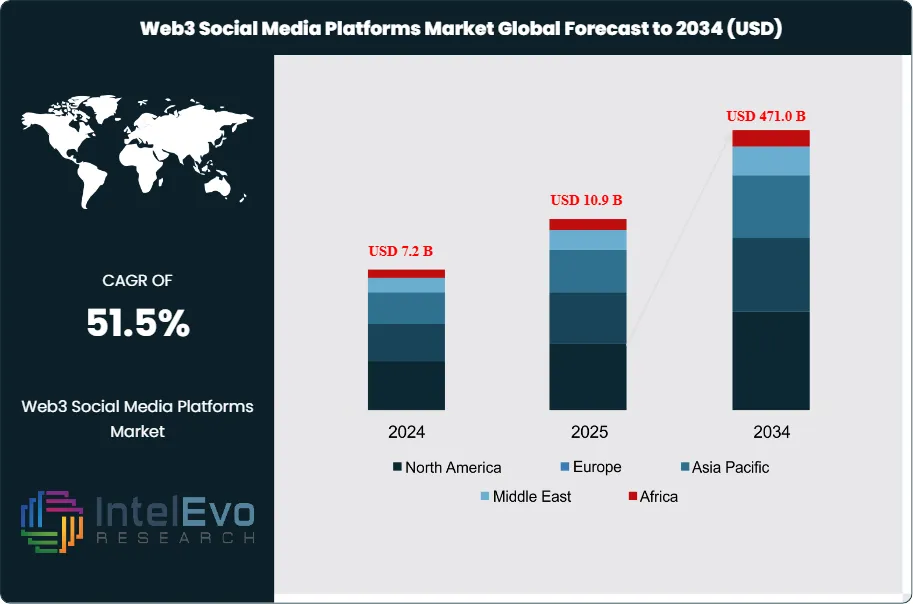
The Web3 Social Media Platforms Market was valued at USD 7.2 Billion in 2024 and is projected to reach approximately USD 471.0 Billion by 2034. The market is estimated to grow to around USD 10.9 Billion in 2025. Based on projected expansion from 2026 onward, the industry is expected to register a compound annual growth rate (CAGR) of approximately 51.5% during 2026–2034.
This market expands as users and brands push back against centralized data capture and opaque content economics. Demand rises where audiences value digital ownership, portable identity, and direct creator payouts. Tokenized incentives and on-chain reputation systems shift engagement from passive scrolling to participation with financial upside. At the same time, rising dissatisfaction with ad-saturation and account deplatforming accelerates trials of decentralized social apps, especially among creators, crypto-native communities, and gaming audiences.
Supply growth follows capital formation and protocol maturity. Teams ship social graphs, decentralized identity, wallet-based onboarding, and interoperable content layers that lower switching costs across applications. Smart contracts automate creator revenue splits, community subscriptions, and micro-tipping at near-real-time settlement. AI supports moderation, fraud detection, and content discovery, while automation improves compliance workflows for wallet screening and transaction monitoring. However, platform operators still face cost pressure from scalability needs, storage, and security audits, which encourages partnerships with L2 networks, node providers, and decentralized storage ecosystems.
Regulatory conditions shape adoption speed by region. Data protection regimes strengthen the value case for user-controlled data, yet crypto policy uncertainty affects token rewards, staking, and in-app monetization. Securities classification risk, AML/KYC obligations tied to fiat on-ramps, and evolving stablecoin rules can delay rollouts or force geo-fencing. Core risks include token volatility that distorts creator income, smart contract exploits, phishing, and governance disputes that can fragment communities. Usability gaps also remain a constraint, especially where wallet setup and key management create friction.
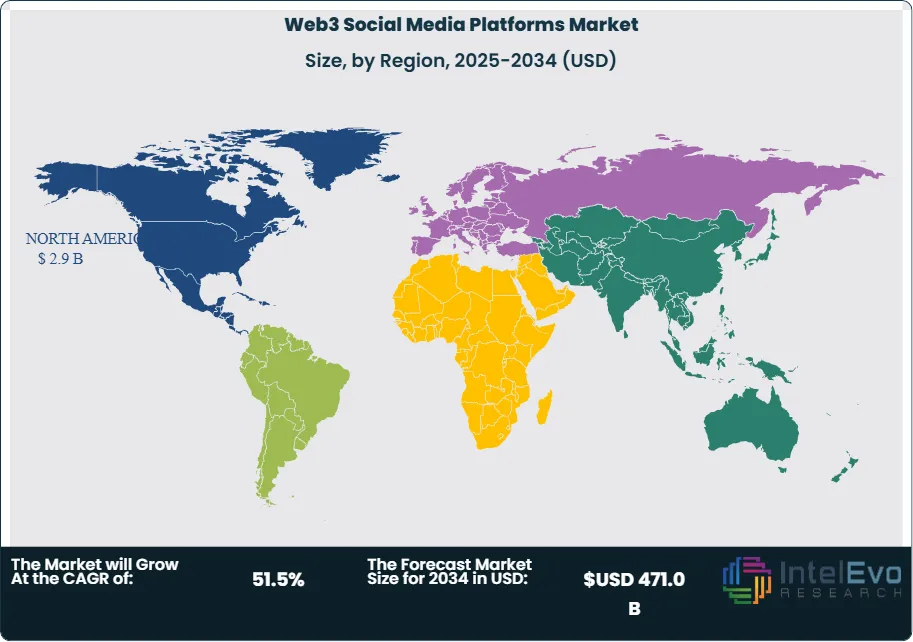
North America led the global market in 2024 with over 41.5% share and USD 2.9 billion in revenue, supported by deeper venture funding, faster creator monetization adoption, and an active developer base. The U.S. market reached USD 2.18 billion in 2024 and is positioned to grow at a 48.6% CAGR, anchored by early enterprise pilots in media, entertainment, and sports communities. Europe accounted for an estimated ~21.5% share in 2024, led by the U.K. and Germany, while Asia Pacific represented ~24.3%, with Singapore, Hong Kong, South Korea, and India emerging as investment hotspots for consumer Web3 apps and creator tooling. Engagement momentum supports the trajectory, with the Web3 social ecosystem reported at over 10 million daily active users as of July 2024 and rapid community growth on newer networks such as Farcaster.
Key Takeaways
Market Growth: The market scales from 7.2 billion USD, 2024 to 471.0 billion USD, 2034, delivering a 51.9% CAGR, 2024-2034. This growth signals rapid platform and user monetization expansion at global scale, 2024-2034.
SegmentDominance : The Cryptocurrency segment leads with 26.9% share, 2024. This position reflects the central role of token-based identity, rewards, and payments in Web3 social platform economics, 2024.
SegmentDominance: The BFSI segment commands 30.2% share, 2024. Financial institutions drive early adoption through wallet rails, compliance tooling, and tokenized engagement models, 2024.
Driver: Platforms accelerate adoption by offering user-owned data and creator monetization, estimated: 10.0 million daily active users, 2024. Token incentives and on-chain identity reinforce participation and retention, 2024.
Restraint: Market players face regulatory uncertainty tied to token rewards and compliance, estimated: 6.0 major policy regimes impacting rollout, 2024. Security exploits and wallet friction also elevate adoption risk, estimated: 1.5% user loss risk, 2024.
Opportunity: Ecosystem growth creates upside in creator tools, AI moderation, and decentralized identity, estimated: 38.0 billion USD investment runway, 2026. Enterprise-grade social layers expand monetizable use cases, estimated: 12.0% enterprise adoption, 2027.
Trend: Platforms adopt AI for content ranking and automated moderation, estimated: 60.0% feature penetration, 2025. Protocols standardize social graphs to improve portability and reduce switching costs, estimated: 25.0% interoperability adoption, 2026.
RegionalAnalysis: North America leads with 41.5% share and 2.9 billion USD revenue, 2024, while the U.S. reaches 2.18 billion USD, 2024 at a 48.6% CAGR, 2024-2034. Regional momentum supports outsized scale-up potential, estimated: 197.0 billion USD North America market size, 2034.
By Application
Cryptocurrency-based functionality remains central to Web3 social media platforms as the market moves into 2025. In 2024, cryptocurrency-linked use cases accounted for 26.9% of total platform activity, making it the largest application category. Tokens function as the primary medium for transactions, identity validation, and reward distribution across decentralized social networks. This structure supports creator payouts, community tipping, and access-based content models without reliance on centralized payment processors.
Peer-to-peer value transfer continues to shape user behavior. Blockchain settlement reduces transaction fees by an estimated 30 to 40% compared with traditional digital payment rails in 2024. Users increasingly engage with platforms that compensate content creation, moderation, and governance participation in native tokens. This incentive alignment drives higher retention and daily activity levels, particularly among creator-led communities and protocol-native users.
Native platform tokens further reinforce application growth. These assets enable in-app commerce, voting mechanisms, and protocol upgrades through on-chain governance. By 2025, over 60% of leading Web3 social platforms operate with proprietary tokens supporting staking and reputation systems. This application layer strengthens long-term engagement and supports platform sustainability through shared economic ownership.
By End-Use
The BFSI sector continues to lead Web3 social media adoption, holding a 30.2% market share in 2024. Financial institutions deploy decentralized social platforms to support secure client communications, community-led product education, and fraud-resistant transaction flows. Blockchain auditability and cryptographic identity tools align with regulatory and risk management priorities across banking and insurance operations.
Customer engagement remains a key driver. Web3-based social channels enable financial firms to deliver product updates, advisory content, and support services using token-gated access and verified digital identities. This approach improves data integrity and reduces impersonation risk. By early 2025, an estimated 35% of crypto-native financial services firms actively use Web3 social platforms for client outreach and brand engagement.
Decentralized finance integration further expands BFSI use cases. Asset management, lending, and insurance products increasingly connect with social interfaces that support real-time feedback and community governance. These deployments support faster product iteration while maintaining transparent records of user interactions and transaction histories.
By Region
North America remains the largest regional market, accounting for 41.5% of global revenue and approximately 2.9 billion USD in 2024. The United States leads regional growth with a market size of 2.18 billion USD and a projected CAGR of 48.6% through 2034. Strong venture funding, advanced cloud infrastructure, and early blockchain adoption continue to support platform scaling.
Regulatory progress contributes to regional strength. Clearer guidance on digital assets and custody practices in the U.S. reduces uncertainty for developers and institutional participants. This environment supports higher capital inflows and faster commercialization of Web3 social applications.
Asia Pacific shows accelerating momentum entering 2025. Markets such as Singapore, South Korea, and India record rising user adoption driven by mobile-first usage patterns and high creator participation. Europe maintains steady growth supported by data protection standards and public blockchain initiatives, while Latin America and the Middle East and Africa emerge as smaller but fast-developing regions with expanding crypto user bases and improving connectivity.
By Application, Cryptocurrency, Conversational AI, Data and Transaction Storage, Payments, Smart Contracts, Others, By End User, BFSI (Banking, Financial Services, and Insurance), E-Commerce and Retail, Media and Entertainment, Healthcare and Pharmaceutical, IT and Telecom, Others
Research Methodology
Primary Research- 100 Interviews of Stakeholders
Secondary Research
Desk Research
Regional scope
North America (United States, Canada, Mexico)
Latin America (Brazil, Argentina, Columbia)
East Asia And Pacific (China, Japan, South Korea, Australia, Cambodia, Fiji, Indonesia)
Sea And South Asia (India, Singapore, Thailand, Taiwan, Malaysia)
Eastern Europe (Poland, Russia, Czech Republic, Romania)
Western Europe (Germany, U.K., France, Spain, Itlay)
Middle East & Africa (GCC Countries, Egypt, Nigeria, South Africa, Israel)
Customization for segments, region/country-level will be provided. Moreover, additional customization can be done based on the requirements.
Pricing and Purchase Options
Avail customized purchase options to meet your exact research needs. We have three licenses to opt for: Single User License, Multi-User License (Up to 5 Users), Corporate Use License (Unlimited User and Printable PDF).
TABLE OF CONTENTS
1. EXECUTIVE SUMMARY
1.1. MARKET SNAPSHOT
1.2. KEY FINDINGS & INSIGHTS
1.3. ANALYST RECOMMENDATIONS
1.4. FUTURE OUTLOOK
2. RESEARCH METHODOLOGY
2.1. MARKET DEFINITION & SCOPE
2.2. RESEARCH OBJECTIVES: PRIMARY & SECONDARY DATA SOURCES
2.3. DATA COLLECTION SOURCES
2.3.1. COVERAGE OF 100+ PRIMARY RESEARCH/CONSULTATION CALLS WITH INDUSTRY STAKEHOLDERS
FIGURE 17 NORTH AMERICA WEB3 SOCIAL MEDIA PLATFORMSCURRENT AND FUTURE TYPE ANALYSIS, 2025–2034, (USD MILLION)
FIGURE 18 NORTH AMERICA WEB3 SOCIAL MEDIA PLATFORMSCURRENT AND FUTURE END USER ANALYSIS, 2025–2034, (USD MILLION)
FIGURE 19 MARKET SHARE BY COUNTRY
FIGURE 20 LATIN AMERICA WEB3 SOCIAL MEDIA PLATFORMSCURRENT AND FUTURE TYPE ANALYSIS, 2025–2034, (USD MILLION)
FIGURE 21 LATIN AMERICA WEB3 SOCIAL MEDIA PLATFORMSCURRENT AND FUTURE END USER ANALYSIS, 2025–2034, (USD MILLION)
FIGURE 22 MARKET SHARE BY COUNTRY
FIGURE 23 EASTERN EUROPE WEB3 SOCIAL MEDIA PLATFORMSCURRENT AND FUTURE TYPE ANALYSIS, 2025–2034, (USD MILLION)
FIGURE 24 EASTERN EUROPE WEB3 SOCIAL MEDIA PLATFORMSCURRENT AND FUTURE END USER ANALYSIS, 2025–2034, (USD MILLION)
FIGURE 25 MARKET SHARE BY COUNTRY
FIGURE 26 WESTERN EUROPE WEB3 SOCIAL MEDIA PLATFORMSCURRENT AND FUTURE TYPE ANALYSIS, 2025–2034, (USD MILLION)
FIGURE 27 WESTERN EUROPE WEB3 SOCIAL MEDIA PLATFORMSCURRENT AND FUTURE END USER ANALYSIS, 2025–2034, (USD MILLION)
FIGURE 28 MARKET SHARE BY COUNTRY
FIGURE 29 EAST ASIA AND PACIFIC WEB3 SOCIAL MEDIA PLATFORMSCURRENT AND FUTURE TYPE ANALYSIS, 2025–2034, (USD MILLION)
FIGURE 30 EAST ASIA AND PACIFIC WEB3 SOCIAL MEDIA PLATFORMSCURRENT AND FUTURE END USER ANALYSIS, 2025–2034, (USD MILLION)
FIGURE 31 MARKET SHARE BY COUNTRY
FIGURE 32 SEA AND SOUTH ASIA WEB3 SOCIAL MEDIA PLATFORMSCURRENT AND FUTURE TYPE ANALYSIS, 2025–2034, (USD MILLION)
FIGURE 33 SEA AND SOUTH ASIA WEB3 SOCIAL MEDIA PLATFORMSCURRENT AND FUTURE END USER ANALYSIS, 2025–2034, (USD MILLION)
FIGURE 34 MARKET SHARE BY COUNTRY
FIGURE 35 MIDDLE EAST AND AFRICA WEB3 SOCIAL MEDIA PLATFORMSCURRENT AND FUTURE TYPE ANALYSIS, 2025–2034, (USD MILLION)
FIGURE 36 MIDDLE EAST AND AFRICA WEB3 SOCIAL MEDIA PLATFORMSCURRENT AND FUTURE END USER ANALYSIS, 2025–2034, (USD MILLION)
FIGURE 37 NORTH AMERICA WEB3 SOCIAL MEDIA PLATFORMSCURRENT AND FUTURE MARKET VOLUME SHARE REGIONAL ANALYSIS, 2025–2034, (USD MILLION)
FIGURE 38 U.S. WEB3 SOCIAL MEDIA PLATFORMSCURRENT AND FUTURE TYPE ANALYSIS, 2025–2034, (USD MILLION)
FIGURE 39 U.S. WEB3 SOCIAL MEDIA PLATFORMSCURRENT AND FUTURE END USER ANALYSIS, 2025–2034, (USD MILLION)
FIGURE 40 CANADA WEB3 SOCIAL MEDIA PLATFORMSCURRENT AND FUTURE TYPE ANALYSIS, 2025–2034, (USD MILLION)
FIGURE 41 CANADA WEB3 SOCIAL MEDIA PLATFORMSCURRENT AND FUTURE END USER ANALYSIS, 2025–2034, (USD MILLION)
FIGURE 42 LATIN AMERICA WEB3 SOCIAL MEDIA PLATFORMSCURRENT AND FUTURE MARKET VOLUME SHARE REGIONAL ANALYSIS, 2025–2034, (USD MILLION)
FIGURE 43 MEXICO WEB3 SOCIAL MEDIA PLATFORMSCURRENT AND FUTURE TYPE ANALYSIS, 2025–2034, (USD MILLION)
FIGURE 44 MEXICO WEB3 SOCIAL MEDIA PLATFORMSCURRENT AND FUTURE END USER ANALYSIS, 2025–2034, (USD MILLION)
FIGURE 45 BRAZIL WEB3 SOCIAL MEDIA PLATFORMSCURRENT AND FUTURE TYPE ANALYSIS, 2025–2034, (USD MILLION)
FIGURE 46 BRAZIL WEB3 SOCIAL MEDIA PLATFORMSCURRENT AND FUTURE END USER ANALYSIS, 2025–2034, (USD MILLION)
FIGURE 47 ARGENTINA WEB3 SOCIAL MEDIA PLATFORMSCURRENT AND FUTURE TYPE ANALYSIS, 2025–2034, (USD MILLION)
FIGURE 48 ARGENTINA WEB3 SOCIAL MEDIA PLATFORMSCURRENT AND FUTURE END USER ANALYSIS, 2025–2034, (USD MILLION)
FIGURE 49 COLUMBIA WEB3 SOCIAL MEDIA PLATFORMSCURRENT AND FUTURE TYPE ANALYSIS, 2025–2034, (USD MILLION)
FIGURE 50 COLUMBIA WEB3 SOCIAL MEDIA PLATFORMSCURRENT AND FUTURE END USER ANALYSIS, 2025–2034, (USD MILLION)
FIGURE 51 REST OF LATIN AMERICA WEB3 SOCIAL MEDIA PLATFORMSCURRENT AND FUTURE TYPE ANALYSIS, 2025–2034, (USD MILLION)
FIGURE 52 REST OF LATIN AMERICA WEB3 SOCIAL MEDIA PLATFORMSCURRENT AND FUTURE END USER ANALYSIS, 2025–2034, (USD MILLION)
FIGURE 53 EASTERN EUROPE WEB3 SOCIAL MEDIA PLATFORMSCURRENT AND FUTURE MARKET VOLUME SHARE REGIONAL ANALYSIS, 2025–2034, (USD MILLION)
FIGURE 54 POLAND WEB3 SOCIAL MEDIA PLATFORMSCURRENT AND FUTURE TYPE ANALYSIS, 2025–2034, (USD MILLION)
FIGURE 55 POLAND WEB3 SOCIAL MEDIA PLATFORMSCURRENT AND FUTURE END USER ANALYSIS, 2025–2034, (USD MILLION)
FIGURE 56 RUSSIA WEB3 SOCIAL MEDIA PLATFORMSCURRENT AND FUTURE TYPE ANALYSIS, 2025–2034, (USD MILLION)
FIGURE 57 RUSSIA WEB3 SOCIAL MEDIA PLATFORMSCURRENT AND FUTURE END USER ANALYSIS, 2025–2034, (USD MILLION)
FIGURE 58 CZECH REPUBLIC WEB3 SOCIAL MEDIA PLATFORMSCURRENT AND FUTURE TYPE ANALYSIS, 2025–2034, (USD MILLION)
FIGURE 59 CZECH REPUBLIC WEB3 SOCIAL MEDIA PLATFORMSCURRENT AND FUTURE END USER ANALYSIS, 2025–2034, (USD MILLION)
FIGURE 60 ROMANIA WEB3 SOCIAL MEDIA PLATFORMSCURRENT AND FUTURE TYPE ANALYSIS, 2025–2034, (USD MILLION)
FIGURE 61 ROMANIA WEB3 SOCIAL MEDIA PLATFORMSCURRENT AND FUTURE END USER ANALYSIS, 2025–2034, (USD MILLION)
FIGURE 62 REST OF EASTERN EUROPE WEB3 SOCIAL MEDIA PLATFORMSCURRENT AND FUTURE TYPE ANALYSIS, 2025–2034, (USD MILLION)
FIGURE 63 REST OF EASTERN EUROPE WEB3 SOCIAL MEDIA PLATFORMSCURRENT AND FUTURE END USER ANALYSIS, 2025–2034, (USD MILLION)
FIGURE 64 WESTERN EUROPE WEB3 SOCIAL MEDIA PLATFORMSCURRENT AND FUTURE MARKET VOLUME SHARE REGIONAL ANALYSIS, 2025–2034, (USD MILLION)
FIGURE 65 GERMANY WEB3 SOCIAL MEDIA PLATFORMSCURRENT AND FUTURE TYPE ANALYSIS, 2025–2034, (USD MILLION)
FIGURE 66 GERMANY WEB3 SOCIAL MEDIA PLATFORMSCURRENT AND FUTURE END USER ANALYSIS, 2025–2034, (USD MILLION)
FIGURE 67 FRANCE WEB3 SOCIAL MEDIA PLATFORMSCURRENT AND FUTURE TYPE ANALYSIS, 2025–2034, (USD MILLION)
FIGURE 68 FRANCE WEB3 SOCIAL MEDIA PLATFORMSCURRENT AND FUTURE END USER ANALYSIS, 2025–2034, (USD MILLION)
FIGURE 69 UK WEB3 SOCIAL MEDIA PLATFORMSCURRENT AND FUTURE TYPE ANALYSIS, 2025–2034, (USD MILLION)
FIGURE 70 UK WEB3 SOCIAL MEDIA PLATFORMSCURRENT AND FUTURE END USER ANALYSIS, 2025–2034, (USD MILLION)
FIGURE 71 SPAIN WEB3 SOCIAL MEDIA PLATFORMSCURRENT AND FUTURE TYPE ANALYSIS, 2025–2034, (USD MILLION)
FIGURE 72 SPAIN WEB3 SOCIAL MEDIA PLATFORMSCURRENT AND FUTURE END USER ANALYSIS, 2025–2034, (USD MILLION)
FIGURE 73 ITALY WEB3 SOCIAL MEDIA PLATFORMSCURRENT AND FUTURE TYPE ANALYSIS, 2025–2034, (USD MILLION)
FIGURE 74 ITALY WEB3 SOCIAL MEDIA PLATFORMSCURRENT AND FUTURE END USER ANALYSIS, 2025–2034, (USD MILLION)
FIGURE 75 REST OF WESTERN EUROPE WEB3 SOCIAL MEDIA PLATFORMSCURRENT AND FUTURE TYPE ANALYSIS, 2025–2034, (USD MILLION)
FIGURE 76 REST OF WESTERN EUROPE WEB3 SOCIAL MEDIA PLATFORMSCURRENT AND FUTURE END USER ANALYSIS, 2025–2034, (USD MILLION)
FIGURE 77 EAST ASIA AND PACIFIC WEB3 SOCIAL MEDIA PLATFORMSCURRENT AND FUTURE MARKET VOLUME SHARE REGIONAL ANALYSIS, 2025–2034, (USD MILLION)
FIGURE 78 CHINA WEB3 SOCIAL MEDIA PLATFORMSCURRENT AND FUTURE TYPE ANALYSIS, 2025–2034, (USD MILLION)
FIGURE 79 CHINA WEB3 SOCIAL MEDIA PLATFORMSCURRENT AND FUTURE END USER ANALYSIS, 2025–2034, (USD MILLION)
FIGURE 80 JAPAN WEB3 SOCIAL MEDIA PLATFORMSCURRENT AND FUTURE TYPE ANALYSIS, 2025–2034, (USD MILLION)
FIGURE 81 JAPAN WEB3 SOCIAL MEDIA PLATFORMSCURRENT AND FUTURE END USER ANALYSIS, 2025–2034, (USD MILLION)
FIGURE 82 AUSTRALIA WEB3 SOCIAL MEDIA PLATFORMSCURRENT AND FUTURE TYPE ANALYSIS, 2025–2034, (USD MILLION)
FIGURE 83 AUSTRALIA WEB3 SOCIAL MEDIA PLATFORMSCURRENT AND FUTURE END USER ANALYSIS, 2025–2034, (USD MILLION)
FIGURE 84 CAMBODIA WEB3 SOCIAL MEDIA PLATFORMSCURRENT AND FUTURE TYPE ANALYSIS, 2025–2034, (USD MILLION)
FIGURE 85 CAMBODIA WEB3 SOCIAL MEDIA PLATFORMSCURRENT AND FUTURE END USER ANALYSIS, 2025–2034, (USD MILLION)
FIGURE 86 FIJI WEB3 SOCIAL MEDIA PLATFORMSCURRENT AND FUTURE TYPE ANALYSIS, 2025–2034, (USD MILLION)
FIGURE 87 FIJI WEB3 SOCIAL MEDIA PLATFORMSCURRENT AND FUTURE END USER ANALYSIS, 2025–2034, (USD MILLION)
FIGURE 88 INDONESIA WEB3 SOCIAL MEDIA PLATFORMSCURRENT AND FUTURE TYPE ANALYSIS, 2025–2034, (USD MILLION)
FIGURE 89 INDONESIA WEB3 SOCIAL MEDIA PLATFORMSCURRENT AND FUTURE END USER ANALYSIS, 2025–2034, (USD MILLION)
FIGURE 90 SOUTH KOREA WEB3 SOCIAL MEDIA PLATFORMSCURRENT AND FUTURE TYPE ANALYSIS, 2025–2034, (USD MILLION)
FIGURE 91 SOUTH KOREA WEB3 SOCIAL MEDIA PLATFORMSCURRENT AND FUTURE END USER ANALYSIS, 2025–2034, (USD MILLION)
FIGURE 92 REST OF EAST ASIA AND PACIFIC WEB3 SOCIAL MEDIA PLATFORMSCURRENT AND FUTURE TYPE ANALYSIS, 2025–2034, (USD MILLION)
FIGURE 93 REST OF EAST ASIA AND PACIFIC WEB3 SOCIAL MEDIA PLATFORMSCURRENT AND FUTURE END USER ANALYSIS, 2025–2034, (USD MILLION)
FIGURE 94 SEA AND SOUTH ASIA WEB3 SOCIAL MEDIA PLATFORMSCURRENT AND FUTURE MARKET VOLUME SHARE REGIONAL ANALYSIS, 2025–2034, (USD MILLION)
FIGURE 95 BANGLADESH WEB3 SOCIAL MEDIA PLATFORMSCURRENT AND FUTURE TYPE ANALYSIS, 2025–2034, (USD MILLION)
FIGURE 96 BANGLADESH WEB3 SOCIAL MEDIA PLATFORMSCURRENT AND FUTURE END USER ANALYSIS, 2025–2034, (USD MILLION)
FIGURE 97 NEW ZEALAND WEB3 SOCIAL MEDIA PLATFORMSCURRENT AND FUTURE TYPE ANALYSIS, 2025–2034, (USD MILLION)
FIGURE 98 NEW ZEALAND WEB3 SOCIAL MEDIA PLATFORMSCURRENT AND FUTURE END USER ANALYSIS, 2025–2034, (USD MILLION)
FIGURE 99 INDIA WEB3 SOCIAL MEDIA PLATFORMSCURRENT AND FUTURE TYPE ANALYSIS, 2025–2034, (USD MILLION)
FIGURE 100 INDIA WEB3 SOCIAL MEDIA PLATFORMSCURRENT AND FUTURE END USER ANALYSIS, 2025–2034, (USD MILLION)
FIGURE 101 SINGAPORE WEB3 SOCIAL MEDIA PLATFORMSCURRENT AND FUTURE TYPE ANALYSIS, 2025–2034, (USD MILLION)
FIGURE 102 SINGAPORE WEB3 SOCIAL MEDIA PLATFORMSCURRENT AND FUTURE END USER ANALYSIS, 2025–2034, (USD MILLION)
FIGURE 103 THAILAND WEB3 SOCIAL MEDIA PLATFORMSCURRENT AND FUTURE TYPE ANALYSIS, 2025–2034, (USD MILLION)
FIGURE 104 THAILAND WEB3 SOCIAL MEDIA PLATFORMSCURRENT AND FUTURE END USER ANALYSIS, 2025–2034, (USD MILLION)
FIGURE 105 TAIWAN WEB3 SOCIAL MEDIA PLATFORMSCURRENT AND FUTURE TYPE ANALYSIS, 2025–2034, (USD MILLION)
FIGURE 106 TAIWAN WEB3 SOCIAL MEDIA PLATFORMSCURRENT AND FUTURE END USER ANALYSIS, 2025–2034, (USD MILLION)
FIGURE 107 MALAYSIA WEB3 SOCIAL MEDIA PLATFORMSCURRENT AND FUTURE TYPE ANALYSIS, 2025–2034, (USD MILLION)
FIGURE 108 MALAYSIA WEB3 SOCIAL MEDIA PLATFORMSCURRENT AND FUTURE END USER ANALYSIS, 2025–2034, (USD MILLION)
FIGURE 109 REST OF SEA AND SOUTH ASIA WEB3 SOCIAL MEDIA PLATFORMSCURRENT AND FUTURE TYPE ANALYSIS, 2025–2034, (USD MILLION)
FIGURE 110 REST OF SEA AND SOUTH ASIA WEB3 SOCIAL MEDIA PLATFORMSCURRENT AND FUTURE END USER ANALYSIS, 2025–2034, (USD MILLION)
FIGURE 111 MIDDLE EAST AND AFRICA WEB3 SOCIAL MEDIA PLATFORMSCURRENT AND FUTURE MARKET VOLUME SHARE REGIONAL ANALYSIS, 2025–2034, (USD MILLION)
FIGURE 112 GCC COUNTRIES WEB3 SOCIAL MEDIA PLATFORMSCURRENT AND FUTURE TYPE ANALYSIS, 2025–2034, (USD MILLION)
FIGURE 113 GCC COUNTRIES WEB3 SOCIAL MEDIA PLATFORMSCURRENT AND FUTURE END USER ANALYSIS, 2025–2034, (USD MILLION)
FIGURE 114 SAUDI ARABIA WEB3 SOCIAL MEDIA PLATFORMSCURRENT AND FUTURE TYPE ANALYSIS, 2025–2034, (USD MILLION)
FIGURE 115 SAUDI ARABIA WEB3 SOCIAL MEDIA PLATFORMSCURRENT AND FUTURE END USER ANALYSIS, 2025–2034, (USD MILLION)
FIGURE 116 UAE WEB3 SOCIAL MEDIA PLATFORMSCURRENT AND FUTURE TYPE ANALYSIS, 2025–2034, (USD MILLION)
FIGURE 117 UAE WEB3 SOCIAL MEDIA PLATFORMSCURRENT AND FUTURE END USER ANALYSIS, 2025–2034, (USD MILLION)
FIGURE 118 BAHRAIN WEB3 SOCIAL MEDIA PLATFORMSCURRENT AND FUTURE TYPE ANALYSIS, 2025–2034, (USD MILLION)
FIGURE 119 BAHRAIN WEB3 SOCIAL MEDIA PLATFORMSCURRENT AND FUTURE END USER ANALYSIS, 2025–2034, (USD MILLION)
FIGURE 120 KUWAIT WEB3 SOCIAL MEDIA PLATFORMSCURRENT AND FUTURE TYPE ANALYSIS, 2025–2034, (USD MILLION)
FIGURE 121 KUWAIT WEB3 SOCIAL MEDIA PLATFORMSCURRENT AND FUTURE END USER ANALYSIS, 2025–2034, (USD MILLION)
FIGURE 122 OMAN WEB3 SOCIAL MEDIA PLATFORMSCURRENT AND FUTURE TYPE ANALYSIS, 2025–2034, (USD MILLION)
FIGURE 123 OMAN WEB3 SOCIAL MEDIA PLATFORMSCURRENT AND FUTURE END USER ANALYSIS, 2025–2034, (USD MILLION)
FIGURE 124 QATAR WEB3 SOCIAL MEDIA PLATFORMSCURRENT AND FUTURE TYPE ANALYSIS, 2025–2034, (USD MILLION)
FIGURE 125 QATAR WEB3 SOCIAL MEDIA PLATFORMSCURRENT AND FUTURE END USER ANALYSIS, 2025–2034, (USD MILLION)
FIGURE 126 EGYPT WEB3 SOCIAL MEDIA PLATFORMSCURRENT AND FUTURE TYPE ANALYSIS, 2025–2034, (USD MILLION)
FIGURE 127 EGYPT WEB3 SOCIAL MEDIA PLATFORMSCURRENT AND FUTURE END USER ANALYSIS, 2025–2034, (USD MILLION)
FIGURE 128 NIGERIA WEB3 SOCIAL MEDIA PLATFORMSCURRENT AND FUTURE TYPE ANALYSIS, 2025–2034, (USD MILLION)
FIGURE 129 NIGERIA WEB3 SOCIAL MEDIA PLATFORMSCURRENT AND FUTURE END USER ANALYSIS, 2025–2034, (USD MILLION)
FIGURE 130 SOUTH AFRICA WEB3 SOCIAL MEDIA PLATFORMSCURRENT AND FUTURE TYPE ANALYSIS, 2025–2034, (USD MILLION)
FIGURE 131 SOUTH AFRICA WEB3 SOCIAL MEDIA PLATFORMSCURRENT AND FUTURE END USER ANALYSIS, 2025–2034, (USD MILLION)
FIGURE 132 ISRAEL WEB3 SOCIAL MEDIA PLATFORMSCURRENT AND FUTURE TYPE ANALYSIS, 2025–2034, (USD MILLION)
FIGURE 133 ISRAEL WEB3 SOCIAL MEDIA PLATFORMSCURRENT AND FUTURE END USER ANALYSIS, 2025–2034, (USD MILLION)
FIGURE 134 REST OF MEA WEB3 SOCIAL MEDIA PLATFORMSCURRENT AND FUTURE TYPE ANALYSIS, 2025–2034, (USD MILLION)
FIGURE 135 REST OF MEA WEB3 SOCIAL MEDIA PLATFORMSCURRENT AND FUTURE END USER ANALYSIS, 2025–2034, (USD MILLION)
FIGURE 136 U. S. MARKET SHARE ANALYSIS BY TYPE (2024)
FIGURE 137 U. S. MARKET SHARE ANALYSIS BY END USER (2024)
FIGURE 138 CANADA MARKET SHARE ANALYSIS BY TYPE (2024)
FIGURE 139 CANADA MARKET SHARE ANALYSIS BY END USER (2024)
FIGURE 140 MEXICO MARKET SHARE ANALYSIS BY TYPE (2024)
FIGURE 141 MEXICO MARKET SHARE ANALYSIS BY END USER (2024)
FIGURE 142 CHINA MARKET SHARE ANALYSIS BY TYPE (2024)
FIGURE 143 CHINA MARKET SHARE ANALYSIS BY END USER (2024)
FIGURE 144 JAPAN MARKET SHARE ANALYSIS BY TYPE (2024)
FIGURE 145 JAPAN MARKET SHARE ANALYSIS BY END USER (2024)
FIGURE 146 INDIA MARKET SHARE ANALYSIS BY TYPE (2024)
FIGURE 147 INDIA MARKET SHARE ANALYSIS BY END USER (2024)
FIGURE 148 SOUTH KOREA MARKET SHARE ANALYSIS BY TYPE (2024)
FIGURE 149 SOUTH KOREA MARKET SHARE ANALYSIS BY END USER (2024)
FIGURE 150 SAUDI ARABIA MARKET SHARE ANALYSIS BY TYPE (2024)
FIGURE 151 SAUDI ARABIA MARKET SHARE ANALYSIS BY END USER (2024)
FIGURE 152 UAE MARKET SHARE ANALYSIS BY TYPE (2024)
FIGURE 153 UAE MARKET SHARE ANALYSIS BY END USER (2024)
FIGURE 154 EGYPT MARKET SHARE ANALYSIS BY TYPE (2024)
FIGURE 155 EGYPT MARKET SHARE ANALYSIS BY END USER (2024)
FIGURE 156 NIGERIA MARKET SHARE ANALYSIS BY TYPE (2024)
FIGURE 157 NIGERIA MARKET SHARE ANALYSIS BY END USER (2024)
FIGURE 158 SOUTH AFRICA MARKET SHARE ANALYSIS BY TYPE (2024)
FIGURE 159 SOUTH AFRICA MARKET SHARE ANALYSIS BY END USER (2024)
FIGURE 160 GERMANY MARKET SHARE ANALYSIS BY TYPE (2024)
FIGURE 161 GERMANY MARKET SHARE ANALYSIS BY END USER (2024)
FIGURE 162 FRANCE MARKET SHARE ANALYSIS BY TYPE (2024)
FIGURE 163 FRANCE MARKET SHARE ANALYSIS BY END USER (2024)
FIGURE 164 UK MARKET SHARE ANALYSIS BY TYPE (2024)
FIGURE 165 UK MARKET SHARE ANALYSIS BY END USER (2024)
FIGURE 166 SPAIN MARKET SHARE ANALYSIS BY TYPE (2024)
FIGURE 167 SPAIN MARKET SHARE ANALYSIS BY END USER (2024)
FIGURE 168 ITALY MARKET SHARE ANALYSIS BY TYPE (2024)
FIGURE 169 ITALY MARKET SHARE ANALYSIS BY END USER (2024)
FIGURE 170 BRAZIL MARKET SHARE ANALYSIS BY TYPE (2024)
FIGURE 171 BRAZIL MARKET SHARE ANALYSIS BY END USER (2024)
FIGURE 172 ARGENTINA MARKET SHARE ANALYSIS BY TYPE (2024)
FIGURE 173 ARGENTINA MARKET SHARE ANALYSIS BY END USER (2024)
FIGURE 174 COLUMBIA MARKET SHARE ANALYSIS BY TYPE (2024)
FIGURE 175 COLUMBIA MARKET SHARE ANALYSIS BY END USER (2024)
FIGURE 176 GLOBAL WEB3 SOCIAL MEDIA PLATFORMSCURRENT AND FUTURE MARKET KEY COUNTRY LEVEL ANALYSIS, 2024–2034, (USD MILLION)
FIGURE 177 FINANCIAL OVERVIEW:
Key Player Analysis
Lenster: Lenster operates as a leading social application built on the Lens Protocol and holds a strong position among creator-focused Web3 platforms. By 2025, Lenster supports decentralized profiles, content publishing, and social graphs stored on-chain, giving users full ownership of identity and connections. The platform benefits from the rapid expansion of the Lens ecosystem, which surpassed an estimated 2.3 million profiles and 6.5 million social connections globally by early 2025. Lenster’s user base skews toward crypto-native creators, developers, and digital communities seeking censorship resistance and portable reputations.
Strategically, Lenster prioritizes protocol-level upgrades, wallet-native onboarding, and composability with other Lens-based applications. It continues to integrate AI-assisted content discovery and spam filtering to improve usability while maintaining decentralized control. Its key differentiator lies in interoperability. Users can move profiles and followers across compatible apps without data loss. This positions Lenster well as a reference interface for the Lens social graph, particularly in Europe and North America where Web3 creator adoption continues to rise at over 35% annually.
Mirror: Mirror positions itself as an innovator at the intersection of publishing, crowdfunding, and Web3 social engagement. The platform enables writers and organizations to publish long-form content, mint posts as NFTs, and raise capital directly from readers using crypto wallets. By 2025, Mirror supports thousands of active publications and has facilitated an estimated 120 million USD in cumulative creator fundraising since launch, primarily through token launches and NFT-based campaigns.
Mirror’s strategy centers on creator monetization and community-backed media. It integrates governance tools, on-chain subscriptions, and smart contract-based revenue sharing. Partnerships with DAO tooling providers and Layer 2 networks have reduced transaction costs by more than 60% since 2023, improving accessibility. Mirror differentiates through its strong adoption among DAOs, research collectives, and Web3 startups. Its model appeals to users seeking ownership-driven media economics rather than ad-funded distribution.
Farcaster: Farcaster operates as a fast-growing challenger focused on decentralized identity and social messaging. The protocol separates identity, storage, and applications, allowing multiple clients to operate on a shared social layer. By 2025, Farcaster exceeds 1.1 million registered users and records over 10 million daily messages across clients. Growth accelerated following open registration and improved mobile onboarding in late 2024.
Farcaster’s strategic emphasis lies in developer adoption and client diversity. The ecosystem supports dozens of applications ranging from social feeds to gaming and finance integrations. Its differentiator is protocol resilience. Users retain identities even if individual apps shut down. The platform also benefits from strong adoption in the U.S. and Asia Pacific, where developer activity around decentralized social infrastructure is expanding at a CAGR above 40%. This positions Farcaster as a core infrastructure layer rather than a single consumer app.
Market Key Players
Amazon
Farcaster
Polygon Technology
Paragraph Technologies
Moralis Web3 Technology
Mirror
Helium Foundation
Lenster
Showtime Technologies
Chainlink
Orb
Twetch
Continuum
Revel.xyz
Arcade
RARA
Islands
Others
Driver:
Rising Demand for User Data Ownership and Privacy
As of 2025, user control over personal data stands as a primary force shaping Web3 social media adoption. You face rising privacy risks on centralized platforms, where data monetization models expose user information to misuse and breaches. Web3 platforms respond by placing identity, content, and interaction data on decentralized ledgers. This structure gives users direct authority over access and portability. Surveys conducted in 2024 indicate that over 68% of digital-native users rank data ownership as a top criterion when evaluating new social platforms, reinforcing this shift.
Decentralized Governance Boosting Trust and Engagement
This model alters platform economics and governance. You see higher trust levels when moderation rules and policy updates operate through on-chain voting rather than opaque corporate decisions. Platforms adopting decentralized governance report engagement rates that are 25 to 30% higher than centralized peers by early 2025. This driver strengthens long-term retention and supports sustained revenue growth through token-based participation models.
Restraint:
Regulatory Uncertainty Slowing Platform Expansion
Regulatory ambiguity remains a material constraint in 2025. You operate across jurisdictions where digital asset rules, content liability standards, and financial compliance requirements lack alignment. Inconsistent guidance around token classification, user rewards, and decentralized governance exposes platforms to enforcement risk. According to industry estimates, regulatory uncertainty delays market entry or feature launches for nearly 35% of Web3 social startups.
Compliance Risks Impacting Investment and Partnerships
This environment affects capital deployment and partnership decisions. Institutional investors apply higher risk premiums, while enterprises delay integrations due to compliance exposure. You also face operational strain from jurisdiction-specific controls that fragment global user communities. Without clearer policy frameworks, market expansion proceeds unevenly despite strong user demand.
Opportunity:
DeFi Integration Unlocking New Monetization Models
The integration of decentralized finance capabilities presents a major growth path beyond 2025. You can access new income streams by embedding token payments, peer-to-peer transfers, and creator marketplaces directly into social interfaces. The global DeFi market is projected to exceed 230 billion USD by 2030, creating strong overlap with social engagement layers.
Creator Economy Growth Through Token-Based Revenue
This convergence reshapes monetization. You gain direct revenue participation through staking, subscriptions, and community-backed funding without relying on advertising. Platforms combining social interaction with financial utility report up to 40% higher average revenue per user by 2025. These models also attract creators and financial service providers seeking closer user relationships.
Trend:
Federated Social Networks Enabling Cross-Platform Interaction
Decentralized network structures gain momentum in 2025. Federated social systems allow you to interact across independently operated platforms while retaining control over identity and data. This architecture reduces platform lock-in and supports cross-network growth. Adoption of federated protocols grows at an estimated 32% annual rate through 2028.
Token-Gated Communities Transforming Digital Engagement
Token-gated communities also reshape engagement patterns. You increasingly see access rights tied to NFTs or platform tokens that unlock content, events, or governance roles. By mid-2025, over 45% of leading Web3 social platforms deploy token-based access controls. This trend supports creator income stability and strengthens community alignment.
Recent Developments
Dec 2024 – Farcaster: Farcaster opened permissionless onboarding and rolled out paid on-chain identities priced at 5 USD per user, pushing registered accounts beyond 750,000 by year-end 2024. This move accelerated network effects and positioned the protocol as a core identity layer within decentralized social infrastructure.
Feb 2025 – Lens Protocol: Lens Protocol introduced Lens V3 with modular social graphs and integrated Layer 2 scaling, reducing transaction costs by an estimated 60% and supporting over 2.5 million user profiles. The upgrade strengthened developer adoption and improved scalability for consumer-facing Web3 social applications.
Apr 2025 – Mirror: Mirror launched tokenized subscription tools and DAO-native publishing analytics, supporting creator revenues estimated at over 35 million USD annually. This development expanded Mirror’s role as a monetization-focused platform for Web3-native media and research communities.
Jul 2025 – Lenster: Lenster released AI-assisted content moderation and discovery features across its Lens-based interface, covering more than 1.2 million active users. The update improved usability while preserving decentralized data ownership, strengthening retention among creator-led communities.
Sep 2025 – Meta: Meta announced a pilot integration of decentralized identity standards compatible with Web3 wallets for selected social products, with initial testing across North America and Europe and a projected reach of over 10 million users. This entry signaled growing interest from large technology firms and validated Web3 social concepts at institutional scale.
Frequently Asked Questions
How big is the Web3 Social Media Platforms Market?
Web3 Social Media Platforms Market
Who are the major players in the Web3 Social Media Platforms Market?
Which segments covered the Web3 Social Media Platforms Market?
By Application, Cryptocurrency, Conversational AI, Data and Transaction Storage, Payments, Smart Contracts, Others, By End User, BFSI (Banking, Financial Services, and Insurance), E-Commerce and Retail, Media and Entertainment, Healthcare and Pharmaceutical, IT and Telecom, Others
How can this market research report help my business make strategic decisions?
Our market research reports provide actionable intelligence, including verified market size data, CAGR projections, competitive benchmarking, and segment-level opportunity analysis. These insights support strategic planning, investment decisions, product development, and market entry strategies for enterprises and startups alike.
How frequently is the data updated?
We continuously monitor industry developments and update our reports to reflect regulatory changes, technological advancements, and macroeconomic shifts. Updated editions ensure you receive the latest market intelligence.