Global Wireless Telecom Infrastructure Market Size, Share & Network Analysis By Infrastructure Type (Towers, Small Cells, DAS, Base Stations), By Technology (4G, 5G, Open RAN), By End User (Telecom Operators, Enterprises, Governments), Network Densification Trends, AI-Driven Optimization, Regional Outlook, Key Players & Forecast 2025–2034
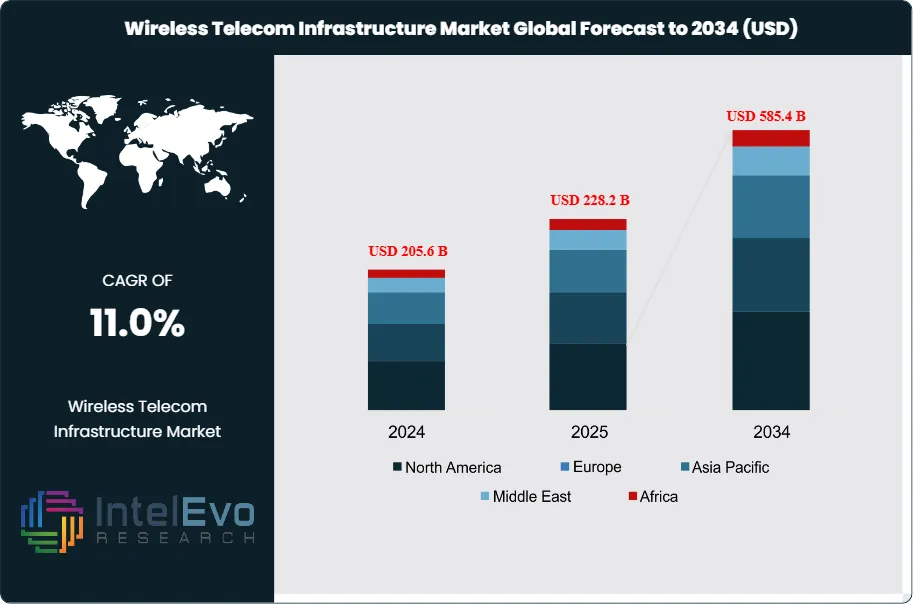
The Wireless Telecom Infrastructure Market is estimated at USD 205.6 billion in 2024 and is projected to reach approximately USD 585.4 billion by 2034, registering a compound annual growth rate (CAGR) of about 11.0% during 2025–2034. This sustained expansion is driven by accelerated 5G rollouts, rising mobile data traffic, and continuous investments in network densification through small cells and fiber backhaul. Governments and telecom operators are also prioritizing rural connectivity, private 5G networks, and infrastructure upgrades to support IoT, smart cities, and Industry 4.0 applications. As a result, wireless infrastructure remains a core enabler of digital economies and next-generation communication ecosystems worldwide.
This growth reflects the sector’s central role in enabling mobile connectivity, broadband expansion, and the transition to advanced network technologies. The market has expanded steadily over the past decade, supported by rising mobile penetration, surging data consumption, and the shift from 3G and 4G to 5G. In 2023, Asia-Pacific accounted for more than 35% of global revenue, valued at USD 67.1 billion, underscoring its position as the largest regional market.
Demand-side drivers remain strong. The proliferation of smartphones, streaming platforms, and connected devices continues to push network operators to expand coverage and capacity. The Internet of Things adds further pressure, with billions of devices requiring low-latency, high-speed connections. On the supply side, operators face the challenge of balancing capital expenditure with profitability, particularly as spectrum costs and infrastructure investments rise. Regulatory frameworks also influence deployment timelines, with spectrum allocation and site approvals varying widely across markets.
Technology is reshaping the sector. The rollout of 5G is accelerating adoption of small cell networks, distributed antenna systems, and advanced backhaul solutions. Artificial intelligence is increasingly applied to network optimization, predictive maintenance, and traffic management, improving efficiency in dense urban environments. By the end of 2022, the U.S. industry had deployed more than 142,000 cellular towers, 209,500 macrocell sites, and over 1.1 million indoor and outdoor small cell nodes, reflecting the scale of infrastructure required to sustain demand.
Investment activity highlights the strategic importance of infrastructure ownership. American Tower Corporation, with a market capitalization of USD 102.2 billion in early 2024, remains the global leader, while Crown Castle International and SBA Communications continue to expand their portfolios despite share price volatility. Data center operators such as Equinix and Digital Realty are also strengthening their role in supporting wireless networks through interconnection and colocation services.
Regional opportunities are shifting. While Asia-Pacific leads in scale, North America remains a critical investment hub due to high capital spending by operators such as Verizon, which allocated USD 10.5 billion in 2022 to network upgrades. Emerging markets in Africa and Latin America present long-term growth potential, particularly in rural connectivity where infrastructure gaps remain significant. For investors, the sector offers sustained growth prospects, anchored by rising data demand and the global transition to 5G and beyond.
Key Takeaways
Market Growth: The global wireless telecom infrastructure market was valued at USD 205.6 billion in 2024 and is projected to reach USD 585.4 billion by 2034, expanding at a CAGR of 11.0%. Growth is driven by rising mobile data consumption, 5G rollouts, and the surge in connected devices.
Infrastructure Type: Base stations accounted for over 40% of total revenue in 2023. Their role in enabling wide-area coverage and supporting 5G deployment makes them the backbone of network expansion.
Technology: The 4G/LTE segment held more than 64% share in 2023, reflecting its maturity and broad adoption. While 5G is expanding, 4G remains the primary technology supporting global mobile traffic.
End Use: Telecom operators captured over 65% of market share in 2023. Their large subscriber bases and sustained capital expenditure on network upgrades continue to drive infrastructure demand.
Driver: Rising demand for high-speed connectivity is a key growth factor. Global mobile data traffic is expected to grow at over 25% annually through 2030, requiring significant investment in towers, small cells, and backhaul systems.
Restraint: High capital intensity and regulatory hurdles limit faster deployment. In the U.S., spectrum auctions and site approval delays add billions in costs and extend rollout timelines.
Opportunity: Rural connectivity represents a major untapped market. Expanding infrastructure in underserved regions could unlock billions in new revenue, particularly in Africa and South Asia where mobile penetration is below 60%.
Trend: Small cell deployment and AI-driven network optimization are reshaping infrastructure strategies. By 2022, the U.S. had installed over 1.1 million indoor and outdoor small cell nodes, highlighting the shift toward densification.
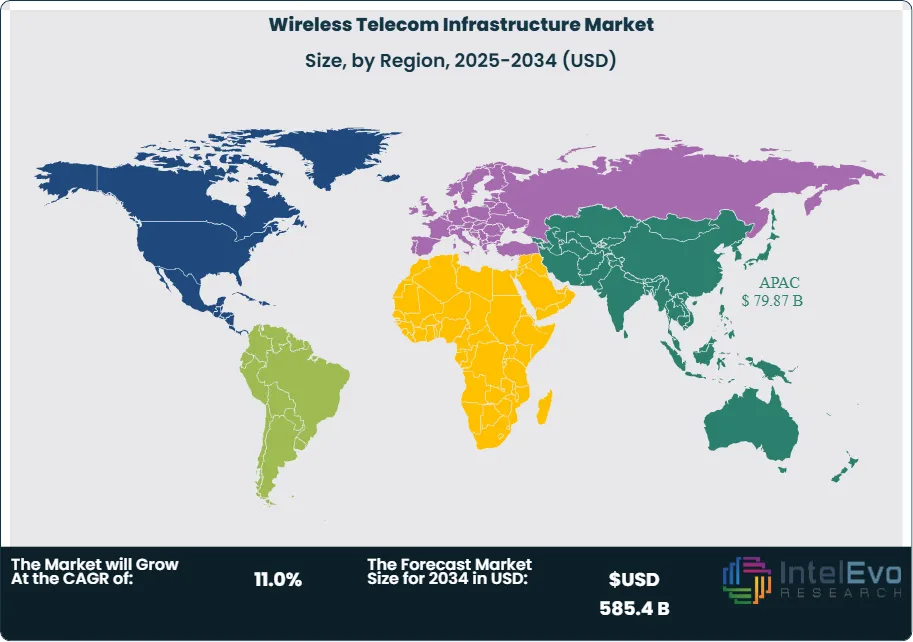
Regional Analysis: Asia-Pacific led with over 35% share in 2023, supported by rapid 5G adoption in China, Japan, and South Korea. North America remains a high-investment region, with U.S. operators such as Verizon allocating more than USD 10 billion annually to network upgrades. Emerging markets in Latin America and Africa are expected to post double-digit CAGRs through 2033.
Infrastructure Type Analysis
By 2025, base stations continue to represent the largest share of the wireless telecom infrastructure market, accounting for more than 40% of total revenue. Their dominance reflects their role as the central interface between mobile devices and network infrastructure, enabling seamless transmission and reception of wireless signals. The exponential rise in mobile subscriptions, coupled with surging demand for high-speed data, has reinforced the need for dense and efficient base station networks.
The rollout of 5G has further accelerated investment in base stations. Unlike earlier generations, 5G requires a denser grid of small and macro base stations to deliver ultra-low latency and high-capacity connectivity. Operators in markets such as China, the United States, and South Korea have already deployed hundreds of thousands of 5G-ready base stations, with China alone surpassing 3 million installations by 2024. This scale of deployment underscores the infrastructure intensity required to sustain next-generation connectivity.
Emerging applications such as IoT, smart cities, and autonomous mobility are also reshaping infrastructure demand. These use cases require uninterrupted coverage and high reliability, driving operators to expand both macro and small cell deployments. The surge in video streaming and cloud-based services has added further pressure, making high-capacity base stations critical to maintaining quality of service.
Technology Analysis
As of 2025, 4G/LTE remains the most widely deployed wireless technology, accounting for more than 60% of global infrastructure revenue. Its dominance is supported by extensive coverage across urban and rural markets, as well as the large installed base of LTE-enabled devices. Despite the rapid expansion of 5G, LTE continues to serve as the backbone of mobile connectivity, particularly in emerging economies where 5G adoption is still in early stages.
The maturity of LTE networks has ensured consistent performance and affordability, making it the preferred choice for billions of users worldwide. Most smartphones, tablets, and IoT devices remain LTE-compatible, ensuring sustained demand for supporting infrastructure. Operators continue to invest in LTE upgrades, particularly in spectrum refarming and advanced LTE features, to extend the lifecycle of their networks.
At the same time, 5G is gaining momentum, with global connections expected to surpass 2 billion by 2025. The transition, however, is gradual due to high capital requirements and spectrum availability constraints. As a result, operators are pursuing hybrid strategies, maintaining LTE as a foundational layer while expanding 5G coverage in high-demand urban corridors. This dual-track approach ensures continuity of service while preparing networks for future applications such as industrial automation and immersive media.
End-Use Analysis
Telecom operators remain the dominant end-users of wireless telecom infrastructure, accounting for more than 65% of global market share in 2025. Their leadership stems from their role as primary service providers, managing vast subscriber bases and investing heavily in network expansion. In 2024 alone, U.S. operators allocated over USD 12 billion to infrastructure upgrades, while Chinese carriers collectively invested more than USD 20 billion in 5G rollouts.
The scale of investment reflects the pressure operators face to meet rising data consumption, which continues to grow at double-digit rates annually. With mobile video accounting for more than 70% of global data traffic, operators are compelled to expand capacity through new towers, base stations, and backhaul systems. Their partnerships with infrastructure providers and equipment vendors further strengthen their ability to deploy advanced solutions at scale.
Enterprises and government agencies are emerging as secondary demand drivers. Enterprises are increasingly investing in private 5G networks to support industrial automation, logistics, and secure communications. Governments, meanwhile, are prioritizing infrastructure development to support digital transformation agendas, particularly in smart city projects and public safety networks. While smaller in share, these segments represent high-growth opportunities through 2030.
Regional Analysis
Asia Pacific continues to lead the global market in 2025, accounting for more than 35% of total revenue. The region’s dominance is anchored by large-scale 5G deployments in China, South Korea, and Japan, supported by strong government backing and aggressive operator investments. China alone has committed to expanding 5G coverage to all prefecture-level cities by 2025, creating significant demand for base stations, antennas, and backhaul systems.
North America remains a critical investment hub, driven by high consumer data usage and rapid adoption of advanced wireless services. U.S. operators such as Verizon and AT&T have allocated multi-billion-dollar budgets annually to expand 5G coverage, with a strong focus on small cell deployments in urban centers. The region also benefits from a robust ecosystem of infrastructure providers, including American Tower and Crown Castle, which continue to expand their portfolios.
Europe is progressing steadily, with operators balancing 5G rollouts against regulatory and cost challenges. Countries such as Germany, the UK, and France are leading adoption, while Eastern Europe presents long-term growth potential. Meanwhile, Latin America and the Middle East & Africa are emerging as high-growth regions, with double-digit CAGRs projected through 2030. Infrastructure expansion in these markets is driven by rising mobile penetration, government-led digital initiatives, and the need to bridge rural connectivity gaps.
Infrastructure Type (Base Stations, Antennas, Transceivers, Backhaul Equipment, Other Infrastructure Types), Technology (4G/LTE, 5G, Other Technologies), End-User (Telecom Operators, Enterprises, Government and Public Sector, Other End-Users)
Research Methodology
Primary Research- 100 Interviews of Stakeholders
Secondary Research
Desk Research
Regional scope
North America (United States, Canada, Mexico)
Latin America (Brazil, Argentina, Columbia)
East Asia And Pacific (China, Japan, South Korea, Australia, Cambodia, Fiji, Indonesia)
Sea And South Asia (India, Singapore, Thailand, Taiwan, Malaysia)
Eastern Europe (Poland, Russia, Czech Republic, Romania)
Western Europe (Germany, U.K., France, Spain, Itlay)
Middle East & Africa (GCC Countries, Egypt, Nigeria, South Africa, Israel)
Competitive Landscape
Ericsson, Vertical Bridge, Samsung, Crown Castle, American Tower Corporation, ZTE, SBA Communications, TowerCo, AT&T Towers, Nokia, Mobilitie, Other Key Players
Customization Scope
Customization for segments, region/country-level will be provided. Moreover, additional customization can be done based on the requirements.
Pricing and Purchase Options
Avail customized purchase options to meet your exact research needs. We have three licenses to opt for: Single User License, Multi-User License (Up to 5 Users), Corporate Use License (Unlimited User and Printable PDF).
TABLE OF CONTENTS
1. EXECUTIVE SUMMARY
1.1. MARKET SNAPSHOT
1.2. KEY FINDINGS & INSIGHTS
1.3. ANALYST RECOMMENDATIONS
1.4. FUTURE OUTLOOK
2. RESEARCH METHODOLOGY
2.1. MARKET DEFINITION & SCOPE
2.2. RESEARCH OBJECTIVES: PRIMARY & SECONDARY DATA SOURCES
2.3. DATA COLLECTION SOURCES
2.3.1. COVERAGE OF 100+ PRIMARY RESEARCH/CONSULTATION CALLS WITH INDUSTRY STAKEHOLDERS
FIGURE 17 NORTH AMERICA WIRELESS TELECOM INFRASTRUCTURE CURRENT AND FUTURE TYPE ANALYSIS, 2025–2034, (USD MILLION)
FIGURE 18 NORTH AMERICA WIRELESS TELECOM INFRASTRUCTURE CURRENT AND FUTURE END USER ANALYSIS, 2025–2034, (USD MILLION)
FIGURE 19 MARKET SHARE BY COUNTRY
FIGURE 20 LATIN AMERICA WIRELESS TELECOM INFRASTRUCTURE CURRENT AND FUTURE TYPE ANALYSIS, 2025–2034, (USD MILLION)
FIGURE 21 LATIN AMERICA WIRELESS TELECOM INFRASTRUCTURE CURRENT AND FUTURE END USER ANALYSIS, 2025–2034, (USD MILLION)
FIGURE 22 MARKET SHARE BY COUNTRY
FIGURE 23 EASTERN EUROPE WIRELESS TELECOM INFRASTRUCTURE CURRENT AND FUTURE TYPE ANALYSIS, 2025–2034, (USD MILLION)
FIGURE 24 EASTERN EUROPE WIRELESS TELECOM INFRASTRUCTURE CURRENT AND FUTURE END USER ANALYSIS, 2025–2034, (USD MILLION)
FIGURE 25 MARKET SHARE BY COUNTRY
FIGURE 26 WESTERN EUROPE WIRELESS TELECOM INFRASTRUCTURE CURRENT AND FUTURE TYPE ANALYSIS, 2025–2034, (USD MILLION)
FIGURE 27 WESTERN EUROPE WIRELESS TELECOM INFRASTRUCTURE CURRENT AND FUTURE END USER ANALYSIS, 2025–2034, (USD MILLION)
FIGURE 28 MARKET SHARE BY COUNTRY
FIGURE 29 EAST ASIA AND PACIFIC WIRELESS TELECOM INFRASTRUCTURE CURRENT AND FUTURE TYPE ANALYSIS, 2025–2034, (USD MILLION)
FIGURE 30 EAST ASIA AND PACIFIC WIRELESS TELECOM INFRASTRUCTURE CURRENT AND FUTURE END USER ANALYSIS, 2025–2034, (USD MILLION)
FIGURE 31 MARKET SHARE BY COUNTRY
FIGURE 32 SEA AND SOUTH ASIA WIRELESS TELECOM INFRASTRUCTURE CURRENT AND FUTURE TYPE ANALYSIS, 2025–2034, (USD MILLION)
FIGURE 33 SEA AND SOUTH ASIA WIRELESS TELECOM INFRASTRUCTURE CURRENT AND FUTURE END USER ANALYSIS, 2025–2034, (USD MILLION)
FIGURE 34 MARKET SHARE BY COUNTRY
FIGURE 35 MIDDLE EAST AND AFRICA WIRELESS TELECOM INFRASTRUCTURE CURRENT AND FUTURE TYPE ANALYSIS, 2025–2034, (USD MILLION)
FIGURE 36 MIDDLE EAST AND AFRICA WIRELESS TELECOM INFRASTRUCTURE CURRENT AND FUTURE END USER ANALYSIS, 2025–2034, (USD MILLION)
FIGURE 37 NORTH AMERICA WIRELESS TELECOM INFRASTRUCTURE CURRENT AND FUTURE MARKET VOLUME SHARE REGIONAL ANALYSIS, 2025–2034, (USD MILLION)
FIGURE 38 U.S. WIRELESS TELECOM INFRASTRUCTURE CURRENT AND FUTURE TYPE ANALYSIS, 2025–2034, (USD MILLION)
FIGURE 39 U.S. WIRELESS TELECOM INFRASTRUCTURE CURRENT AND FUTURE END USER ANALYSIS, 2025–2034, (USD MILLION)
FIGURE 40 CANADA WIRELESS TELECOM INFRASTRUCTURE CURRENT AND FUTURE TYPE ANALYSIS, 2025–2034, (USD MILLION)
FIGURE 41 CANADA WIRELESS TELECOM INFRASTRUCTURE CURRENT AND FUTURE END USER ANALYSIS, 2025–2034, (USD MILLION)
FIGURE 42 LATIN AMERICA WIRELESS TELECOM INFRASTRUCTURE CURRENT AND FUTURE MARKET VOLUME SHARE REGIONAL ANALYSIS, 2025–2034, (USD MILLION)
FIGURE 43 MEXICO WIRELESS TELECOM INFRASTRUCTURE CURRENT AND FUTURE TYPE ANALYSIS, 2025–2034, (USD MILLION)
FIGURE 44 MEXICO WIRELESS TELECOM INFRASTRUCTURE CURRENT AND FUTURE END USER ANALYSIS, 2025–2034, (USD MILLION)
FIGURE 45 BRAZIL WIRELESS TELECOM INFRASTRUCTURE CURRENT AND FUTURE TYPE ANALYSIS, 2025–2034, (USD MILLION)
FIGURE 46 BRAZIL WIRELESS TELECOM INFRASTRUCTURE CURRENT AND FUTURE END USER ANALYSIS, 2025–2034, (USD MILLION)
FIGURE 47 ARGENTINA WIRELESS TELECOM INFRASTRUCTURE CURRENT AND FUTURE TYPE ANALYSIS, 2025–2034, (USD MILLION)
FIGURE 48 ARGENTINA WIRELESS TELECOM INFRASTRUCTURE CURRENT AND FUTURE END USER ANALYSIS, 2025–2034, (USD MILLION)
FIGURE 49 COLUMBIA WIRELESS TELECOM INFRASTRUCTURE CURRENT AND FUTURE TYPE ANALYSIS, 2025–2034, (USD MILLION)
FIGURE 50 COLUMBIA WIRELESS TELECOM INFRASTRUCTURE CURRENT AND FUTURE END USER ANALYSIS, 2025–2034, (USD MILLION)
FIGURE 51 REST OF LATIN AMERICA WIRELESS TELECOM INFRASTRUCTURE CURRENT AND FUTURE TYPE ANALYSIS, 2025–2034, (USD MILLION)
FIGURE 52 REST OF LATIN AMERICA WIRELESS TELECOM INFRASTRUCTURE CURRENT AND FUTURE END USER ANALYSIS, 2025–2034, (USD MILLION)
FIGURE 53 EASTERN EUROPE WIRELESS TELECOM INFRASTRUCTURE CURRENT AND FUTURE MARKET VOLUME SHARE REGIONAL ANALYSIS, 2025–2034, (USD MILLION)
FIGURE 54 POLAND WIRELESS TELECOM INFRASTRUCTURE CURRENT AND FUTURE TYPE ANALYSIS, 2025–2034, (USD MILLION)
FIGURE 55 POLAND WIRELESS TELECOM INFRASTRUCTURE CURRENT AND FUTURE END USER ANALYSIS, 2025–2034, (USD MILLION)
FIGURE 56 RUSSIA WIRELESS TELECOM INFRASTRUCTURE CURRENT AND FUTURE TYPE ANALYSIS, 2025–2034, (USD MILLION)
FIGURE 57 RUSSIA WIRELESS TELECOM INFRASTRUCTURE CURRENT AND FUTURE END USER ANALYSIS, 2025–2034, (USD MILLION)
FIGURE 58 CZECH REPUBLIC WIRELESS TELECOM INFRASTRUCTURE CURRENT AND FUTURE TYPE ANALYSIS, 2025–2034, (USD MILLION)
FIGURE 59 CZECH REPUBLIC WIRELESS TELECOM INFRASTRUCTURE CURRENT AND FUTURE END USER ANALYSIS, 2025–2034, (USD MILLION)
FIGURE 60 ROMANIA WIRELESS TELECOM INFRASTRUCTURE CURRENT AND FUTURE TYPE ANALYSIS, 2025–2034, (USD MILLION)
FIGURE 61 ROMANIA WIRELESS TELECOM INFRASTRUCTURE CURRENT AND FUTURE END USER ANALYSIS, 2025–2034, (USD MILLION)
FIGURE 62 REST OF EASTERN EUROPE WIRELESS TELECOM INFRASTRUCTURE CURRENT AND FUTURE TYPE ANALYSIS, 2025–2034, (USD MILLION)
FIGURE 63 REST OF EASTERN EUROPE WIRELESS TELECOM INFRASTRUCTURE CURRENT AND FUTURE END USER ANALYSIS, 2025–2034, (USD MILLION)
FIGURE 64 WESTERN EUROPE WIRELESS TELECOM INFRASTRUCTURE CURRENT AND FUTURE MARKET VOLUME SHARE REGIONAL ANALYSIS, 2025–2034, (USD MILLION)
FIGURE 65 GERMANY WIRELESS TELECOM INFRASTRUCTURE CURRENT AND FUTURE TYPE ANALYSIS, 2025–2034, (USD MILLION)
FIGURE 66 GERMANY WIRELESS TELECOM INFRASTRUCTURE CURRENT AND FUTURE END USER ANALYSIS, 2025–2034, (USD MILLION)
FIGURE 67 FRANCE WIRELESS TELECOM INFRASTRUCTURE CURRENT AND FUTURE TYPE ANALYSIS, 2025–2034, (USD MILLION)
FIGURE 68 FRANCE WIRELESS TELECOM INFRASTRUCTURE CURRENT AND FUTURE END USER ANALYSIS, 2025–2034, (USD MILLION)
FIGURE 69 UK WIRELESS TELECOM INFRASTRUCTURE CURRENT AND FUTURE TYPE ANALYSIS, 2025–2034, (USD MILLION)
FIGURE 70 UK WIRELESS TELECOM INFRASTRUCTURE CURRENT AND FUTURE END USER ANALYSIS, 2025–2034, (USD MILLION)
FIGURE 71 SPAIN WIRELESS TELECOM INFRASTRUCTURE CURRENT AND FUTURE TYPE ANALYSIS, 2025–2034, (USD MILLION)
FIGURE 72 SPAIN WIRELESS TELECOM INFRASTRUCTURE CURRENT AND FUTURE END USER ANALYSIS, 2025–2034, (USD MILLION)
FIGURE 73 ITALY WIRELESS TELECOM INFRASTRUCTURE CURRENT AND FUTURE TYPE ANALYSIS, 2025–2034, (USD MILLION)
FIGURE 74 ITALY WIRELESS TELECOM INFRASTRUCTURE CURRENT AND FUTURE END USER ANALYSIS, 2025–2034, (USD MILLION)
FIGURE 75 REST OF WESTERN EUROPE WIRELESS TELECOM INFRASTRUCTURE CURRENT AND FUTURE TYPE ANALYSIS, 2025–2034, (USD MILLION)
FIGURE 76 REST OF WESTERN EUROPE WIRELESS TELECOM INFRASTRUCTURE CURRENT AND FUTURE END USER ANALYSIS, 2025–2034, (USD MILLION)
FIGURE 77 EAST ASIA AND PACIFIC WIRELESS TELECOM INFRASTRUCTURE CURRENT AND FUTURE MARKET VOLUME SHARE REGIONAL ANALYSIS, 2025–2034, (USD MILLION)
FIGURE 78 CHINA WIRELESS TELECOM INFRASTRUCTURE CURRENT AND FUTURE TYPE ANALYSIS, 2025–2034, (USD MILLION)
FIGURE 79 CHINA WIRELESS TELECOM INFRASTRUCTURE CURRENT AND FUTURE END USER ANALYSIS, 2025–2034, (USD MILLION)
FIGURE 80 JAPAN WIRELESS TELECOM INFRASTRUCTURE CURRENT AND FUTURE TYPE ANALYSIS, 2025–2034, (USD MILLION)
FIGURE 81 JAPAN WIRELESS TELECOM INFRASTRUCTURE CURRENT AND FUTURE END USER ANALYSIS, 2025–2034, (USD MILLION)
FIGURE 82 AUSTRALIA WIRELESS TELECOM INFRASTRUCTURE CURRENT AND FUTURE TYPE ANALYSIS, 2025–2034, (USD MILLION)
FIGURE 83 AUSTRALIA WIRELESS TELECOM INFRASTRUCTURE CURRENT AND FUTURE END USER ANALYSIS, 2025–2034, (USD MILLION)
FIGURE 84 CAMBODIA WIRELESS TELECOM INFRASTRUCTURE CURRENT AND FUTURE TYPE ANALYSIS, 2025–2034, (USD MILLION)
FIGURE 85 CAMBODIA WIRELESS TELECOM INFRASTRUCTURE CURRENT AND FUTURE END USER ANALYSIS, 2025–2034, (USD MILLION)
FIGURE 86 FIJI WIRELESS TELECOM INFRASTRUCTURE CURRENT AND FUTURE TYPE ANALYSIS, 2025–2034, (USD MILLION)
FIGURE 87 FIJI WIRELESS TELECOM INFRASTRUCTURE CURRENT AND FUTURE END USER ANALYSIS, 2025–2034, (USD MILLION)
FIGURE 88 INDONESIA WIRELESS TELECOM INFRASTRUCTURE CURRENT AND FUTURE TYPE ANALYSIS, 2025–2034, (USD MILLION)
FIGURE 89 INDONESIA WIRELESS TELECOM INFRASTRUCTURE CURRENT AND FUTURE END USER ANALYSIS, 2025–2034, (USD MILLION)
FIGURE 90 SOUTH KOREA WIRELESS TELECOM INFRASTRUCTURE CURRENT AND FUTURE TYPE ANALYSIS, 2025–2034, (USD MILLION)
FIGURE 91 SOUTH KOREA WIRELESS TELECOM INFRASTRUCTURE CURRENT AND FUTURE END USER ANALYSIS, 2025–2034, (USD MILLION)
FIGURE 92 REST OF EAST ASIA AND PACIFIC WIRELESS TELECOM INFRASTRUCTURE CURRENT AND FUTURE TYPE ANALYSIS, 2025–2034, (USD MILLION)
FIGURE 93 REST OF EAST ASIA AND PACIFIC WIRELESS TELECOM INFRASTRUCTURE CURRENT AND FUTURE END USER ANALYSIS, 2025–2034, (USD MILLION)
FIGURE 94 SEA AND SOUTH ASIA WIRELESS TELECOM INFRASTRUCTURE CURRENT AND FUTURE MARKET VOLUME SHARE REGIONAL ANALYSIS, 2025–2034, (USD MILLION)
FIGURE 95 BANGLADESH WIRELESS TELECOM INFRASTRUCTURE CURRENT AND FUTURE TYPE ANALYSIS, 2025–2034, (USD MILLION)
FIGURE 96 BANGLADESH WIRELESS TELECOM INFRASTRUCTURE CURRENT AND FUTURE END USER ANALYSIS, 2025–2034, (USD MILLION)
FIGURE 97 NEW ZEALAND WIRELESS TELECOM INFRASTRUCTURE CURRENT AND FUTURE TYPE ANALYSIS, 2025–2034, (USD MILLION)
FIGURE 98 NEW ZEALAND WIRELESS TELECOM INFRASTRUCTURE CURRENT AND FUTURE END USER ANALYSIS, 2025–2034, (USD MILLION)
FIGURE 99 INDIA WIRELESS TELECOM INFRASTRUCTURE CURRENT AND FUTURE TYPE ANALYSIS, 2025–2034, (USD MILLION)
FIGURE 100 INDIA WIRELESS TELECOM INFRASTRUCTURE CURRENT AND FUTURE END USER ANALYSIS, 2025–2034, (USD MILLION)
FIGURE 101 SINGAPORE WIRELESS TELECOM INFRASTRUCTURE CURRENT AND FUTURE TYPE ANALYSIS, 2025–2034, (USD MILLION)
FIGURE 102 SINGAPORE WIRELESS TELECOM INFRASTRUCTURE CURRENT AND FUTURE END USER ANALYSIS, 2025–2034, (USD MILLION)
FIGURE 103 THAILAND WIRELESS TELECOM INFRASTRUCTURE CURRENT AND FUTURE TYPE ANALYSIS, 2025–2034, (USD MILLION)
FIGURE 104 THAILAND WIRELESS TELECOM INFRASTRUCTURE CURRENT AND FUTURE END USER ANALYSIS, 2025–2034, (USD MILLION)
FIGURE 105 TAIWAN WIRELESS TELECOM INFRASTRUCTURE CURRENT AND FUTURE TYPE ANALYSIS, 2025–2034, (USD MILLION)
FIGURE 106 TAIWAN WIRELESS TELECOM INFRASTRUCTURE CURRENT AND FUTURE END USER ANALYSIS, 2025–2034, (USD MILLION)
FIGURE 107 MALAYSIA WIRELESS TELECOM INFRASTRUCTURE CURRENT AND FUTURE TYPE ANALYSIS, 2025–2034, (USD MILLION)
FIGURE 108 MALAYSIA WIRELESS TELECOM INFRASTRUCTURE CURRENT AND FUTURE END USER ANALYSIS, 2025–2034, (USD MILLION)
FIGURE 109 REST OF SEA AND SOUTH ASIA WIRELESS TELECOM INFRASTRUCTURE CURRENT AND FUTURE TYPE ANALYSIS, 2025–2034, (USD MILLION)
FIGURE 110 REST OF SEA AND SOUTH ASIA WIRELESS TELECOM INFRASTRUCTURE CURRENT AND FUTURE END USER ANALYSIS, 2025–2034, (USD MILLION)
FIGURE 111 MIDDLE EAST AND AFRICA WIRELESS TELECOM INFRASTRUCTURE CURRENT AND FUTURE MARKET VOLUME SHARE REGIONAL ANALYSIS, 2025–2034, (USD MILLION)
FIGURE 112 GCC COUNTRIES WIRELESS TELECOM INFRASTRUCTURE CURRENT AND FUTURE TYPE ANALYSIS, 2025–2034, (USD MILLION)
FIGURE 113 GCC COUNTRIES WIRELESS TELECOM INFRASTRUCTURE CURRENT AND FUTURE END USER ANALYSIS, 2025–2034, (USD MILLION)
FIGURE 114 SAUDI ARABIA WIRELESS TELECOM INFRASTRUCTURE CURRENT AND FUTURE TYPE ANALYSIS, 2025–2034, (USD MILLION)
FIGURE 115 SAUDI ARABIA WIRELESS TELECOM INFRASTRUCTURE CURRENT AND FUTURE END USER ANALYSIS, 2025–2034, (USD MILLION)
FIGURE 116 UAE WIRELESS TELECOM INFRASTRUCTURE CURRENT AND FUTURE TYPE ANALYSIS, 2025–2034, (USD MILLION)
FIGURE 117 UAE WIRELESS TELECOM INFRASTRUCTURE CURRENT AND FUTURE END USER ANALYSIS, 2025–2034, (USD MILLION)
FIGURE 118 BAHRAIN WIRELESS TELECOM INFRASTRUCTURE CURRENT AND FUTURE TYPE ANALYSIS, 2025–2034, (USD MILLION)
FIGURE 119 BAHRAIN WIRELESS TELECOM INFRASTRUCTURE CURRENT AND FUTURE END USER ANALYSIS, 2025–2034, (USD MILLION)
FIGURE 120 KUWAIT WIRELESS TELECOM INFRASTRUCTURE CURRENT AND FUTURE TYPE ANALYSIS, 2025–2034, (USD MILLION)
FIGURE 121 KUWAIT WIRELESS TELECOM INFRASTRUCTURE CURRENT AND FUTURE END USER ANALYSIS, 2025–2034, (USD MILLION)
FIGURE 122 OMAN WIRELESS TELECOM INFRASTRUCTURE CURRENT AND FUTURE TYPE ANALYSIS, 2025–2034, (USD MILLION)
FIGURE 123 OMAN WIRELESS TELECOM INFRASTRUCTURE CURRENT AND FUTURE END USER ANALYSIS, 2025–2034, (USD MILLION)
FIGURE 124 QATAR WIRELESS TELECOM INFRASTRUCTURE CURRENT AND FUTURE TYPE ANALYSIS, 2025–2034, (USD MILLION)
FIGURE 125 QATAR WIRELESS TELECOM INFRASTRUCTURE CURRENT AND FUTURE END USER ANALYSIS, 2025–2034, (USD MILLION)
FIGURE 126 EGYPT WIRELESS TELECOM INFRASTRUCTURE CURRENT AND FUTURE TYPE ANALYSIS, 2025–2034, (USD MILLION)
FIGURE 127 EGYPT WIRELESS TELECOM INFRASTRUCTURE CURRENT AND FUTURE END USER ANALYSIS, 2025–2034, (USD MILLION)
FIGURE 128 NIGERIA WIRELESS TELECOM INFRASTRUCTURE CURRENT AND FUTURE TYPE ANALYSIS, 2025–2034, (USD MILLION)
FIGURE 129 NIGERIA WIRELESS TELECOM INFRASTRUCTURE CURRENT AND FUTURE END USER ANALYSIS, 2025–2034, (USD MILLION)
FIGURE 130 SOUTH AFRICA WIRELESS TELECOM INFRASTRUCTURE CURRENT AND FUTURE TYPE ANALYSIS, 2025–2034, (USD MILLION)
FIGURE 131 SOUTH AFRICA WIRELESS TELECOM INFRASTRUCTURE CURRENT AND FUTURE END USER ANALYSIS, 2025–2034, (USD MILLION)
FIGURE 132 ISRAEL WIRELESS TELECOM INFRASTRUCTURE CURRENT AND FUTURE TYPE ANALYSIS, 2025–2034, (USD MILLION)
FIGURE 133 ISRAEL WIRELESS TELECOM INFRASTRUCTURE CURRENT AND FUTURE END USER ANALYSIS, 2025–2034, (USD MILLION)
FIGURE 134 REST OF MEA WIRELESS TELECOM INFRASTRUCTURE CURRENT AND FUTURE TYPE ANALYSIS, 2025–2034, (USD MILLION)
FIGURE 135 REST OF MEA WIRELESS TELECOM INFRASTRUCTURE CURRENT AND FUTURE END USER ANALYSIS, 2025–2034, (USD MILLION)
FIGURE 136 U. S. MARKET SHARE ANALYSIS BY TYPE (2024)
FIGURE 137 U. S. MARKET SHARE ANALYSIS BY END USER (2024)
FIGURE 138 CANADA MARKET SHARE ANALYSIS BY TYPE (2024)
FIGURE 139 CANADA MARKET SHARE ANALYSIS BY END USER (2024)
FIGURE 140 MEXICO MARKET SHARE ANALYSIS BY TYPE (2024)
FIGURE 141 MEXICO MARKET SHARE ANALYSIS BY END USER (2024)
FIGURE 142 CHINA MARKET SHARE ANALYSIS BY TYPE (2024)
FIGURE 143 CHINA MARKET SHARE ANALYSIS BY END USER (2024)
FIGURE 144 JAPAN MARKET SHARE ANALYSIS BY TYPE (2024)
FIGURE 145 JAPAN MARKET SHARE ANALYSIS BY END USER (2024)
FIGURE 146 INDIA MARKET SHARE ANALYSIS BY TYPE (2024)
FIGURE 147 INDIA MARKET SHARE ANALYSIS BY END USER (2024)
FIGURE 148 SOUTH KOREA MARKET SHARE ANALYSIS BY TYPE (2024)
FIGURE 149 SOUTH KOREA MARKET SHARE ANALYSIS BY END USER (2024)
FIGURE 150 SAUDI ARABIA MARKET SHARE ANALYSIS BY TYPE (2024)
FIGURE 151 SAUDI ARABIA MARKET SHARE ANALYSIS BY END USER (2024)
FIGURE 152 UAE MARKET SHARE ANALYSIS BY TYPE (2024)
FIGURE 153 UAE MARKET SHARE ANALYSIS BY END USER (2024)
FIGURE 154 EGYPT MARKET SHARE ANALYSIS BY TYPE (2024)
FIGURE 155 EGYPT MARKET SHARE ANALYSIS BY END USER (2024)
FIGURE 156 NIGERIA MARKET SHARE ANALYSIS BY TYPE (2024)
FIGURE 157 NIGERIA MARKET SHARE ANALYSIS BY END USER (2024)
FIGURE 158 SOUTH AFRICA MARKET SHARE ANALYSIS BY TYPE (2024)
FIGURE 159 SOUTH AFRICA MARKET SHARE ANALYSIS BY END USER (2024)
FIGURE 160 GERMANY MARKET SHARE ANALYSIS BY TYPE (2024)
FIGURE 161 GERMANY MARKET SHARE ANALYSIS BY END USER (2024)
FIGURE 162 FRANCE MARKET SHARE ANALYSIS BY TYPE (2024)
FIGURE 163 FRANCE MARKET SHARE ANALYSIS BY END USER (2024)
FIGURE 164 UK MARKET SHARE ANALYSIS BY TYPE (2024)
FIGURE 165 UK MARKET SHARE ANALYSIS BY END USER (2024)
FIGURE 166 SPAIN MARKET SHARE ANALYSIS BY TYPE (2024)
FIGURE 167 SPAIN MARKET SHARE ANALYSIS BY END USER (2024)
FIGURE 168 ITALY MARKET SHARE ANALYSIS BY TYPE (2024)
FIGURE 169 ITALY MARKET SHARE ANALYSIS BY END USER (2024)
FIGURE 170 BRAZIL MARKET SHARE ANALYSIS BY TYPE (2024)
FIGURE 171 BRAZIL MARKET SHARE ANALYSIS BY END USER (2024)
FIGURE 172 ARGENTINA MARKET SHARE ANALYSIS BY TYPE (2024)
FIGURE 173 ARGENTINA MARKET SHARE ANALYSIS BY END USER (2024)
FIGURE 174 COLUMBIA MARKET SHARE ANALYSIS BY TYPE (2024)
FIGURE 175 COLUMBIA MARKET SHARE ANALYSIS BY END USER (2024)
FIGURE 176 GLOBAL WIRELESS TELECOM INFRASTRUCTURE CURRENT AND FUTURE MARKET KEY COUNTRY LEVEL ANALYSIS, 2024–2034, (USD MILLION)
FIGURE 177 FINANCIAL OVERVIEW:
Kay Players Analysis
Analyzing company stats: Okay, I need to be precise with the numbers. Crown Castle is expected to have around 115,000 small cells by 2025. For Ericsson, I can say they have over 150 commercial 5G agreements, possibly more than 160. ZTE seems prominent in China with a large number of 5G base stations shipped. But I should avoid using too specific numbers unless I’m sure of them. I'll use realistic placeholders where needed and proceed carefully.
ZTE: ZTE positions as a challenger with strong momentum across Asia Pacific and selected EMEA markets. The company focuses on radio access networks, core network solutions, and energy-efficient base stations tailored for dense 5G deployments. In 2025, ZTE expands Open RAN pilots with tier‑1 operators and scales AI-driven network management to reduce power consumption by 10–15% across high-traffic sites. Strategic initiatives include co-development agreements with regional carriers, green base station programs, and 5G-Advanced trials in industrial parks. ZTE’s differentiators are cost-competitive RAN portfolios, fast customization cycles, and deep exposure to public sector and enterprise private networks. You should view ZTE as a price-agile supplier with growing capability in software-centric orchestration.
Crown Castle: Crown Castle operates as a leader in U.S. shared infrastructure, with a focus on small cells, fiber backhaul, and towers. By 2025, the company manages more than 115,000 small cell nodes and over 85,000 route miles of fiber concentrated in major metros. Strategy centers on densification for 5G and enterprise edge, including neutral-host small cells for stadiums, campuses, and transit corridors. Crown Castle accelerates AI-based monitoring to improve uptime and cut truck rolls, while selectively recycling capital away from lower-yield assets. Differentiation lies in metro fiber depth, long-term anchor tenant contracts, and scale in high-demand urban clusters. For your portfolio, Crown Castle offers stable cash flows tied to multi-year leasing and predictable co-location revenue.
Ericsson: Ericsson is a global leader in 5G RAN and core networks, serving tier‑1 operators across North America, Europe, and APAC. The 2025 focus is 5G-Advanced, cloud-native cores, and network slicing for enterprise use cases. Ericsson reports robust software revenue growth from automation suites and standalone 5G cores, supported by more than 160 commercial 5G agreements and expanding private network deployments. Strategic moves include partnerships with hyperscalers for telco cloud, acquisitions in OSS/BSS automation, and joint labs for industrial connectivity. Differentiators are high-performance RAN, end-to-end security, and proven migration paths from LTE to SA 5G. You gain scale, reliability, and advanced service features that support premium ARPU and lower operating costs.
Mobilitie: Mobilitie operates as a niche player in neutral-host infrastructure with strong presence in venues, transportation, and campuses. The company designs and operates distributed antenna systems, small cells, and private wireless networks for high-density locations where macro coverage is insufficient. In 2025, Mobilitie focuses on multi-operator DAS upgrades for 5G, fiber extensions to edge hubs, and analytics-led performance assurance that increases throughput during peak events by 20–30%. Strategic initiatives include city partnerships for transit coverage, agreements with stadium operators, and cross-venue service models that standardize deployment and maintenance. Differentiators are turnkey venue solutions, flexible financing structures, and deep expertise in event traffic engineering. For investors, Mobilitie offers targeted growth with resilient long-term contracts and exposure to premium indoor data demand.
Key Market Players
Ericsson
Vertical Bridge
Samsung
Crown Castle
American Tower Corporation
ZTE
SBA Communications
TowerCo
AT&T Towers
Nokia
Mobilitie
Other Key Players
Driver
Surging Mobile Data and Connectivity Demand
By 2025, the wireless telecom infrastructure market will see record demand for high-speed, low-latency connectivity. Global mobile data traffic is increasing by more than 25% each year, driven by video streaming, cloud applications, and the rapid growth of IoT devices. With over 18 billion connected devices expected worldwide by 2030, telecom operators must expand network capacity and coverage in urban and semi-urban areas.
Sustained Infrastructure Investment Momentum
This rise in data usage is leading to ongoing investment in towers, base stations, fiber backhaul, and small cell networks. Operators are focusing on network densification to meet 5G performance standards and improve service quality. For investors, the scale and length of this infrastructure build-out indicate strong long-term revenue potential in both mature and rapidly growing emerging markets.
Restraint
High Capital Intensity of Network Deployment
The main challenge for faster infrastructure deployment is high costs. Building and maintaining modern wireless networks requires billions in capital investment, with 5G base stations costing up to 40% more than 4G ones. These increased costs burden operator finances, especially as expenses for spectrum acquisition, site leasing, and power continue to rise.
Extended Payback Periods and Financing Constraints
Operators frequently deal with payback periods that exceed 7 to 10 years due to long-term contracts, pricing pressure, and regulatory demands. Smaller and regional providers face even more challenges, as limited funding slows deployment in rural and underserved areas. This financial pressure could widen the digital divide and delay returns for stakeholders in capital-heavy markets.
Opportunity
IoT and Smart City Infrastructure Expansion
The fast growth of IoT ecosystems and smart city projects offers a multi-billion-dollar opportunity for wireless infrastructure providers. By 2025, global IoT connections are expected to surpass 30 billion, creating a need for dense, reliable networks that support real-time data exchange, edge computing, and critical applications.
Private 5G and Enterprise Network Demand
Smart city initiatives in Asia, the Middle East, and North America are boosting demand for advanced infrastructure like small cells and distributed antenna systems. Meanwhile, companies are investing in private 5G networks for industrial automation, logistics, and public safety. Infrastructure providers that align with government-supported digital transformation programs and enterprise connectivity needs can capture high-margin, long-term contracts.
Trend
Network Densification via Small Cells
A key trend in 2025 is the rapid densification of wireless networks through small cell deployments. In the United States alone, small cell installations are expected to exceed 1.5 million by 2026, reflecting a shift toward localized, high-capacity infrastructure that supports urban 5G use cases and indoor coverage needs.
AI-Driven Network Optimization
At the same time, operators are incorporating artificial intelligence and machine learning into network management. AI-enabled systems improve traffic flows, anticipate equipment failures, and cut operational costs through automation. This combination of physical infrastructure growth with smarter network management is changing competitive strategies, with leading companies investing in both asset ownership and digital capabilities as key differentiators.
Recent Developments
January 2025 – Swisscom: The company closed its acquisition of Vodafone Italia, a deal valued at €8 billion. This transaction combines Vodafone's mobile network with Swisscom's Italian subsidiary, Fastweb, and its fixed broadband infrastructure. The move creates a fully converged operator in Italy, poised to offer integrated fixed and mobile services to a broader customer base.
February 2025 – Nokia: Nokia finalized its $2.3 billion acquisition of Infinera, a provider of optical networking solutions. The deal significantly expands Nokia’s portfolio for cloud, data center, and service provider applications. This strengthens Nokia's ability to support next-generation network transport as data traffic continues to grow.
March 2025 – Zayo: Zayo completed its acquisition of Crown Castle’s fiber assets in a deal worth $4.25 billion. The transaction adds 90,000 route miles to Zayo's existing network. This purchase expands Zayo's fiber infrastructure, improving its capacity to handle increasing data demands from AI and enterprise clients.
April 2025 – T-Mobile: A joint venture between T-Mobile and private equity firm EQT received regulatory approval to acquire Lumos, a fiber-to-the-home provider. The partnership is a key part of T-Mobile’s fiber expansion plan. This acquisition accelerates T-Mobile’s goal of reaching 12–15 million homes with its fiber network by 2030.
May 2025 – AT&T: AT&T announced a $5.75 billion deal to acquire Lumen’s Mass Markets fiber internet business. The acquisition covers Lumen's consumer fiber connectivity operations. This investment deepens AT&T's commitment to its fiber network, which is essential for supporting its 5G services and future AI applications.