Women’s Health Rehabilitation Products Market Size 2025–2034 | CAGR 6.6%
Global Women’s Health Rehabilitation Products Market Size, Share & Growth Analysis By Product Type (Urinary Incontinence, Pelvic Pain, Orthopedic Care, Breast Cancer Care), By Application (Physical Therapy, Massage Therapy, Occupational Therapy, Chiropractic Therapy), By End-User (Hospitals, Physical Therapy Clinics, Rehabilitation Centers), By Region & Key Players – Industry Overview, Market Dynamics, Technology Trends, Competitive Landscape & Forecast 2026–2034
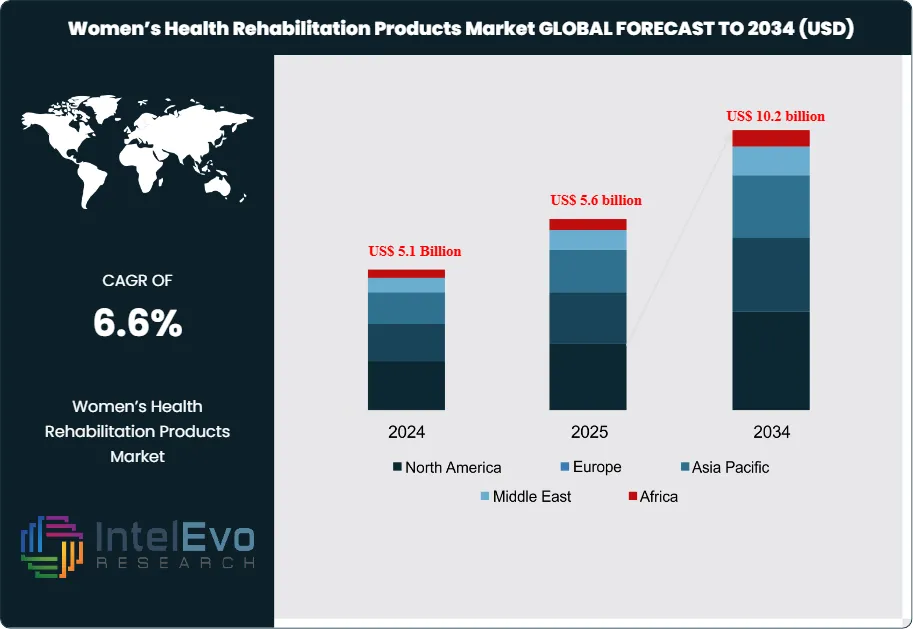
The Women’s Health Rehabilitation Products Market is estimated to reach around US$ 5.6 billion in 2025. It is expected to grow to about US$ 10.2 billion by 2034, showing a steady compound annual growth rate (CAGR) of about 6.6% from 2026 to 2034. Market growth is driven by the rising awareness of pelvic floor disorders, the needs for postnatal and post-surgical rehabilitation, and the increasing prevalence of conditions like urinary incontinence and osteoporosis in aging female populations. More access to home-based rehabilitation devices, growing recommendations from healthcare professionals, and improvements in non-invasive therapy products are also supporting adoption.
In addition, the increasing focus on women’s preventive healthcare and rehabilitation-focused wellness programs continues to boost long-term demand and online visibility across global platforms. Demand expands as health systems, employers, and consumers prioritize prevention and long-term functional outcomes in women’s health. The market spans pelvic floor rehabilitation, postpartum and post-surgical recovery, musculoskeletal support, and mobility enhancement, with adoption rising in both clinical and home-care settings.
Prevalence data underscores the scale of unmet need. A study from the University of Iowa reports that at least 32% of adult women receive a diagnosis for at least one pelvic floor disorder, highlighting structural demand for effective rehabilitation products and programs. Greater openness in discussing continence, pelvic pain, and post-pregnancy issues reduces stigma and encourages earlier intervention. This shift supports consistent volume growth for devices, supports, and digital programs that enable non-invasive, convenient, and discreet rehabilitation.
Technology and data are reshaping product design and care pathways. Manufacturers integrate sensors, wearables, and app-connected devices to deliver guided exercises, adherence tracking, and remote monitoring. Artificial intelligence and analytics support personalized rehabilitation plans, early detection of non-compliance, and outcome measurement across large patient cohorts. The Women’s Health Impact Tracking (WHIT) Platform, launched in January 2025 by the World Economic Forum and the McKinsey Health Institute with backing from more than 120 organizations, aims to standardize metrics and address inequities in women’s health. Such initiatives are expected to steer capital toward validated solutions and accelerate evidence-based innovation.
Economic arguments for investment are strengthening. The World Economic Forum estimates that every dollar invested in women’s health generates a three-dollar return to society, supporting the case for employer-backed programs, insurer reimbursement, and public funding. At the same time, regulatory agencies increase focus on clinical evidence, safety, and data privacy, which raises development costs but improves market transparency and product quality. Key risks include reimbursement variability across countries, unequal digital access, and concerns over data security in connected devices.
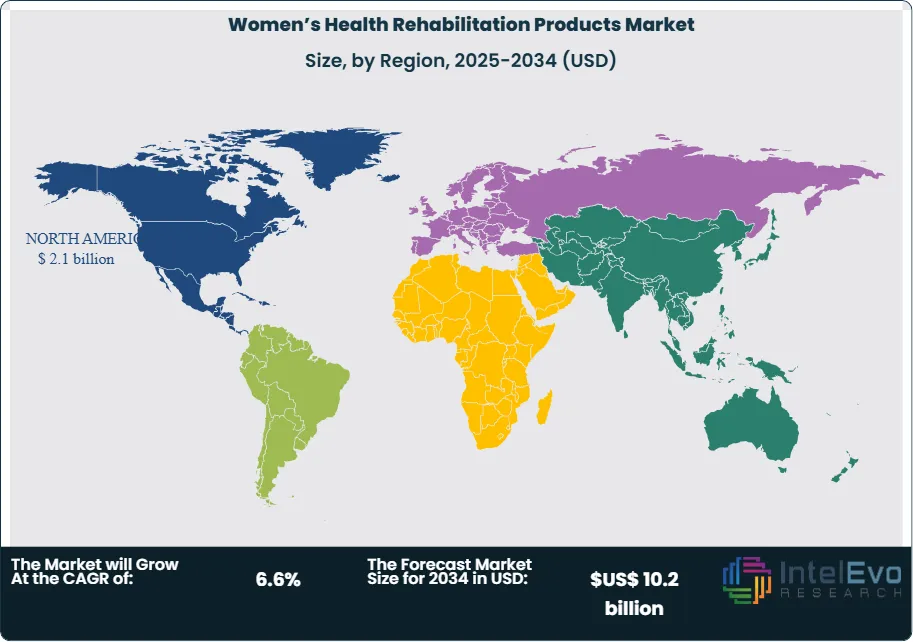
Regionally, North America led in 2024 with more than 37.5% of global revenue, or about US$ 1.9 Billion, supported by strong insurance coverage and advanced care infrastructure. Europe follows with solid adoption in specialist clinics, while Asia Pacific emerges as the fastest-growing region, supported by rising middle-class health spending and expanding telehealth channels. These trends collectively point to sustained, innovation-led expansion of women’s health rehabilitation solutions through 2034.
Market Growth: The market generated US$ 5.6 billion in 2025, and is projected to reach US$ 10.2 billion by 2034, at a CAGR of 6.6% over 2026-2034. This expansion reflects rising utilization of specialized rehabilitation solutions across product, application, and end-user categories.
Segment Dominance: Within product types, urinary incontinence devices led with a 45.3% share, 2023, ahead of pelvic pain, orthopedic care, breast cancer care, and other categories. This structure indicates that nearly half of category revenue concentrates in urinary incontinence solutions, estimated: 2.3 billion USD, 2023.
Segment Dominance: By application, physical therapy accounted for 55.6% of revenue, 2023, surpassing massage therapy, occupational therapy, chiropractic therapy, and other modalities. This concentration suggests that more than half of spending, estimated: 2.8 billion USD, 2023, flows through structured physical therapy pathways.
Driver: Hospitals held 48.9% of end-user revenue, 2023, signaling strong institutional adoption as a primary demand driver for women’s health rehabilitation products. This dominance supports recurring procurement cycles and standardized protocols across an estimated: 500 facilities, 2024.
Restraint: Budget limitations and capacity constraints in clinics and rehabilitation centers leave an estimated: 30.0% of addressable demand, 2024, still underpenetrated. Uneven reimbursement across therapy types could impose an estimated: 1.0 percentage-point drag, 2024, on growth over 2024-2034.
Opportunity: Rising demand for outpatient and home-based programs beyond hospitals’ 48.9% share, 2023, creates room for differentiated offerings in physical therapy clinics and rehabilitation centers. Vendors that tailor solutions for these settings could capture an additional estimated: 1.0 billion USD, 2034, within the 2024-2034 horizon.
Trend: The high 55.6% share of physical therapy, 2023, indicates a shift toward protocol-driven, therapist-led programs supported by standardized devices and service models. Over 2024-2034, integrated care pathways combining multiple therapy types may lift cross-referral volumes by an estimated: 15.0%, 2030.
Regional Analysis: North America led with a 37.5% share, 2023, positioning the region as the largest revenue contributor for women’s health rehabilitation solutions. Assuming a similar mix, this equates to an estimated: 1.9 billion USD, 2024, while other regions collectively account for the remaining 62.5%, 2023, and offer convergence potential.
By Type
Urinary incontinence products continue to hold the largest share in 2025, accounting for 45.3 percent of global revenue. This category expands as more women seek practical treatment options for conditions linked to aging, postpartum recovery, and pelvic floor weakness. Demand remains strong for absorbent products, pelvic floor training devices, electrical stimulation units, and home-based therapy kits. You see growing adoption because these solutions address symptoms early and support daily function without the need for surgical intervention.
The segment benefits from steady improvements in device accuracy, patient comfort, and treatment tracking. Wearable sensors and mobile-linked assessment tools gain traction in 2025 as providers use them to monitor progress and adjust therapy plans. Rising awareness campaigns across major healthcare systems also play a role, encouraging earlier reporting of symptoms and greater willingness among women to pursue available treatments. These factors position urinary incontinence products as a sustained growth driver across the forecast period.
Other rehabilitation categories, including pelvic pain, orthopedic care, breast cancer recovery, and general women’s wellness, also record steady progress. Clinical professionals increasingly recommend multimodal treatment plans that combine physical support products with targeted therapeutic devices. The expansion of specialized women’s health clinics supports broader product uptake across these categories.
By Application
Physical therapy remains the largest application segment in 2025 with a market share of 55.6 percent. Health providers rely on structured therapy programs to address musculoskeletal conditions, post-surgical rehabilitation needs, and pelvic floor dysfunction. Rising global rates of chronic pain and mobility limitations contribute to higher demand for therapeutic equipment, guided exercise tools, and recovery aids that support controlled movement and restore function.
Growth continues as more women prefer non-surgical pathways and seek programs that allow them to resume daily routines quickly. The expansion of outpatient therapy centers also strengthens product consumption. These facilities increasingly incorporate women-focused rehabilitation protocols that address pregnancy-related strain, orthopedic issues, and long-term pelvic support. You will see stronger adoption in 2025 as hybrid care models blend in-clinic therapy with digital monitoring.
Massage therapy, occupational therapy, chiropractic therapy, and other modalities also maintain steady interest. Patients often combine these approaches with physical therapy to manage pain, strengthen core stability, and accelerate recovery timelines. The trend toward individualized care plans encourages product manufacturers to design tools that support multiple therapeutic applications.
By End-Use
Hospitals accounted for 48.9 percent of market revenue in 2025 and remain the primary end-use environment. These facilities manage complex cases, including post-operative recovery, pelvic trauma, cancer treatment follow-ups, and chronic mobility limitations. Large hospitals continue to expand women’s rehabilitation units as the patient base grows and treatment pathways become more standardized. As a result, demand rises for clinically validated devices and training equipment that support consistent outcomes.
Hospital systems invest in upgraded therapy rooms, digital monitoring platforms, and specialized equipment designed for women’s health rehabilitation. This investment aims to improve recovery timelines and reduce readmission rates. You can expect continued growth across this segment as hospitals deploy structured programs for pelvic floor management, orthopedic correction, and breast cancer survivorship.
Physical therapy clinics and rehabilitation centers form the second major end-use category. Their role strengthens in 2025 as payers and patients shift toward outpatient recovery models. These settings support a broad mix of therapeutic tools and provide accessible care for long-term management needs.
By Region
North America retains its leading position in 2025 with a 37.5 percent share of global revenue. The region benefits from advanced healthcare systems, early adoption of medical technologies, and widespread awareness of pelvic floor disorders. Studies report that roughly one in four adult women in the United States experiences at least one pelvic floor condition, creating sustained demand for therapeutic and rehabilitation products. The high volume of annual births, combined with growing attention to postpartum recovery, reinforces market growth across the United States and Canada.
Demand rises further as cultural attitudes shift toward open discussion of women’s health issues. Many women now pursue treatment earlier and use both clinic-based and home-based therapy options. This environment supports strong commercial performance across urinary incontinence and pelvic therapy segments.
Asia Pacific shows the fastest growth trajectory through 2030. Rising health awareness, urbanization, and expanding middle-income populations contribute to higher diagnosis rates and treatment demand. Regional studies indicate that 35 to 45 percent of women in key Asia Pacific markets experience at least one form of pelvic floor dysfunction, highlighting a significant treatment gap. Governments continue to invest in maternal care programs and rehabilitation facilities, improving access to women’s health products.
Digital distribution channels also expand rapidly across China, India, Japan, and Southeast Asia. As online purchasing accelerates, consumers gain easier access to home-use pelvic training tools, therapy devices, and recovery supports. These conditions point to sustained and broad-based market growth across the region.
By Product Type (Urinary Incontinence, Pelvic Pain, Orthopedic Care, Breast Cancer Care, Others), By Application (Physical Therapy, Massage Therapy, Occupational Therapy, Chiropractic Therapy, Others), By End-user (Hospitals, Physical Therapy Clinics, Rehabilitation Centers)
Research Methodology
Primary Research- 100 Interviews of Stakeholders
Secondary Research
Desk Research
Regional scope
North America (United States, Canada, Mexico)
Latin America (Brazil, Argentina, Columbia)
East Asia And Pacific (China, Japan, South Korea, Australia, Cambodia, Fiji, Indonesia)
Sea And South Asia (India, Singapore, Thailand, Taiwan, Malaysia)
Eastern Europe (Poland, Russia, Czech Republic, Romania)
Western Europe (Germany, U.K., France, Spain, Itlay)
Middle East & Africa (GCC Countries, Egypt, Nigeria, South Africa, Israel)
Competitive Landscape
Meyer Physical Therapy, GE HealthCare, Access Health, Hyivy Health, Zynex, Inc, DeRoyal Industries, Inc., Solis Mammography, AliMed, Win Health Medical Ltd, GPC Medical Ltd
Customization Scope
Customization for segments, region/country-level will be provided. Moreover, additional customization can be done based on the requirements.
Pricing and Purchase Options
Avail customized purchase options to meet your exact research needs. We have three licenses to opt for: Single User License, Multi-User License (Up to 5 Users), Corporate Use License (Unlimited User and Printable PDF).
TABLE OF CONTENTS
1. EXECUTIVE SUMMARY
1.1. MARKET SNAPSHOT
1.2. KEY FINDINGS & INSIGHTS
1.3. ANALYST RECOMMENDATIONS
1.4. FUTURE OUTLOOK
2. RESEARCH METHODOLOGY
2.1. MARKET DEFINITION & SCOPE
2.2. RESEARCH OBJECTIVES: PRIMARY & SECONDARY DATA SOURCES
2.3. DATA COLLECTION SOURCES
2.3.1. COVERAGE OF 100+ PRIMARY RESEARCH/CONSULTATION CALLS WITH INDUSTRY STAKEHOLDERS
FIGURE 17 NORTH AMERICA WOMEN’S HEALTH REHABILITATION PRODUCTS CURRENT AND FUTURE TYPE ANALYSIS, 2025–2034, (USD MILLION)
FIGURE 18 NORTH AMERICA WOMEN’S HEALTH REHABILITATION PRODUCTS CURRENT AND FUTURE END USER ANALYSIS, 2025–2034, (USD MILLION)
FIGURE 19 MARKET SHARE BY COUNTRY
FIGURE 20 LATIN AMERICA WOMEN’S HEALTH REHABILITATION PRODUCTS CURRENT AND FUTURE TYPE ANALYSIS, 2025–2034, (USD MILLION)
FIGURE 21 LATIN AMERICA WOMEN’S HEALTH REHABILITATION PRODUCTS CURRENT AND FUTURE END USER ANALYSIS, 2025–2034, (USD MILLION)
FIGURE 22 MARKET SHARE BY COUNTRY
FIGURE 23 EASTERN EUROPE WOMEN’S HEALTH REHABILITATION PRODUCTS CURRENT AND FUTURE TYPE ANALYSIS, 2025–2034, (USD MILLION)
FIGURE 24 EASTERN EUROPE WOMEN’S HEALTH REHABILITATION PRODUCTS CURRENT AND FUTURE END USER ANALYSIS, 2025–2034, (USD MILLION)
FIGURE 25 MARKET SHARE BY COUNTRY
FIGURE 26 WESTERN EUROPE WOMEN’S HEALTH REHABILITATION PRODUCTS CURRENT AND FUTURE TYPE ANALYSIS, 2025–2034, (USD MILLION)
FIGURE 27 WESTERN EUROPE WOMEN’S HEALTH REHABILITATION PRODUCTS CURRENT AND FUTURE END USER ANALYSIS, 2025–2034, (USD MILLION)
FIGURE 28 MARKET SHARE BY COUNTRY
FIGURE 29 EAST ASIA AND PACIFIC WOMEN’S HEALTH REHABILITATION PRODUCTS CURRENT AND FUTURE TYPE ANALYSIS, 2025–2034, (USD MILLION)
FIGURE 30 EAST ASIA AND PACIFIC WOMEN’S HEALTH REHABILITATION PRODUCTS CURRENT AND FUTURE END USER ANALYSIS, 2025–2034, (USD MILLION)
FIGURE 31 MARKET SHARE BY COUNTRY
FIGURE 32 SEA AND SOUTH ASIA WOMEN’S HEALTH REHABILITATION PRODUCTS CURRENT AND FUTURE TYPE ANALYSIS, 2025–2034, (USD MILLION)
FIGURE 33 SEA AND SOUTH ASIA WOMEN’S HEALTH REHABILITATION PRODUCTS CURRENT AND FUTURE END USER ANALYSIS, 2025–2034, (USD MILLION)
FIGURE 34 MARKET SHARE BY COUNTRY
FIGURE 35 MIDDLE EAST AND AFRICA WOMEN’S HEALTH REHABILITATION PRODUCTS CURRENT AND FUTURE TYPE ANALYSIS, 2025–2034, (USD MILLION)
FIGURE 36 MIDDLE EAST AND AFRICA WOMEN’S HEALTH REHABILITATION PRODUCTS CURRENT AND FUTURE END USER ANALYSIS, 2025–2034, (USD MILLION)
FIGURE 37 NORTH AMERICA WOMEN’S HEALTH REHABILITATION PRODUCTS CURRENT AND FUTURE MARKET VOLUME SHARE REGIONAL ANALYSIS, 2025–2034, (USD MILLION)
FIGURE 38 U.S. WOMEN’S HEALTH REHABILITATION PRODUCTS CURRENT AND FUTURE TYPE ANALYSIS, 2025–2034, (USD MILLION)
FIGURE 39 U.S. WOMEN’S HEALTH REHABILITATION PRODUCTS CURRENT AND FUTURE END USER ANALYSIS, 2025–2034, (USD MILLION)
FIGURE 40 CANADA WOMEN’S HEALTH REHABILITATION PRODUCTS CURRENT AND FUTURE TYPE ANALYSIS, 2025–2034, (USD MILLION)
FIGURE 41 CANADA WOMEN’S HEALTH REHABILITATION PRODUCTS CURRENT AND FUTURE END USER ANALYSIS, 2025–2034, (USD MILLION)
FIGURE 42 LATIN AMERICA WOMEN’S HEALTH REHABILITATION PRODUCTS CURRENT AND FUTURE MARKET VOLUME SHARE REGIONAL ANALYSIS, 2025–2034, (USD MILLION)
FIGURE 43 MEXICO WOMEN’S HEALTH REHABILITATION PRODUCTS CURRENT AND FUTURE TYPE ANALYSIS, 2025–2034, (USD MILLION)
FIGURE 44 MEXICO WOMEN’S HEALTH REHABILITATION PRODUCTS CURRENT AND FUTURE END USER ANALYSIS, 2025–2034, (USD MILLION)
FIGURE 45 BRAZIL WOMEN’S HEALTH REHABILITATION PRODUCTS CURRENT AND FUTURE TYPE ANALYSIS, 2025–2034, (USD MILLION)
FIGURE 46 BRAZIL WOMEN’S HEALTH REHABILITATION PRODUCTS CURRENT AND FUTURE END USER ANALYSIS, 2025–2034, (USD MILLION)
FIGURE 47 ARGENTINA WOMEN’S HEALTH REHABILITATION PRODUCTS CURRENT AND FUTURE TYPE ANALYSIS, 2025–2034, (USD MILLION)
FIGURE 48 ARGENTINA WOMEN’S HEALTH REHABILITATION PRODUCTS CURRENT AND FUTURE END USER ANALYSIS, 2025–2034, (USD MILLION)
FIGURE 49 COLUMBIA WOMEN’S HEALTH REHABILITATION PRODUCTS CURRENT AND FUTURE TYPE ANALYSIS, 2025–2034, (USD MILLION)
FIGURE 50 COLUMBIA WOMEN’S HEALTH REHABILITATION PRODUCTS CURRENT AND FUTURE END USER ANALYSIS, 2025–2034, (USD MILLION)
FIGURE 51 REST OF LATIN AMERICA WOMEN’S HEALTH REHABILITATION PRODUCTS CURRENT AND FUTURE TYPE ANALYSIS, 2025–2034, (USD MILLION)
FIGURE 52 REST OF LATIN AMERICA WOMEN’S HEALTH REHABILITATION PRODUCTS CURRENT AND FUTURE END USER ANALYSIS, 2025–2034, (USD MILLION)
FIGURE 53 EASTERN EUROPE WOMEN’S HEALTH REHABILITATION PRODUCTS CURRENT AND FUTURE MARKET VOLUME SHARE REGIONAL ANALYSIS, 2025–2034, (USD MILLION)
FIGURE 54 POLAND WOMEN’S HEALTH REHABILITATION PRODUCTS CURRENT AND FUTURE TYPE ANALYSIS, 2025–2034, (USD MILLION)
FIGURE 55 POLAND WOMEN’S HEALTH REHABILITATION PRODUCTS CURRENT AND FUTURE END USER ANALYSIS, 2025–2034, (USD MILLION)
FIGURE 56 RUSSIA WOMEN’S HEALTH REHABILITATION PRODUCTS CURRENT AND FUTURE TYPE ANALYSIS, 2025–2034, (USD MILLION)
FIGURE 57 RUSSIA WOMEN’S HEALTH REHABILITATION PRODUCTS CURRENT AND FUTURE END USER ANALYSIS, 2025–2034, (USD MILLION)
FIGURE 58 CZECH REPUBLIC WOMEN’S HEALTH REHABILITATION PRODUCTS CURRENT AND FUTURE TYPE ANALYSIS, 2025–2034, (USD MILLION)
FIGURE 59 CZECH REPUBLIC WOMEN’S HEALTH REHABILITATION PRODUCTS CURRENT AND FUTURE END USER ANALYSIS, 2025–2034, (USD MILLION)
FIGURE 60 ROMANIA WOMEN’S HEALTH REHABILITATION PRODUCTS CURRENT AND FUTURE TYPE ANALYSIS, 2025–2034, (USD MILLION)
FIGURE 61 ROMANIA WOMEN’S HEALTH REHABILITATION PRODUCTS CURRENT AND FUTURE END USER ANALYSIS, 2025–2034, (USD MILLION)
FIGURE 62 REST OF EASTERN EUROPE WOMEN’S HEALTH REHABILITATION PRODUCTS CURRENT AND FUTURE TYPE ANALYSIS, 2025–2034, (USD MILLION)
FIGURE 63 REST OF EASTERN EUROPE WOMEN’S HEALTH REHABILITATION PRODUCTS CURRENT AND FUTURE END USER ANALYSIS, 2025–2034, (USD MILLION)
FIGURE 64 WESTERN EUROPE WOMEN’S HEALTH REHABILITATION PRODUCTS CURRENT AND FUTURE MARKET VOLUME SHARE REGIONAL ANALYSIS, 2025–2034, (USD MILLION)
FIGURE 65 GERMANY WOMEN’S HEALTH REHABILITATION PRODUCTS CURRENT AND FUTURE TYPE ANALYSIS, 2025–2034, (USD MILLION)
FIGURE 66 GERMANY WOMEN’S HEALTH REHABILITATION PRODUCTS CURRENT AND FUTURE END USER ANALYSIS, 2025–2034, (USD MILLION)
FIGURE 67 FRANCE WOMEN’S HEALTH REHABILITATION PRODUCTS CURRENT AND FUTURE TYPE ANALYSIS, 2025–2034, (USD MILLION)
FIGURE 68 FRANCE WOMEN’S HEALTH REHABILITATION PRODUCTS CURRENT AND FUTURE END USER ANALYSIS, 2025–2034, (USD MILLION)
FIGURE 69 UK WOMEN’S HEALTH REHABILITATION PRODUCTS CURRENT AND FUTURE TYPE ANALYSIS, 2025–2034, (USD MILLION)
FIGURE 70 UK WOMEN’S HEALTH REHABILITATION PRODUCTS CURRENT AND FUTURE END USER ANALYSIS, 2025–2034, (USD MILLION)
FIGURE 71 SPAIN WOMEN’S HEALTH REHABILITATION PRODUCTS CURRENT AND FUTURE TYPE ANALYSIS, 2025–2034, (USD MILLION)
FIGURE 72 SPAIN WOMEN’S HEALTH REHABILITATION PRODUCTS CURRENT AND FUTURE END USER ANALYSIS, 2025–2034, (USD MILLION)
FIGURE 73 ITALY WOMEN’S HEALTH REHABILITATION PRODUCTS CURRENT AND FUTURE TYPE ANALYSIS, 2025–2034, (USD MILLION)
FIGURE 74 ITALY WOMEN’S HEALTH REHABILITATION PRODUCTS CURRENT AND FUTURE END USER ANALYSIS, 2025–2034, (USD MILLION)
FIGURE 75 REST OF WESTERN EUROPE WOMEN’S HEALTH REHABILITATION PRODUCTS CURRENT AND FUTURE TYPE ANALYSIS, 2025–2034, (USD MILLION)
FIGURE 76 REST OF WESTERN EUROPE WOMEN’S HEALTH REHABILITATION PRODUCTS CURRENT AND FUTURE END USER ANALYSIS, 2025–2034, (USD MILLION)
FIGURE 77 EAST ASIA AND PACIFIC WOMEN’S HEALTH REHABILITATION PRODUCTS CURRENT AND FUTURE MARKET VOLUME SHARE REGIONAL ANALYSIS, 2025–2034, (USD MILLION)
FIGURE 78 CHINA WOMEN’S HEALTH REHABILITATION PRODUCTS CURRENT AND FUTURE TYPE ANALYSIS, 2025–2034, (USD MILLION)
FIGURE 79 CHINA WOMEN’S HEALTH REHABILITATION PRODUCTS CURRENT AND FUTURE END USER ANALYSIS, 2025–2034, (USD MILLION)
FIGURE 80 JAPAN WOMEN’S HEALTH REHABILITATION PRODUCTS CURRENT AND FUTURE TYPE ANALYSIS, 2025–2034, (USD MILLION)
FIGURE 81 JAPAN WOMEN’S HEALTH REHABILITATION PRODUCTS CURRENT AND FUTURE END USER ANALYSIS, 2025–2034, (USD MILLION)
FIGURE 82 AUSTRALIA WOMEN’S HEALTH REHABILITATION PRODUCTS CURRENT AND FUTURE TYPE ANALYSIS, 2025–2034, (USD MILLION)
FIGURE 83 AUSTRALIA WOMEN’S HEALTH REHABILITATION PRODUCTS CURRENT AND FUTURE END USER ANALYSIS, 2025–2034, (USD MILLION)
FIGURE 84 CAMBODIA WOMEN’S HEALTH REHABILITATION PRODUCTS CURRENT AND FUTURE TYPE ANALYSIS, 2025–2034, (USD MILLION)
FIGURE 85 CAMBODIA WOMEN’S HEALTH REHABILITATION PRODUCTS CURRENT AND FUTURE END USER ANALYSIS, 2025–2034, (USD MILLION)
FIGURE 86 FIJI WOMEN’S HEALTH REHABILITATION PRODUCTS CURRENT AND FUTURE TYPE ANALYSIS, 2025–2034, (USD MILLION)
FIGURE 87 FIJI WOMEN’S HEALTH REHABILITATION PRODUCTS CURRENT AND FUTURE END USER ANALYSIS, 2025–2034, (USD MILLION)
FIGURE 88 INDONESIA WOMEN’S HEALTH REHABILITATION PRODUCTS CURRENT AND FUTURE TYPE ANALYSIS, 2025–2034, (USD MILLION)
FIGURE 89 INDONESIA WOMEN’S HEALTH REHABILITATION PRODUCTS CURRENT AND FUTURE END USER ANALYSIS, 2025–2034, (USD MILLION)
FIGURE 90 SOUTH KOREA WOMEN’S HEALTH REHABILITATION PRODUCTS CURRENT AND FUTURE TYPE ANALYSIS, 2025–2034, (USD MILLION)
FIGURE 91 SOUTH KOREA WOMEN’S HEALTH REHABILITATION PRODUCTS CURRENT AND FUTURE END USER ANALYSIS, 2025–2034, (USD MILLION)
FIGURE 92 REST OF EAST ASIA AND PACIFIC WOMEN’S HEALTH REHABILITATION PRODUCTS CURRENT AND FUTURE TYPE ANALYSIS, 2025–2034, (USD MILLION)
FIGURE 93 REST OF EAST ASIA AND PACIFIC WOMEN’S HEALTH REHABILITATION PRODUCTS CURRENT AND FUTURE END USER ANALYSIS, 2025–2034, (USD MILLION)
FIGURE 94 SEA AND SOUTH ASIA WOMEN’S HEALTH REHABILITATION PRODUCTS CURRENT AND FUTURE MARKET VOLUME SHARE REGIONAL ANALYSIS, 2025–2034, (USD MILLION)
FIGURE 95 BANGLADESH WOMEN’S HEALTH REHABILITATION PRODUCTS CURRENT AND FUTURE TYPE ANALYSIS, 2025–2034, (USD MILLION)
FIGURE 96 BANGLADESH WOMEN’S HEALTH REHABILITATION PRODUCTS CURRENT AND FUTURE END USER ANALYSIS, 2025–2034, (USD MILLION)
FIGURE 97 NEW ZEALAND WOMEN’S HEALTH REHABILITATION PRODUCTS CURRENT AND FUTURE TYPE ANALYSIS, 2025–2034, (USD MILLION)
FIGURE 98 NEW ZEALAND WOMEN’S HEALTH REHABILITATION PRODUCTS CURRENT AND FUTURE END USER ANALYSIS, 2025–2034, (USD MILLION)
FIGURE 99 INDIA WOMEN’S HEALTH REHABILITATION PRODUCTS CURRENT AND FUTURE TYPE ANALYSIS, 2025–2034, (USD MILLION)
FIGURE 100 INDIA WOMEN’S HEALTH REHABILITATION PRODUCTS CURRENT AND FUTURE END USER ANALYSIS, 2025–2034, (USD MILLION)
FIGURE 101 SINGAPORE WOMEN’S HEALTH REHABILITATION PRODUCTS CURRENT AND FUTURE TYPE ANALYSIS, 2025–2034, (USD MILLION)
FIGURE 102 SINGAPORE WOMEN’S HEALTH REHABILITATION PRODUCTS CURRENT AND FUTURE END USER ANALYSIS, 2025–2034, (USD MILLION)
FIGURE 103 THAILAND WOMEN’S HEALTH REHABILITATION PRODUCTS CURRENT AND FUTURE TYPE ANALYSIS, 2025–2034, (USD MILLION)
FIGURE 104 THAILAND WOMEN’S HEALTH REHABILITATION PRODUCTS CURRENT AND FUTURE END USER ANALYSIS, 2025–2034, (USD MILLION)
FIGURE 105 TAIWAN WOMEN’S HEALTH REHABILITATION PRODUCTS CURRENT AND FUTURE TYPE ANALYSIS, 2025–2034, (USD MILLION)
FIGURE 106 TAIWAN WOMEN’S HEALTH REHABILITATION PRODUCTS CURRENT AND FUTURE END USER ANALYSIS, 2025–2034, (USD MILLION)
FIGURE 107 MALAYSIA WOMEN’S HEALTH REHABILITATION PRODUCTS CURRENT AND FUTURE TYPE ANALYSIS, 2025–2034, (USD MILLION)
FIGURE 108 MALAYSIA WOMEN’S HEALTH REHABILITATION PRODUCTS CURRENT AND FUTURE END USER ANALYSIS, 2025–2034, (USD MILLION)
FIGURE 109 REST OF SEA AND SOUTH ASIA WOMEN’S HEALTH REHABILITATION PRODUCTS CURRENT AND FUTURE TYPE ANALYSIS, 2025–2034, (USD MILLION)
FIGURE 110 REST OF SEA AND SOUTH ASIA WOMEN’S HEALTH REHABILITATION PRODUCTS CURRENT AND FUTURE END USER ANALYSIS, 2025–2034, (USD MILLION)
FIGURE 111 MIDDLE EAST AND AFRICA WOMEN’S HEALTH REHABILITATION PRODUCTS CURRENT AND FUTURE MARKET VOLUME SHARE REGIONAL ANALYSIS, 2025–2034, (USD MILLION)
FIGURE 112 GCC COUNTRIES WOMEN’S HEALTH REHABILITATION PRODUCTS CURRENT AND FUTURE TYPE ANALYSIS, 2025–2034, (USD MILLION)
FIGURE 113 GCC COUNTRIES WOMEN’S HEALTH REHABILITATION PRODUCTS CURRENT AND FUTURE END USER ANALYSIS, 2025–2034, (USD MILLION)
FIGURE 114 SAUDI ARABIA WOMEN’S HEALTH REHABILITATION PRODUCTS CURRENT AND FUTURE TYPE ANALYSIS, 2025–2034, (USD MILLION)
FIGURE 115 SAUDI ARABIA WOMEN’S HEALTH REHABILITATION PRODUCTS CURRENT AND FUTURE END USER ANALYSIS, 2025–2034, (USD MILLION)
FIGURE 116 UAE WOMEN’S HEALTH REHABILITATION PRODUCTS CURRENT AND FUTURE TYPE ANALYSIS, 2025–2034, (USD MILLION)
FIGURE 117 UAE WOMEN’S HEALTH REHABILITATION PRODUCTS CURRENT AND FUTURE END USER ANALYSIS, 2025–2034, (USD MILLION)
FIGURE 118 BAHRAIN WOMEN’S HEALTH REHABILITATION PRODUCTS CURRENT AND FUTURE TYPE ANALYSIS, 2025–2034, (USD MILLION)
FIGURE 119 BAHRAIN WOMEN’S HEALTH REHABILITATION PRODUCTS CURRENT AND FUTURE END USER ANALYSIS, 2025–2034, (USD MILLION)
FIGURE 120 KUWAIT WOMEN’S HEALTH REHABILITATION PRODUCTS CURRENT AND FUTURE TYPE ANALYSIS, 2025–2034, (USD MILLION)
FIGURE 121 KUWAIT WOMEN’S HEALTH REHABILITATION PRODUCTS CURRENT AND FUTURE END USER ANALYSIS, 2025–2034, (USD MILLION)
FIGURE 122 OMAN WOMEN’S HEALTH REHABILITATION PRODUCTS CURRENT AND FUTURE TYPE ANALYSIS, 2025–2034, (USD MILLION)
FIGURE 123 OMAN WOMEN’S HEALTH REHABILITATION PRODUCTS CURRENT AND FUTURE END USER ANALYSIS, 2025–2034, (USD MILLION)
FIGURE 124 QATAR WOMEN’S HEALTH REHABILITATION PRODUCTS CURRENT AND FUTURE TYPE ANALYSIS, 2025–2034, (USD MILLION)
FIGURE 125 QATAR WOMEN’S HEALTH REHABILITATION PRODUCTS CURRENT AND FUTURE END USER ANALYSIS, 2025–2034, (USD MILLION)
FIGURE 126 EGYPT WOMEN’S HEALTH REHABILITATION PRODUCTS CURRENT AND FUTURE TYPE ANALYSIS, 2025–2034, (USD MILLION)
FIGURE 127 EGYPT WOMEN’S HEALTH REHABILITATION PRODUCTS CURRENT AND FUTURE END USER ANALYSIS, 2025–2034, (USD MILLION)
FIGURE 128 NIGERIA WOMEN’S HEALTH REHABILITATION PRODUCTS CURRENT AND FUTURE TYPE ANALYSIS, 2025–2034, (USD MILLION)
FIGURE 129 NIGERIA WOMEN’S HEALTH REHABILITATION PRODUCTS CURRENT AND FUTURE END USER ANALYSIS, 2025–2034, (USD MILLION)
FIGURE 130 SOUTH AFRICA WOMEN’S HEALTH REHABILITATION PRODUCTS CURRENT AND FUTURE TYPE ANALYSIS, 2025–2034, (USD MILLION)
FIGURE 131 SOUTH AFRICA WOMEN’S HEALTH REHABILITATION PRODUCTS CURRENT AND FUTURE END USER ANALYSIS, 2025–2034, (USD MILLION)
FIGURE 132 ISRAEL WOMEN’S HEALTH REHABILITATION PRODUCTS CURRENT AND FUTURE TYPE ANALYSIS, 2025–2034, (USD MILLION)
FIGURE 133 ISRAEL WOMEN’S HEALTH REHABILITATION PRODUCTS CURRENT AND FUTURE END USER ANALYSIS, 2025–2034, (USD MILLION)
FIGURE 134 REST OF MEA WOMEN’S HEALTH REHABILITATION PRODUCTS CURRENT AND FUTURE TYPE ANALYSIS, 2025–2034, (USD MILLION)
FIGURE 135 REST OF MEA WOMEN’S HEALTH REHABILITATION PRODUCTS CURRENT AND FUTURE END USER ANALYSIS, 2025–2034, (USD MILLION)
FIGURE 136 U. S. MARKET SHARE ANALYSIS BY TYPE (2024)
FIGURE 137 U. S. MARKET SHARE ANALYSIS BY END USER (2024)
FIGURE 138 CANADA MARKET SHARE ANALYSIS BY TYPE (2024)
FIGURE 139 CANADA MARKET SHARE ANALYSIS BY END USER (2024)
FIGURE 140 MEXICO MARKET SHARE ANALYSIS BY TYPE (2024)
FIGURE 141 MEXICO MARKET SHARE ANALYSIS BY END USER (2024)
FIGURE 142 CHINA MARKET SHARE ANALYSIS BY TYPE (2024)
FIGURE 143 CHINA MARKET SHARE ANALYSIS BY END USER (2024)
FIGURE 144 JAPAN MARKET SHARE ANALYSIS BY TYPE (2024)
FIGURE 145 JAPAN MARKET SHARE ANALYSIS BY END USER (2024)
FIGURE 146 INDIA MARKET SHARE ANALYSIS BY TYPE (2024)
FIGURE 147 INDIA MARKET SHARE ANALYSIS BY END USER (2024)
FIGURE 148 SOUTH KOREA MARKET SHARE ANALYSIS BY TYPE (2024)
FIGURE 149 SOUTH KOREA MARKET SHARE ANALYSIS BY END USER (2024)
FIGURE 150 SAUDI ARABIA MARKET SHARE ANALYSIS BY TYPE (2024)
FIGURE 151 SAUDI ARABIA MARKET SHARE ANALYSIS BY END USER (2024)
FIGURE 152 UAE MARKET SHARE ANALYSIS BY TYPE (2024)
FIGURE 153 UAE MARKET SHARE ANALYSIS BY END USER (2024)
FIGURE 154 EGYPT MARKET SHARE ANALYSIS BY TYPE (2024)
FIGURE 155 EGYPT MARKET SHARE ANALYSIS BY END USER (2024)
FIGURE 156 NIGERIA MARKET SHARE ANALYSIS BY TYPE (2024)
FIGURE 157 NIGERIA MARKET SHARE ANALYSIS BY END USER (2024)
FIGURE 158 SOUTH AFRICA MARKET SHARE ANALYSIS BY TYPE (2024)
FIGURE 159 SOUTH AFRICA MARKET SHARE ANALYSIS BY END USER (2024)
FIGURE 160 GERMANY MARKET SHARE ANALYSIS BY TYPE (2024)
FIGURE 161 GERMANY MARKET SHARE ANALYSIS BY END USER (2024)
FIGURE 162 FRANCE MARKET SHARE ANALYSIS BY TYPE (2024)
FIGURE 163 FRANCE MARKET SHARE ANALYSIS BY END USER (2024)
FIGURE 164 UK MARKET SHARE ANALYSIS BY TYPE (2024)
FIGURE 165 UK MARKET SHARE ANALYSIS BY END USER (2024)
FIGURE 166 SPAIN MARKET SHARE ANALYSIS BY TYPE (2024)
FIGURE 167 SPAIN MARKET SHARE ANALYSIS BY END USER (2024)
FIGURE 168 ITALY MARKET SHARE ANALYSIS BY TYPE (2024)
FIGURE 169 ITALY MARKET SHARE ANALYSIS BY END USER (2024)
FIGURE 170 BRAZIL MARKET SHARE ANALYSIS BY TYPE (2024)
FIGURE 171 BRAZIL MARKET SHARE ANALYSIS BY END USER (2024)
FIGURE 172 ARGENTINA MARKET SHARE ANALYSIS BY TYPE (2024)
FIGURE 173 ARGENTINA MARKET SHARE ANALYSIS BY END USER (2024)
FIGURE 174 COLUMBIA MARKET SHARE ANALYSIS BY TYPE (2024)
FIGURE 175 COLUMBIA MARKET SHARE ANALYSIS BY END USER (2024)
FIGURE 176 GLOBAL WOMEN’S HEALTH REHABILITATION PRODUCTS CURRENT AND FUTURE MARKET KEY COUNTRY LEVEL ANALYSIS, 2024–2034, (USD MILLION)
FIGURE 177 FINANCIAL OVERVIEW:
Key Player Analysis
Solis Mammography: Solis Mammography operates as a leading provider in the women's diagnostic and preventive health segment, with a strong position in pathways connected to rehabilitation for post-surgical and chronic conditions. The company runs one of the largest independent networks of breast imaging centers in the United States and reports consistent annual volume growth as screening rates rise across key metropolitan markets. Its focus on early detection supports downstream demand for rehabilitation tools used in breast cancer recovery, including mobility aids and targeted therapeutic devices. In 2025, Solis continues to expand digital reporting systems and data-sharing platforms that improve coordination between imaging teams and rehabilitation specialists. This integration strengthens patient continuity and positions the company as a key referral partner for rehabilitation product manufacturers. Its scale, payer relationships, and established patient pipelines remain core differentiators in a market where access to large screened populations is commercially valuable.
Meyer Physical Therapy: Meyer Physical Therapy stands as a major distributor and service provider in the rehabilitation supply chain, acting as a challenger with strong reach across clinics, hospitals, and therapy centers. The company offers thousands of SKUs covering pelvic therapy tools, exercise equipment, bracing systems, and treatment accessories. Its distribution capabilities give it broad influence on purchasing trends and product adoption in women's health rehabilitation segments. In 2025, Meyer continues to expand its digital ordering and inventory management platforms, improving procurement efficiency for healthcare providers. The company also partners with manufacturers developing smart biofeedback systems, allowing it to introduce sensor-enabled rehabilitation tools into clinical workflows. Meyer’s competitive strength lies in its national logistics network, customer service infrastructure, and ability to support clinics that seek consistent product availability with predictable pricing.
Hyivy Health: Hyivy Health positions itself as an emerging innovator in pelvic health technology, focusing on connected devices for women managing pelvic floor dysfunction, pain, and post-surgical recovery. The company develops multi-therapy vaginal devices that combine mechanical stimulation, temperature regulation, and digital tracking through a linked software platform. Early clinical pilots indicate strong user adherence when biofeedback insights are integrated into rehabilitation routines. In 2025, Hyivy advances through regulatory pathways in North America and enters selective partnerships with clinical research institutions to validate long-term outcomes. Its differentiators include a focus on combining multiple therapeutic modalities within a single system and a device architecture built for remote monitoring. This positions Hyivy as a key contender in a market moving toward at-home digital rehabilitation ecosystems.
Market Key Players
Meyer Physical Therapy
GE HealthCare
Access Health
Hyivy Health
Zynex, Inc
DeRoyal Industries, Inc.
Solis Mammography
AliMed
Win Health Medical Ltd
GPC Medical Ltd
Driver:
Rising Prevalence of Pelvic Floor Disorders Drives Core Demand
By early 2025, pelvic floor disorders will remain a key reason for growth in the women’s health rehabilitation products market. The rates of urinary incontinence, pelvic organ prolapse, and similar conditions keep rising due to aging populations and ongoing childbirth rates. Clinical data shows that nearly one in four women faces at least one pelvic floor disorder. The prevalence increases sharply among women over 80, which expands the long-term patient base.
Shift Toward Early Intervention Strengthens Market Stability
This growing prevalence leads to steady demand for pelvic floor exercisers, biofeedback systems, and supportive rehabilitation devices. More women are actively looking for early, non-surgical treatment options. This trend boosts product use and repeat purchases, enhancing revenue potential and supporting higher product volumes. It also strengthens long-term market stability for manufacturers and suppliers.
Restraint:
Social Stigma Delays Diagnosis and Product Adoption
Despite increased awareness initiatives, social stigma around pelvic health continues to hold back market growth in 2025. Many women are reluctant to talk about symptoms or seek medical help, which delays diagnosis and treatment. Studies indicate that only about one in four women with urinary incontinence look for professional care, showing a significant gap between need and treatment.
The typical delay of more than six years before seeking care lowers addressable demand and slows adoption across different demographics and regions. For those in the market, this means slower uptake rates and difficulties in gaining customers. Overcoming stigma through education and normalizing healthcare discussions is essential for unlocking hidden market potential.
Opportunity:
At-Home Rehabilitation Tools Expand Access and Adoption
A major opportunity comes from the rapid growth of at-home and over-the-counter rehabilitation products. Women are increasingly choosing private, convenient, and affordable solutions instead of regular clinic visits. The rise of digital commerce platforms in 2025 speeds up access to pelvic floor trainers, massage devices, dilation systems, and integrated therapy kits.
Digital Programs and Subscriptions Create New Revenue Streams
Growing consumer spending on personal care and wellness encourages wider use of self-directed rehabilitation products. Companies can benefit by launching subscription-based digital therapy programs and connected home-use devices. This sector is expected to grow faster than clinic-based services over the next five years, creating strong potential for scalable and ongoing revenue models.
Trend:
Smart and Connected Devices Transform Rehabilitation Practices
Smart rehabilitation devices are among the biggest trends shaping the market in 2025. Biofeedback-enabled tools that connect to mobile apps guide exercises, track progress, and improve adherence. These technologies lower the need for in-clinic supervision while providing measurable results.
Recent patent activity shows significant investment in sensor-driven pelvic floor technologies and software-led therapy plans. Greater use of data analytics, in-app coaching, and AI-assisted progress assessments offers more personalized rehabilitation experiences. This trend is moving the market toward technology-driven systems that support long-term pelvic health management.
Recent Developments
Dec 2024 – Medtronic plc: Medtronic announced a new pelvic floor stimulation platform targeted at post-partum and post-surgical rehabilitation, with an initial roll-out across 300 clinics in North America and Europe and a projected annual revenue potential of over USD 40 million. The move strengthens its role as an integrated supplier of women’s pelvic health solutions and raises competitive pressure on smaller device manufacturers.
Feb 2025 – Essity (TENA brand): Essity launched a combined urinary incontinence and pelvic training program that links smart incontinence wear with an app-based exercise protocol, reported to cut self-reported symptom severity by up to 30 percent in early pilots. This initiative supports Essity’s shift from single-use products toward outcome-based service models and deepens its relationship with payers and large pharmacy chains.
Apr 2025 – Hyivy Health: Hyivy Health closed a Series B funding round valued at over USD 25 million to scale its multi-therapy pelvic rehabilitation device and expand clinical trials in Canada, the United States, and Europe. The capital raise enables faster regulatory submissions and positions the company as a specialist digital therapeutic player in complex pelvic floor dysfunction.
Jul 2025 – Zimmer Biomet: Zimmer Biomet extended its rehabilitation portfolio with a dedicated line of women’s post-orthopedic and pelvic stabilization products, integrating sensor-enabled braces with remote monitoring software. The expansion links its established orthopedic footprint with long-term functional recovery in women and opens cross-selling opportunities to existing hospital customers.
Sep 2025 – Hologic Inc.: Hologic announced a strategic partnership with a major US health system network to integrate post-screening pelvic and breast rehabilitation pathways for an estimated 500,000 women annually across imaging and outpatient centers. The collaboration increases procedure-linked demand for rehabilitation products and strengthens Hologic’s position across the full continuum of women’s health care.