
- Home
- Industries
 Aerospace And Defence
 Agriculture
 Automotive And Transportation
 Banking And Finance
 Business
 Chemicals And Materials
 Consumer And Retail
 Electronics And Semiconductors
 Food And Beverages
 Machinery & Equipments
 Manufacturing And Construction
 Medical Devices
 Others
 Pharmaceuticals And Healthcare
 Power And Energy
 Sports
 Technology
- Services
- News Room
- About us
- Contact Us
-
Global Zero-Energy Buildings Market Size & Growth Forecast 2025–2034
Global Zero-Energy Buildings Market Size, Share, Analysis Report By Building Type(Residential, Commercial, Industrial), Technology (Renewable Energy Systems, Energy Storage Systems, Energy Efficiency Technologies, Building Energy Management Systems), Region and Key Players - Industry Segment Overview, Market Dynamics, Competitive Strategies, Trends and Forecast 2025-2034

Report Overview:
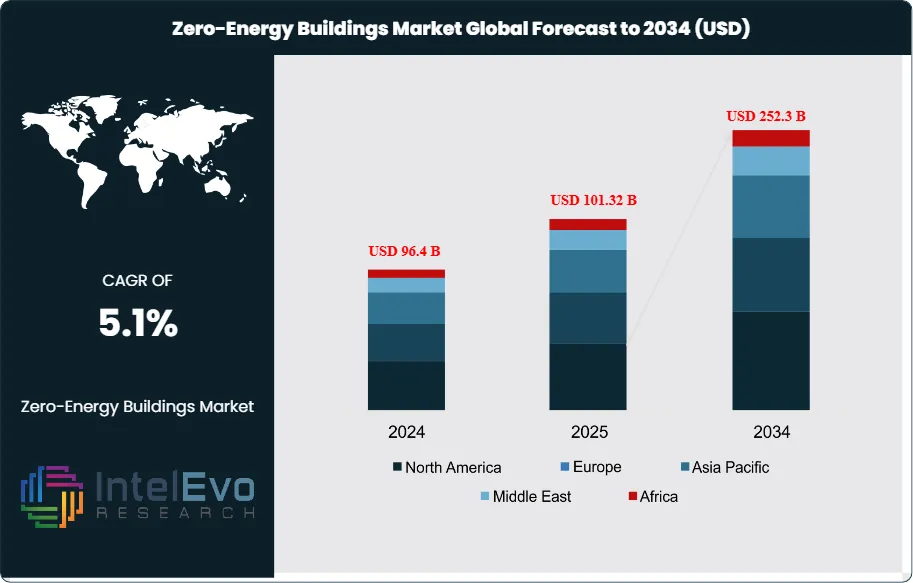
The Zero-Energy Buildings Market size is projected to reach approximately USD 252.3 Billion by 2034, up from USD 96.4 Billion in 2024, growing at a CAGR of 5.1% during the forecast period from 2025 to 2034. The market is witnessing strong growth due to rising demand for sustainable and energy-efficient construction, increasing government incentives for green buildings, and the integration of renewable energy sources like solar and wind. Advancements in smart building technologies, energy storage systems, and automated energy management solutions are further driving adoption. As urbanization intensifies, zero-energy buildings are becoming essential for reducing carbon footprints and promoting sustainable urban development worldwide.
Get More Information about this report -
Request Free Sample ReportThe Zero-Energy Buildings (ZEB) market is gaining traction across various sectors, primarily driven by the increasing emphasis on sustainability and energy efficiency. Zero-Energy Buildings are designed to produce as much energy as they consume over a year, typically utilizing renewable energy sources such as solar panels and wind turbines. This innovative approach significantly reduces greenhouse gas emissions and operational costs, making it an attractive option for both residential and commercial applications.
In the residential sector, ZEBs enhance energy independence and lower utility bills, appealing to eco-conscious homeowners. In commercial settings, organizations are investing in ZEBs to meet corporate sustainability goals, enhance brand reputation, and comply with stringent regulations on energy consumption and emissions. The education sector is also embracing this trend, with many new school constructions aimed at achieving zero energy status to serve as models of sustainability for students and communities.
The growth of the Zero-Energy Buildings market is propelled by advancements in building technologies, including energy-efficient HVAC systems, smart building automation, and improved insulation materials. Increased investment in research and development is further fostering innovation, leading to more effective energy management systems and renewable energy integration.
Geographically, North America and Europe are currently the largest markets for ZEBs, with numerous government incentives and policies supporting their development. However, the Asia-Pacific region is anticipated to experience the highest growth rate due to rapid urbanization, rising energy demands, and a strong push towards sustainable building practices.
Key players in the ZEB market include companies like Johnson Controls, Schneider Electric, and Siemens, which are focused on developing comprehensive energy solutions that support the design, construction, and operation of zero-energy buildings.
Despite the promising outlook, the Zero-Energy Buildings market faces challenges, including high initial investment costs and potential barriers related to building codes and standards. Additionally, the COVID-19 pandemic caused temporary disruptions in construction and supply chains, affecting project timelines. Nevertheless, the market is on a recovery path, driven by the increasing awareness of climate change and the need for energy-efficient buildings. As technologies continue to evolve, particularly in renewable energy and building materials, the demand for Zero-Energy Buildings is expected to rise significantly, solidifying their place in future urban development.
, Technology (Renewable Energy Systems, Energy Storage Systems, Energy Efficiency Technologies, Building Energy Management Systems), Region and Key Players - Industry Segment Overview, Market Dynamics, Competitive Strategies, Trends and Forecast 2025-2034")
Key Takeaways:
- Market Growth: The zero-energy buildings market is expected to reach USD 92.8 Billion by 2034, growing at a robust CAGR of 4.9%, indicating strong market expansion.
- Building Type: The Zero-Energy Buildings (ZEB) market includes various building types, primarily segmented into residential, commercial, and industrial categories. Residential ZEBs consist of single-family homes and multi-family units. Commercial ZEBs encompass offices, retail spaces, educational institutions, and healthcare facilities. Industrial ZEBs include factories, warehouses, and manufacturing plants. In terms of market share, residential buildings dominate, accounting for approximately 40% of the ZEB market, followed by commercial (35%) and industrial (25%) segments.
- Technology: The Zero-Energy Buildings market utilizes advanced technologies to achieve energy efficiency and sustainability. Key technologies include Renewable Energy Systems (like solar PV, wind, geothermal, and biomass), Energy Storage Systems (including lithium-ion and thermal storage), and Energy Efficiency Technologies (such as high-performance HVAC systems, smart lighting, and building automation). The market share for renewable energy systems is estimated to be around 40%, while energy efficiency technologies account for approximately 35%. Energy storage systems contribute about 25% to the overall market.
- Driver: The Zero-Energy Buildings market is driven by rising energy costs, increased regulatory support for sustainability, and growing consumer awareness of environmental impact. Technological advancements in renewable energy and energy efficiency also enhance building performance, while urbanization boosts demand for sustainable housing and commercial spaces. These factors collectively propel market growth.
- Restraint: The Zero-Energy Buildings market faces several restraints, including high upfront construction and technology costs, limited availability of skilled labor for advanced building techniques, and resistance to change from traditional construction practices. Additionally, inadequate regulatory frameworks and insufficient consumer awareness can hinder market growth and adoption of zero-energy solutions.
- Opportunity: he Zero-Energy Buildings market presents significant opportunities driven by increasing regulatory support, rising energy costs, and growing awareness of environmental sustainability. Advancements in renewable energy technologies and energy-efficient solutions further enhance market potential. Collaboration among stakeholders, including governments, builders, and technology providers, can accelerate the adoption of zero-energy practices.
- Trend: The Zero-Energy Buildings market presents opportunities in technological advancements, increased government support, rising energy costs, and growing consumer demand for sustainable living, driving innovation in energy-efficient design and renewable energy solutions.
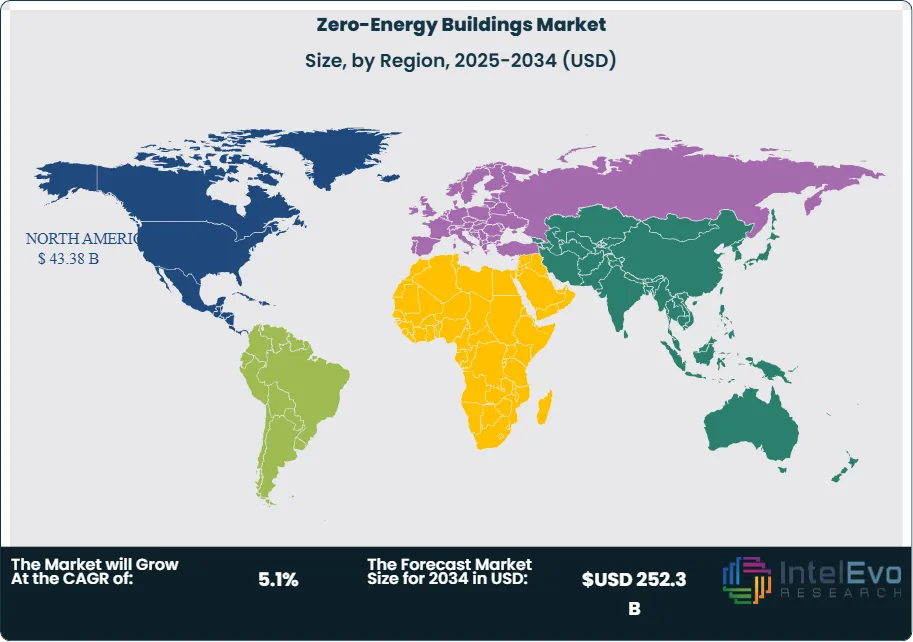
- Regional Analysis: North America is a leading region in the Zero-Energy Buildings market, driven by strong government incentives, growing consumer awareness, and advancements in renewable energy technologies. The U.S. and Canada are actively promoting sustainable building practices, resulting in significant investments in energy-efficient solutions and the adoption of zero-energy standards across residential and commercial sectors.
Building Type Analysis:
The dominant building type in the Zero-Energy Buildings (ZEB) market is commercial buildings, particularly offices and educational institutions. These structures benefit from extensive energy-efficient technologies and renewable energy systems, significantly reducing operational costs and environmental impact. The increasing emphasis on sustainability and corporate responsibility drives demand for energy-efficient designs in commercial spaces. Additionally, government incentives and regulations promote the adoption of zero-energy practices in commercial real estate, making it a key segment in the ZEB market.
Technology Analysis:
The dominant technology in the Zero-Energy Buildings (ZEB) market is Solar Photovoltaic (PV) Systems. These systems convert sunlight directly into electricity, making them a crucial component for achieving zero energy consumption. Solar PV technology is highly scalable, allowing for integration into various building types, from residential homes to commercial and industrial structures. Coupled with Energy Storage Systems, such as lithium-ion batteries, they enable buildings to store excess energy for use during peak demand or nighttime, enhancing energy efficiency. As costs continue to decline and efficiency improves, solar PV remains at the forefront of ZEB technology, driving sustainable building practices.
Region Analysis:
North America Leads with 45% Market Share in Zero-Energy Buildings Market: North America emerges as the dominant region in the Zero-Energy Buildings market, driven by robust government policies promoting sustainability and energy efficiency. The presence of leading technology firms and an increasing number of stakeholders focusing on renewable energy integration further solidify this position. High consumer awareness regarding environmental impacts, combined with favorable incentives for green building practices, has accelerated the adoption of zero-energy solutions. Urbanization trends and substantial investments in energy-efficient technologies have also contributed to North America's market leadership, positioning it as a key player in the global transition towards sustainable construction.
Asia-Pacific is experiencing rapid growth in the Zero-Energy Buildings market, with several countries prioritizing energy efficiency and sustainability initiatives. The region benefits from increasing urbanization, which fuels demand for innovative building solutions. Government support in the form of incentives and regulations promoting renewable energy usage significantly enhances market growth prospects. Countries like China and Japan are at the forefront, investing heavily in green building technologies and infrastructure. A rising middle class with heightened environmental awareness further drives the adoption of zero-energy buildings. This combination of factors positions Asia-Pacific as the region expanding at the fastest compound annual growth rate (CAGR).
Get More Information about this report -
Request Free Sample ReportKey Market Segment
By Building Type
- Residential Buildings (Single-family homes, Multi-family units)
- Commercial Buildings (Offices, Retail spaces, Educational institutions, Hospitals and healthcare facilities)
- Institutional Buildings
- Industrial Buildings (Factories, Warehouses, Manufacturing plants)
By Construction Material
- High-Performance Insulation Materials
- Energy-Efficient Windows & Doors
- Solar Panels & Photovoltaic Systems
- HVAC & Energy Management Systems
By Technology
- Solar Photovoltaic Systems
- Building-Integrated Renewable Energy (Solar Photovoltaic (PV) Systems, Wind Energy Systems, Geothermal Energy Systems, Biomass Energy Systems)
- Energy Storage Solutions (Battery Storage (Lithium-ion, Lead-acid), Thermal Energy Storage)
- Smart Energy Management Systems (High-performance HVAC Systems, Smart Lighting Solutions, Building Automation Systems, Insulation and Building Envelope Materials, Building Energy Management Systems (BEMS))
By End-User
- Government & Public Sector
- Real Estate Developers
- Commercial Enterprises
- Residential Consumers
By Region
- North America
- Latin America
- East Asia And Pacific
- Sea And South Asia
- Eastern Europe
- Western Europe
- Middle East & Africa
| Report Attribute | Details |
| Market size (2025) | USD 101.32 B |
| Forecast Revenue (2034) | USD 252.3 B |
| CAGR (2025-2034) | 5.1% |
| Historical data | 2018-2023 |
| Base Year For Estimation | 2024 |
| Forecast Period | 2025-2034 |
| Report coverage | Revenue Forecast, Competitive Landscape, Market Dynamics, Growth Factors, Trends and Recent Developments |
| Segments covered | By Building Type (Residential Buildings, Commercial Buildings, Institutional Buildings, Industrial Buildings), By Construction Material (High-Performance Insulation Materials, Energy-Efficient Windows & Doors, Solar Panels & Photovoltaic Systems, HVAC & Energy Management Systems), By Technology (Solar Photovoltaic Systems, Building-Integrated Renewable Energy, Energy Storage Solutions, Smart Energy Management Systems), By End-User (Government & Public Sector, Real Estate Developers, Commercial Enterprises, Residential Consumers) |
| Research Methodology |
|
| Regional scope |
|
| Competitive Landscape | Siemens AG, Schneider Electric, Johnson Controls International plc, Honeywell International Inc., Trane Technologies plc, General Electric Company (GE), Itron Inc., NREL (National Renewable Energy Lab), WSP Global Inc., Fujitsu Ltd., Mitsubishi Electric Corporation, Kingspan Group, Veolia Environnement S.A., Arcadia Power, Ramboll Group, Sika AG, SunPower Corporation, Tesla Inc., Lendlease Group, First Solar Inc. |
| Customization Scope | Customization for segments, region/country-level will be provided. Moreover, additional customization can be done based on the requirements. |
| Pricing and Purchase Options | Avail customized purchase options to meet your exact research needs. We have three licenses to opt for: Single User License, Multi-User License (Up to 5 Users), Corporate Use License (Unlimited User and Printable PDF). |
, Technology (Renewable Energy Systems, Energy Storage Systems, Energy Efficiency Technologies, Building Energy Management Systems), Region and Key Players - Industry Segment Overview, Market Dynamics, Competitive Strategies, Trends and Forecast 2025-2034")
, Technology (Renewable Energy Systems, Energy Storage Systems, Energy Efficiency Technologies, Building Energy Management Systems), Region and Key Players - Industry Segment Overview, Market Dynamics, Competitive Strategies, Trends and Forecast 2025-2034")
, Technology (Renewable Energy Systems, Energy Storage Systems, Energy Efficiency Technologies, Building Energy Management Systems), Region and Key Players - Industry Segment Overview, Market Dynamics, Competitive Strategies, Trends and Forecast 2025-2034")
Frequently Asked Questions
How big is the Zero-Energy Buildings Market?
The Zero-Energy Buildings Market is projected to reach USD 252.3 Bn by 2034 at 5.1% CAGR. Explore trends in sustainable construction, smart building tech, and renewable integration.
Who are the major players in the Zero-Energy Buildings Market?
Siemens AG, Schneider Electric, Johnson Controls International plc, Honeywell International Inc., Trane Technologies plc, General Electric Company (GE), Itron Inc., NREL (National Renewable Energy Lab), WSP Global Inc., Fujitsu Ltd., Mitsubishi Electric Corporation, Kingspan Group, Veolia Environnement S.A., Arcadia Power, Ramboll Group, Sika AG, SunPower Corporation, Tesla Inc., Lendlease Group, First Solar Inc.
Which segments covered the Zero-Energy Buildings Market?
By Building Type (Residential Buildings, Commercial Buildings, Institutional Buildings, Industrial Buildings), By Construction Material (High-Performance Insulation Materials, Energy-Efficient Windows & Doors, Solar Panels & Photovoltaic Systems, HVAC & Energy Management Systems), By Technology (Solar Photovoltaic Systems, Building-Integrated Renewable Energy, Energy Storage Solutions, Smart Energy Management Systems), By End-User (Government & Public Sector, Real Estate Developers, Commercial Enterprises, Residential Consumers)
How can this market research report help my business make strategic decisions?
Our market research reports provide actionable intelligence, including verified market size data, CAGR projections, competitive benchmarking, and segment-level opportunity analysis. These insights support strategic planning, investment decisions, product development, and market entry strategies for enterprises and startups alike.
How frequently is the data updated?
We continuously monitor industry developments and update our reports to reflect regulatory changes, technological advancements, and macroeconomic shifts. Updated editions ensure you receive the latest market intelligence.

Select Licence Type
Connect with our sales team
Zero-Energy Buildings Market
Published Date : 18 Dec 2024 | Formats :Why IntelEvoResearch
100%
Customer
Satisfaction
24x7+
Availability - we are always
there when you need us
200+
Fortune 50 Companies trust
IntelEvoResearch
80%
of our reports are exclusive
and first in the industry
100%
more data
and analysis
1000+
reports published
till date
