Global Zero-Waste Packaging Solutions Market Size, Share, Analysis Report By Material(Biopolymer, Paper and Cardboard, Glass Packaging, Metal Packaging), Type(Reusable/Recyclable Packaging, Compostable Packaging, Edible Packaging), Distribution Channel(Online, Offline), Application(Food & Beverages, Healthcare, Cosmetics & Personal Care, Electrical & Electronics, E-commerce, Others), Region and Key Players - Industry Segment Overview, Market Dynamics, Competitive Strategies, Trends and Forecast 2025-2034
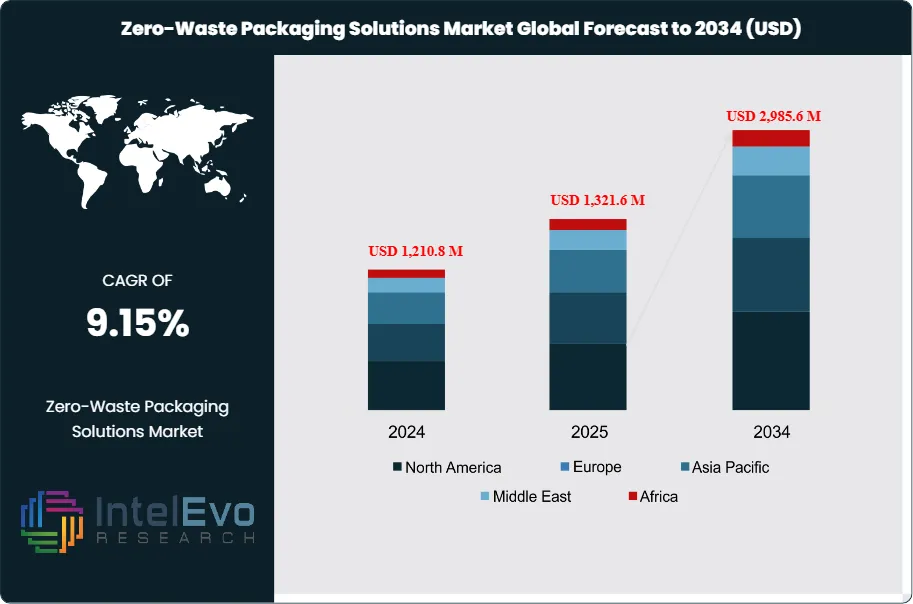
The Zero-Waste Packaging Solutions Market size is expected to be worth around USD 2,985.6 Million by 2034, up from USD 1,210.8 Million in 2024, growing at a CAGR of 9.15% during the forecast period from 2025 to 2034. This growth is fueled by increasing consumer awareness, stricter government regulations on plastic usage, and the rapid adoption of sustainable materials in food, retail, and e-commerce sectors. With major brands shifting toward eco-friendly alternatives, zero-waste packaging is emerging as a global megatrend, reshaping the future of packaging and sustainable supply chains.
Zero-waste packaging refers to products created in such a manner that they are either recyclable and reusable or biodegradable, thereby not causing much waste and less damage to the environment. From all the drivers that have already impacted this market, it would appear the dynamics of this market have been changed by increasing awareness on environmental matters, regulatory pressure, and growing demand from customers for sustainable solutions. As a call from customers for reduction of carbon footprint, zero-waste packaging has become part of company strategies that drive a new wave in material and design innovation. Businesses are at present adopting these modern materials and designs, thereby hastening the increase of environmentally friendly packaging solutions in development.
Growth dynamics in the market for zero-waste packaging solutions are primarily driven by factors like increasing environmental concerns, government regulation and compulsions, consumer preference for sustainable products, etc. All these compelling reasons force businesses to invest more in eco-friendly packaging alternatives, not only for compliance with regulation but also enhancing brand reputation. Technological development in research and development can ensure better and more technologically advanced packaging solutions, such as biodegradable materials and reusable designs. Further, the tie-ups from packaging manufacturers to businesses operating in different industries promote zero-waste activities.
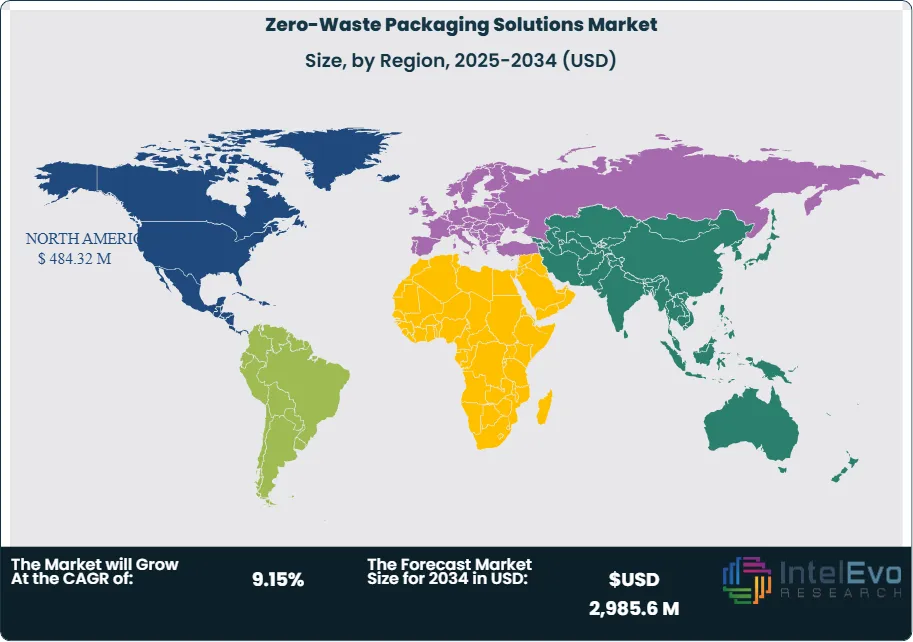
North America and Europe are considered to have the highest growth market for zero-waste packaging solutions mainly due to high regulatory pressures and greater sensitivities of consumers towards sustainability. Urbanization along with a shift of consumer preferences and the government policies of the region supporting green practices in the Asia Pacific region are the fastest-growing in the zero-waste packaging solutions market. Countries such as China and India are focusing on reducing plastic waste, which has further tremendous demand for zero-waste packaging solutions. Latin America and the Middle East and Africa are other growing markets due to rising environmental consciousness.
COVID 19 has had a mixed effect on the market size of zero-waste packaging solutions. Initially, demand was reduced by disruptions in supply chains and a shift to one-time-only packaging due to hygiene concerns. Interest in sustainable packaging options, however, increased as people and business shifts during the pandemic emphasized the importance of an environment. The influence of the pandemic quickened the shift to digital solutions, while packaging is zero waste and brings further innovation. Overall, the market is anticipated to take care of itself post the COVID-19 pandemic, fueled by a growing spotlight on sustainability.
Key Takeaways:
Market Growth: The zero-waste packaging solutions market is expected to reach USD 2,985.6 million by 2034, growing at a robust CAGR of 9.15%, indicating strong market expansion.
Material Segment Dominance: The material segment is dominated by biodegradable plastics, accounting for over 40% of the market share. This preference stems from the increasing demand for sustainable alternatives to traditional plastics in packaging applications.
Type Segment Insights: Flexible packaging is anticipated to hold the largest market share, favored for its lightweight and space-saving properties. The growing e-commerce sector further propels the demand for flexible, sustainable packaging solutions.
Driver: This is how the need for zero-waste packaging solutions benefits from improved environmental awareness and support at a regulatory level. Consumers and business establishments have shown interest in reducing plastic waste and thus becoming sustainable.
Restraint: The cost of producing new materials and technologies is somewhat expensive, which limits the entry to the market for small manufacturers. Consumer awareness and acceptance are some of the challenges that require attention for broader usage.
Opportunity: The rise of e-commerce and the push for sustainable packaging present significant growth opportunities. Collaborations between brands and sustainable packaging providers can lead to innovative solutions that meet market demands.
Trend: The increasing focus on circular economy practices is shaping the market, with brands investing in packaging designed for reuse and recyclability, enhancing sustainability efforts.
Regional Analysis: North America leads the market share due to strong sustainability initiatives, while the Asia-Pacific region is emerging rapidly, driven by increasing industrialization and consumer demand for eco-friendly packaging solutions.
Material Analysis:
Zero-waste packaging solutions market can be categorized by material. These include biodegradable plastics, glass, metal, paper, and plant-based. Biodegradable plastics are highly in demand because they break down naturally; thus, they can be employed for almost all purposes. Paper-based packaging, particularly kraft paper and recycled paper, is in high demand due to recyclability and sustainability. Glass and metals are always favored for their reusability and a high lifecycle. Plant-based materials are now gaining increasing importance, being derived from renewable sources, as consumers push for environmentally friendly alternatives. This segment would also experience robust growth with sustained innovation in the materials.
Type Analysis:
There are three categories for zero-waste packaging: reusable, recyclable, and compostable. Reusable packaging is gaining mainstream popularity as consumers become increasingly ecologically aware, especially of containers and bags, which are the most common examples of such packaging. Recyclable packaging remains a strong tool for brand companies looking to reduce their waste impact-to be sorted and post-consumer recycled. Compostable is organic packaging that can break down naturally in composting environments. These types are in high demand as more and more people nowadays have become aware of sustainability and corporate responsibility forcing companies to go for zero-wasting strategies in the packaging practice.
Distribution Channel Analysis:
Distribution channels in the case of the market segmentation of the zero-waste packaging solutions include online and offline. Online sales is gaining much traction because of e-commerce platforms as well as these consumers are not oblivious towards increasingly present sustainability products. Companies are using digital marketing channels to communicate their eco-friendly packaging solutions to the consumer directly. The off-line channels, including supermarkets and specialty stores, as well as direct sales, are still important to reach a larger number of consumers. A two-pronged approach helps brands to reach different kinds of consumers who have different preferences, thus further access markets and increase sales across all segments.
Application Insights:
Segments in this application include food and beverage, personal care, healthcare, and consumer goods. Zero-waste packaging solutions for the food and beverage segment are useful in limiting food waste and, hence, contributes to sustainability. Personal care brands have begun to embrace eco-friendly packs since they appear to resonate with the concerns of the green-minded consumer and contribute to a higher brand loyalty. Healthcare is also embracing sustainable packaging, especially for their medical products. Consumer goods companies are targeting zero-waste packaging because of growing demand for sustainable products. This segment emphasizes application areas and market growth.
Region Analysis:
North America Leads With 40% Market Share in the Zero-Waste Packaging Solutions Market: North America and Asia-Pacific are the regions with the highest market shares for zero-waste packaging solutions, driven by stringent environmental regulations and increasing consumer demand for sustainable products. North America holds approximately 40% of the market share, supported by a strong focus on eco-friendly practices among businesses and consumers alike. The presence of major players investing in innovative materials, such as biodegradable plastics and recycled paper, further enhances growth in this region. The Asia-Pacific region is projected to witness significant growth, with expectations to reach a 25% market share by 2034, fueled by rapid urbanization and changing consumer preferences.
The European market also holds a substantial share, characterized by advanced sustainability initiatives and a robust regulatory framework promoting eco-friendly packaging. Countries like Germany, France, and the UK are key players, actively investing in zero-waste solutions across various industries, including food and beverages and personal care. Additionally, Latin America and the Middle East and Africa represent emerging markets with substantial growth potential. In Latin America, increasing environmental awareness and regulatory support are driving the adoption of zero-waste packaging, while the Middle East and Africa are gradually recognizing the importance of sustainability, presenting new opportunities for market expansion in the coming years.
By Material (Biodegradable Plastics, Recycled Paper & Cardboard, Glass, Metal (Aluminum, Steel), Plant-based Packaging (Cornstarch, Bagasse, Mushroom Packaging), Others), By Packaging Type (Reusable Packaging, Compostable Packaging, Recyclable Packaging, Edible Packaging, Minimalist & Bulk Packaging), By Application (Food & Beverages, Personal Care & Cosmetics, Healthcare & Pharmaceuticals, E-commerce & Retail, Industrial Packaging, Electrical & Electronics, Others), By Distribution Channel (Online Platforms, Retail & Supermarkets, Specialty Stores, B2B Industrial Distribution), By End User (Consumers, Retailers, Manufacturers, Logistics & E-commerce)
Research Methodology
Primary Research- 100 Interviews of Stakeholders
Secondary Research
Desk Research
Regional scope
North America (United States, Canada, Mexico)
Latin America (Brazil, Argentina, Columbia)
East Asia And Pacific (China, Japan, South Korea, Australia, Cambodia, Fiji, Indonesia)
Sea And South Asia (India, Singapore, Thailand, Taiwan, Malaysia)
Eastern Europe (Poland, Russia, Czech Republic, Romania)
Western Europe (Germany, U.K., France, Spain, Itlay)
Middle East & Africa (GCC Countries, Egypt, Nigeria, South Africa, Israel)
Competitive Landscape
Ecovative LLC, DS Smith plc, Avani Eco, Biome Bioplastics Limited, BIOPLA, Loliware Inc., Evoware, Sulapac Oy, TIPA, World Centric, Notpla Limited, Regeno, Hero Packaging
Customization Scope
Customization for segments, region/country-level will be provided. Moreover, additional customization can be done based on the requirements.
Pricing and Purchase Options
Avail customized purchase options to meet your exact research needs. We have three licenses to opt for: Single User License, Multi-User License (Up to 5 Users), Corporate Use License (Unlimited User and Printable PDF).
TABLE OF CONTENTS
1. EXECUTIVE SUMMARY
1.1. MARKET SNAPSHOT
1.2. KEY FINDINGS & INSIGHTS
1.3. ANALYST RECOMMENDATIONS
1.4. FUTURE OUTLOOK
2. RESEARCH METHODOLOGY
2.1. MARKET DEFINITION & SCOPE
2.2. RESEARCH OBJECTIVES: PRIMARY & SECONDARY DATA SOURCES
2.3. DATA COLLECTION SOURCES
2.3.1. COVERAGE OF 100+ PRIMARY RESEARCH/CONSULTATION CALLS WITH INDUSTRY STAKEHOLDERS
FIGURE 17 NORTH AMERICA ZERO-WASTE PACKAGING SOLUTIONS CURRENT AND FUTURE TYPE ANALYSIS, 2025–2034, (USD MILLION)
FIGURE 18 NORTH AMERICA ZERO-WASTE PACKAGING SOLUTIONS CURRENT AND FUTURE END USER ANALYSIS, 2025–2034, (USD MILLION)
FIGURE 19 MARKET SHARE BY COUNTRY
FIGURE 20 LATIN AMERICA ZERO-WASTE PACKAGING SOLUTIONS CURRENT AND FUTURE TYPE ANALYSIS, 2025–2034, (USD MILLION)
FIGURE 21 LATIN AMERICA ZERO-WASTE PACKAGING SOLUTIONS CURRENT AND FUTURE END USER ANALYSIS, 2025–2034, (USD MILLION)
FIGURE 22 MARKET SHARE BY COUNTRY
FIGURE 23 EASTERN EUROPE ZERO-WASTE PACKAGING SOLUTIONS CURRENT AND FUTURE TYPE ANALYSIS, 2025–2034, (USD MILLION)
FIGURE 24 EASTERN EUROPE ZERO-WASTE PACKAGING SOLUTIONS CURRENT AND FUTURE END USER ANALYSIS, 2025–2034, (USD MILLION)
FIGURE 25 MARKET SHARE BY COUNTRY
FIGURE 26 WESTERN EUROPE ZERO-WASTE PACKAGING SOLUTIONS CURRENT AND FUTURE TYPE ANALYSIS, 2025–2034, (USD MILLION)
FIGURE 27 WESTERN EUROPE ZERO-WASTE PACKAGING SOLUTIONS CURRENT AND FUTURE END USER ANALYSIS, 2025–2034, (USD MILLION)
FIGURE 28 MARKET SHARE BY COUNTRY
FIGURE 29 EAST ASIA AND PACIFIC ZERO-WASTE PACKAGING SOLUTIONS CURRENT AND FUTURE TYPE ANALYSIS, 2025–2034, (USD MILLION)
FIGURE 30 EAST ASIA AND PACIFIC ZERO-WASTE PACKAGING SOLUTIONS CURRENT AND FUTURE END USER ANALYSIS, 2025–2034, (USD MILLION)
FIGURE 31 MARKET SHARE BY COUNTRY
FIGURE 32 SEA AND SOUTH ASIA ZERO-WASTE PACKAGING SOLUTIONS CURRENT AND FUTURE TYPE ANALYSIS, 2025–2034, (USD MILLION)
FIGURE 33 SEA AND SOUTH ASIA ZERO-WASTE PACKAGING SOLUTIONS CURRENT AND FUTURE END USER ANALYSIS, 2025–2034, (USD MILLION)
FIGURE 34 MARKET SHARE BY COUNTRY
FIGURE 35 MIDDLE EAST AND AFRICA ZERO-WASTE PACKAGING SOLUTIONS CURRENT AND FUTURE TYPE ANALYSIS, 2025–2034, (USD MILLION)
FIGURE 36 MIDDLE EAST AND AFRICA ZERO-WASTE PACKAGING SOLUTIONS CURRENT AND FUTURE END USER ANALYSIS, 2025–2034, (USD MILLION)
FIGURE 37 NORTH AMERICA ZERO-WASTE PACKAGING SOLUTIONS CURRENT AND FUTURE MARKET VOLUME SHARE REGIONAL ANALYSIS, 2025–2034, (USD MILLION)
FIGURE 38 U.S. ZERO-WASTE PACKAGING SOLUTIONS CURRENT AND FUTURE TYPE ANALYSIS, 2025–2034, (USD MILLION)
FIGURE 39 U.S. ZERO-WASTE PACKAGING SOLUTIONS CURRENT AND FUTURE END USER ANALYSIS, 2025–2034, (USD MILLION)
FIGURE 40 CANADA ZERO-WASTE PACKAGING SOLUTIONS CURRENT AND FUTURE TYPE ANALYSIS, 2025–2034, (USD MILLION)
FIGURE 41 CANADA ZERO-WASTE PACKAGING SOLUTIONS CURRENT AND FUTURE END USER ANALYSIS, 2025–2034, (USD MILLION)
FIGURE 42 LATIN AMERICA ZERO-WASTE PACKAGING SOLUTIONS CURRENT AND FUTURE MARKET VOLUME SHARE REGIONAL ANALYSIS, 2025–2034, (USD MILLION)
FIGURE 43 MEXICO ZERO-WASTE PACKAGING SOLUTIONS CURRENT AND FUTURE TYPE ANALYSIS, 2025–2034, (USD MILLION)
FIGURE 44 MEXICO ZERO-WASTE PACKAGING SOLUTIONS CURRENT AND FUTURE END USER ANALYSIS, 2025–2034, (USD MILLION)
FIGURE 45 BRAZIL ZERO-WASTE PACKAGING SOLUTIONS CURRENT AND FUTURE TYPE ANALYSIS, 2025–2034, (USD MILLION)
FIGURE 46 BRAZIL ZERO-WASTE PACKAGING SOLUTIONS CURRENT AND FUTURE END USER ANALYSIS, 2025–2034, (USD MILLION)
FIGURE 47 ARGENTINA ZERO-WASTE PACKAGING SOLUTIONS CURRENT AND FUTURE TYPE ANALYSIS, 2025–2034, (USD MILLION)
FIGURE 48 ARGENTINA ZERO-WASTE PACKAGING SOLUTIONS CURRENT AND FUTURE END USER ANALYSIS, 2025–2034, (USD MILLION)
FIGURE 49 COLUMBIA ZERO-WASTE PACKAGING SOLUTIONS CURRENT AND FUTURE TYPE ANALYSIS, 2025–2034, (USD MILLION)
FIGURE 50 COLUMBIA ZERO-WASTE PACKAGING SOLUTIONS CURRENT AND FUTURE END USER ANALYSIS, 2025–2034, (USD MILLION)
FIGURE 51 REST OF LATIN AMERICA ZERO-WASTE PACKAGING SOLUTIONS CURRENT AND FUTURE TYPE ANALYSIS, 2025–2034, (USD MILLION)
FIGURE 52 REST OF LATIN AMERICA ZERO-WASTE PACKAGING SOLUTIONS CURRENT AND FUTURE END USER ANALYSIS, 2025–2034, (USD MILLION)
FIGURE 53 EASTERN EUROPE ZERO-WASTE PACKAGING SOLUTIONS CURRENT AND FUTURE MARKET VOLUME SHARE REGIONAL ANALYSIS, 2025–2034, (USD MILLION)
FIGURE 54 POLAND ZERO-WASTE PACKAGING SOLUTIONS CURRENT AND FUTURE TYPE ANALYSIS, 2025–2034, (USD MILLION)
FIGURE 55 POLAND ZERO-WASTE PACKAGING SOLUTIONS CURRENT AND FUTURE END USER ANALYSIS, 2025–2034, (USD MILLION)
FIGURE 56 RUSSIA ZERO-WASTE PACKAGING SOLUTIONS CURRENT AND FUTURE TYPE ANALYSIS, 2025–2034, (USD MILLION)
FIGURE 57 RUSSIA ZERO-WASTE PACKAGING SOLUTIONS CURRENT AND FUTURE END USER ANALYSIS, 2025–2034, (USD MILLION)
FIGURE 58 CZECH REPUBLIC ZERO-WASTE PACKAGING SOLUTIONS CURRENT AND FUTURE TYPE ANALYSIS, 2025–2034, (USD MILLION)
FIGURE 59 CZECH REPUBLIC ZERO-WASTE PACKAGING SOLUTIONS CURRENT AND FUTURE END USER ANALYSIS, 2025–2034, (USD MILLION)
FIGURE 60 ROMANIA ZERO-WASTE PACKAGING SOLUTIONS CURRENT AND FUTURE TYPE ANALYSIS, 2025–2034, (USD MILLION)
FIGURE 61 ROMANIA ZERO-WASTE PACKAGING SOLUTIONS CURRENT AND FUTURE END USER ANALYSIS, 2025–2034, (USD MILLION)
FIGURE 62 REST OF EASTERN EUROPE ZERO-WASTE PACKAGING SOLUTIONS CURRENT AND FUTURE TYPE ANALYSIS, 2025–2034, (USD MILLION)
FIGURE 63 REST OF EASTERN EUROPE ZERO-WASTE PACKAGING SOLUTIONS CURRENT AND FUTURE END USER ANALYSIS, 2025–2034, (USD MILLION)
FIGURE 64 WESTERN EUROPE ZERO-WASTE PACKAGING SOLUTIONS CURRENT AND FUTURE MARKET VOLUME SHARE REGIONAL ANALYSIS, 2025–2034, (USD MILLION)
FIGURE 65 GERMANY ZERO-WASTE PACKAGING SOLUTIONS CURRENT AND FUTURE TYPE ANALYSIS, 2025–2034, (USD MILLION)
FIGURE 66 GERMANY ZERO-WASTE PACKAGING SOLUTIONS CURRENT AND FUTURE END USER ANALYSIS, 2025–2034, (USD MILLION)
FIGURE 67 FRANCE ZERO-WASTE PACKAGING SOLUTIONS CURRENT AND FUTURE TYPE ANALYSIS, 2025–2034, (USD MILLION)
FIGURE 68 FRANCE ZERO-WASTE PACKAGING SOLUTIONS CURRENT AND FUTURE END USER ANALYSIS, 2025–2034, (USD MILLION)
FIGURE 69 UK ZERO-WASTE PACKAGING SOLUTIONS CURRENT AND FUTURE TYPE ANALYSIS, 2025–2034, (USD MILLION)
FIGURE 70 UK ZERO-WASTE PACKAGING SOLUTIONS CURRENT AND FUTURE END USER ANALYSIS, 2025–2034, (USD MILLION)
FIGURE 71 SPAIN ZERO-WASTE PACKAGING SOLUTIONS CURRENT AND FUTURE TYPE ANALYSIS, 2025–2034, (USD MILLION)
FIGURE 72 SPAIN ZERO-WASTE PACKAGING SOLUTIONS CURRENT AND FUTURE END USER ANALYSIS, 2025–2034, (USD MILLION)
FIGURE 73 ITALY ZERO-WASTE PACKAGING SOLUTIONS CURRENT AND FUTURE TYPE ANALYSIS, 2025–2034, (USD MILLION)
FIGURE 74 ITALY ZERO-WASTE PACKAGING SOLUTIONS CURRENT AND FUTURE END USER ANALYSIS, 2025–2034, (USD MILLION)
FIGURE 75 REST OF WESTERN EUROPE ZERO-WASTE PACKAGING SOLUTIONS CURRENT AND FUTURE TYPE ANALYSIS, 2025–2034, (USD MILLION)
FIGURE 76 REST OF WESTERN EUROPE ZERO-WASTE PACKAGING SOLUTIONS CURRENT AND FUTURE END USER ANALYSIS, 2025–2034, (USD MILLION)
FIGURE 77 EAST ASIA AND PACIFIC ZERO-WASTE PACKAGING SOLUTIONS CURRENT AND FUTURE MARKET VOLUME SHARE REGIONAL ANALYSIS, 2025–2034, (USD MILLION)
FIGURE 78 CHINA ZERO-WASTE PACKAGING SOLUTIONS CURRENT AND FUTURE TYPE ANALYSIS, 2025–2034, (USD MILLION)
FIGURE 79 CHINA ZERO-WASTE PACKAGING SOLUTIONS CURRENT AND FUTURE END USER ANALYSIS, 2025–2034, (USD MILLION)
FIGURE 80 JAPAN ZERO-WASTE PACKAGING SOLUTIONS CURRENT AND FUTURE TYPE ANALYSIS, 2025–2034, (USD MILLION)
FIGURE 81 JAPAN ZERO-WASTE PACKAGING SOLUTIONS CURRENT AND FUTURE END USER ANALYSIS, 2025–2034, (USD MILLION)
FIGURE 82 AUSTRALIA ZERO-WASTE PACKAGING SOLUTIONS CURRENT AND FUTURE TYPE ANALYSIS, 2025–2034, (USD MILLION)
FIGURE 83 AUSTRALIA ZERO-WASTE PACKAGING SOLUTIONS CURRENT AND FUTURE END USER ANALYSIS, 2025–2034, (USD MILLION)
FIGURE 84 CAMBODIA ZERO-WASTE PACKAGING SOLUTIONS CURRENT AND FUTURE TYPE ANALYSIS, 2025–2034, (USD MILLION)
FIGURE 85 CAMBODIA ZERO-WASTE PACKAGING SOLUTIONS CURRENT AND FUTURE END USER ANALYSIS, 2025–2034, (USD MILLION)
FIGURE 86 FIJI ZERO-WASTE PACKAGING SOLUTIONS CURRENT AND FUTURE TYPE ANALYSIS, 2025–2034, (USD MILLION)
FIGURE 87 FIJI ZERO-WASTE PACKAGING SOLUTIONS CURRENT AND FUTURE END USER ANALYSIS, 2025–2034, (USD MILLION)
FIGURE 88 INDONESIA ZERO-WASTE PACKAGING SOLUTIONS CURRENT AND FUTURE TYPE ANALYSIS, 2025–2034, (USD MILLION)
FIGURE 89 INDONESIA ZERO-WASTE PACKAGING SOLUTIONS CURRENT AND FUTURE END USER ANALYSIS, 2025–2034, (USD MILLION)
FIGURE 90 SOUTH KOREA ZERO-WASTE PACKAGING SOLUTIONS CURRENT AND FUTURE TYPE ANALYSIS, 2025–2034, (USD MILLION)
FIGURE 91 SOUTH KOREA ZERO-WASTE PACKAGING SOLUTIONS CURRENT AND FUTURE END USER ANALYSIS, 2025–2034, (USD MILLION)
FIGURE 92 REST OF EAST ASIA AND PACIFIC ZERO-WASTE PACKAGING SOLUTIONS CURRENT AND FUTURE TYPE ANALYSIS, 2025–2034, (USD MILLION)
FIGURE 93 REST OF EAST ASIA AND PACIFIC ZERO-WASTE PACKAGING SOLUTIONS CURRENT AND FUTURE END USER ANALYSIS, 2025–2034, (USD MILLION)
FIGURE 94 SEA AND SOUTH ASIA ZERO-WASTE PACKAGING SOLUTIONS CURRENT AND FUTURE MARKET VOLUME SHARE REGIONAL ANALYSIS, 2025–2034, (USD MILLION)
FIGURE 95 BANGLADESH ZERO-WASTE PACKAGING SOLUTIONS CURRENT AND FUTURE TYPE ANALYSIS, 2025–2034, (USD MILLION)
FIGURE 96 BANGLADESH ZERO-WASTE PACKAGING SOLUTIONS CURRENT AND FUTURE END USER ANALYSIS, 2025–2034, (USD MILLION)
FIGURE 97 NEW ZEALAND ZERO-WASTE PACKAGING SOLUTIONS CURRENT AND FUTURE TYPE ANALYSIS, 2025–2034, (USD MILLION)
FIGURE 98 NEW ZEALAND ZERO-WASTE PACKAGING SOLUTIONS CURRENT AND FUTURE END USER ANALYSIS, 2025–2034, (USD MILLION)
FIGURE 99 INDIA ZERO-WASTE PACKAGING SOLUTIONS CURRENT AND FUTURE TYPE ANALYSIS, 2025–2034, (USD MILLION)
FIGURE 100 INDIA ZERO-WASTE PACKAGING SOLUTIONS CURRENT AND FUTURE END USER ANALYSIS, 2025–2034, (USD MILLION)
FIGURE 101 SINGAPORE ZERO-WASTE PACKAGING SOLUTIONS CURRENT AND FUTURE TYPE ANALYSIS, 2025–2034, (USD MILLION)
FIGURE 102 SINGAPORE ZERO-WASTE PACKAGING SOLUTIONS CURRENT AND FUTURE END USER ANALYSIS, 2025–2034, (USD MILLION)
FIGURE 103 THAILAND ZERO-WASTE PACKAGING SOLUTIONS CURRENT AND FUTURE TYPE ANALYSIS, 2025–2034, (USD MILLION)
FIGURE 104 THAILAND ZERO-WASTE PACKAGING SOLUTIONS CURRENT AND FUTURE END USER ANALYSIS, 2025–2034, (USD MILLION)
FIGURE 105 TAIWAN ZERO-WASTE PACKAGING SOLUTIONS CURRENT AND FUTURE TYPE ANALYSIS, 2025–2034, (USD MILLION)
FIGURE 106 TAIWAN ZERO-WASTE PACKAGING SOLUTIONS CURRENT AND FUTURE END USER ANALYSIS, 2025–2034, (USD MILLION)
FIGURE 107 MALAYSIA ZERO-WASTE PACKAGING SOLUTIONS CURRENT AND FUTURE TYPE ANALYSIS, 2025–2034, (USD MILLION)
FIGURE 108 MALAYSIA ZERO-WASTE PACKAGING SOLUTIONS CURRENT AND FUTURE END USER ANALYSIS, 2025–2034, (USD MILLION)
FIGURE 109 REST OF SEA AND SOUTH ASIA ZERO-WASTE PACKAGING SOLUTIONS CURRENT AND FUTURE TYPE ANALYSIS, 2025–2034, (USD MILLION)
FIGURE 110 REST OF SEA AND SOUTH ASIA ZERO-WASTE PACKAGING SOLUTIONS CURRENT AND FUTURE END USER ANALYSIS, 2025–2034, (USD MILLION)
FIGURE 111 MIDDLE EAST AND AFRICA ZERO-WASTE PACKAGING SOLUTIONS CURRENT AND FUTURE MARKET VOLUME SHARE REGIONAL ANALYSIS, 2025–2034, (USD MILLION)
FIGURE 112 GCC COUNTRIES ZERO-WASTE PACKAGING SOLUTIONS CURRENT AND FUTURE TYPE ANALYSIS, 2025–2034, (USD MILLION)
FIGURE 113 GCC COUNTRIES ZERO-WASTE PACKAGING SOLUTIONS CURRENT AND FUTURE END USER ANALYSIS, 2025–2034, (USD MILLION)
FIGURE 114 SAUDI ARABIA ZERO-WASTE PACKAGING SOLUTIONS CURRENT AND FUTURE TYPE ANALYSIS, 2025–2034, (USD MILLION)
FIGURE 115 SAUDI ARABIA ZERO-WASTE PACKAGING SOLUTIONS CURRENT AND FUTURE END USER ANALYSIS, 2025–2034, (USD MILLION)
FIGURE 116 UAE ZERO-WASTE PACKAGING SOLUTIONS CURRENT AND FUTURE TYPE ANALYSIS, 2025–2034, (USD MILLION)
FIGURE 117 UAE ZERO-WASTE PACKAGING SOLUTIONS CURRENT AND FUTURE END USER ANALYSIS, 2025–2034, (USD MILLION)
FIGURE 118 BAHRAIN ZERO-WASTE PACKAGING SOLUTIONS CURRENT AND FUTURE TYPE ANALYSIS, 2025–2034, (USD MILLION)
FIGURE 119 BAHRAIN ZERO-WASTE PACKAGING SOLUTIONS CURRENT AND FUTURE END USER ANALYSIS, 2025–2034, (USD MILLION)
FIGURE 120 KUWAIT ZERO-WASTE PACKAGING SOLUTIONS CURRENT AND FUTURE TYPE ANALYSIS, 2025–2034, (USD MILLION)
FIGURE 121 KUWAIT ZERO-WASTE PACKAGING SOLUTIONS CURRENT AND FUTURE END USER ANALYSIS, 2025–2034, (USD MILLION)
FIGURE 122 OMAN ZERO-WASTE PACKAGING SOLUTIONS CURRENT AND FUTURE TYPE ANALYSIS, 2025–2034, (USD MILLION)
FIGURE 123 OMAN ZERO-WASTE PACKAGING SOLUTIONS CURRENT AND FUTURE END USER ANALYSIS, 2025–2034, (USD MILLION)
FIGURE 124 QATAR ZERO-WASTE PACKAGING SOLUTIONS CURRENT AND FUTURE TYPE ANALYSIS, 2025–2034, (USD MILLION)
FIGURE 125 QATAR ZERO-WASTE PACKAGING SOLUTIONS CURRENT AND FUTURE END USER ANALYSIS, 2025–2034, (USD MILLION)
FIGURE 126 EGYPT ZERO-WASTE PACKAGING SOLUTIONS CURRENT AND FUTURE TYPE ANALYSIS, 2025–2034, (USD MILLION)
FIGURE 127 EGYPT ZERO-WASTE PACKAGING SOLUTIONS CURRENT AND FUTURE END USER ANALYSIS, 2025–2034, (USD MILLION)
FIGURE 128 NIGERIA ZERO-WASTE PACKAGING SOLUTIONS CURRENT AND FUTURE TYPE ANALYSIS, 2025–2034, (USD MILLION)
FIGURE 129 NIGERIA ZERO-WASTE PACKAGING SOLUTIONS CURRENT AND FUTURE END USER ANALYSIS, 2025–2034, (USD MILLION)
FIGURE 130 SOUTH AFRICA ZERO-WASTE PACKAGING SOLUTIONS CURRENT AND FUTURE TYPE ANALYSIS, 2025–2034, (USD MILLION)
FIGURE 131 SOUTH AFRICA ZERO-WASTE PACKAGING SOLUTIONS CURRENT AND FUTURE END USER ANALYSIS, 2025–2034, (USD MILLION)
FIGURE 132 ISRAEL ZERO-WASTE PACKAGING SOLUTIONS CURRENT AND FUTURE TYPE ANALYSIS, 2025–2034, (USD MILLION)
FIGURE 133 ISRAEL ZERO-WASTE PACKAGING SOLUTIONS CURRENT AND FUTURE END USER ANALYSIS, 2025–2034, (USD MILLION)
FIGURE 134 REST OF MEA ZERO-WASTE PACKAGING SOLUTIONS CURRENT AND FUTURE TYPE ANALYSIS, 2025–2034, (USD MILLION)
FIGURE 135 REST OF MEA ZERO-WASTE PACKAGING SOLUTIONS CURRENT AND FUTURE END USER ANALYSIS, 2025–2034, (USD MILLION)
FIGURE 136 U. S. MARKET SHARE ANALYSIS BY TYPE (2024)
FIGURE 137 U. S. MARKET SHARE ANALYSIS BY END USER (2024)
FIGURE 138 CANADA MARKET SHARE ANALYSIS BY TYPE (2024)
FIGURE 139 CANADA MARKET SHARE ANALYSIS BY END USER (2024)
FIGURE 140 MEXICO MARKET SHARE ANALYSIS BY TYPE (2024)
FIGURE 141 MEXICO MARKET SHARE ANALYSIS BY END USER (2024)
FIGURE 142 CHINA MARKET SHARE ANALYSIS BY TYPE (2024)
FIGURE 143 CHINA MARKET SHARE ANALYSIS BY END USER (2024)
FIGURE 144 JAPAN MARKET SHARE ANALYSIS BY TYPE (2024)
FIGURE 145 JAPAN MARKET SHARE ANALYSIS BY END USER (2024)
FIGURE 146 INDIA MARKET SHARE ANALYSIS BY TYPE (2024)
FIGURE 147 INDIA MARKET SHARE ANALYSIS BY END USER (2024)
FIGURE 148 SOUTH KOREA MARKET SHARE ANALYSIS BY TYPE (2024)
FIGURE 149 SOUTH KOREA MARKET SHARE ANALYSIS BY END USER (2024)
FIGURE 150 SAUDI ARABIA MARKET SHARE ANALYSIS BY TYPE (2024)
FIGURE 151 SAUDI ARABIA MARKET SHARE ANALYSIS BY END USER (2024)
FIGURE 152 UAE MARKET SHARE ANALYSIS BY TYPE (2024)
FIGURE 153 UAE MARKET SHARE ANALYSIS BY END USER (2024)
FIGURE 154 EGYPT MARKET SHARE ANALYSIS BY TYPE (2024)
FIGURE 155 EGYPT MARKET SHARE ANALYSIS BY END USER (2024)
FIGURE 156 NIGERIA MARKET SHARE ANALYSIS BY TYPE (2024)
FIGURE 157 NIGERIA MARKET SHARE ANALYSIS BY END USER (2024)
FIGURE 158 SOUTH AFRICA MARKET SHARE ANALYSIS BY TYPE (2024)
FIGURE 159 SOUTH AFRICA MARKET SHARE ANALYSIS BY END USER (2024)
FIGURE 160 GERMANY MARKET SHARE ANALYSIS BY TYPE (2024)
FIGURE 161 GERMANY MARKET SHARE ANALYSIS BY END USER (2024)
FIGURE 162 FRANCE MARKET SHARE ANALYSIS BY TYPE (2024)
FIGURE 163 FRANCE MARKET SHARE ANALYSIS BY END USER (2024)
FIGURE 164 UK MARKET SHARE ANALYSIS BY TYPE (2024)
FIGURE 165 UK MARKET SHARE ANALYSIS BY END USER (2024)
FIGURE 166 SPAIN MARKET SHARE ANALYSIS BY TYPE (2024)
FIGURE 167 SPAIN MARKET SHARE ANALYSIS BY END USER (2024)
FIGURE 168 ITALY MARKET SHARE ANALYSIS BY TYPE (2024)
FIGURE 169 ITALY MARKET SHARE ANALYSIS BY END USER (2024)
FIGURE 170 BRAZIL MARKET SHARE ANALYSIS BY TYPE (2024)
FIGURE 171 BRAZIL MARKET SHARE ANALYSIS BY END USER (2024)
FIGURE 172 ARGENTINA MARKET SHARE ANALYSIS BY TYPE (2024)
FIGURE 173 ARGENTINA MARKET SHARE ANALYSIS BY END USER (2024)
FIGURE 174 COLUMBIA MARKET SHARE ANALYSIS BY TYPE (2024)
FIGURE 175 COLUMBIA MARKET SHARE ANALYSIS BY END USER (2024)
FIGURE 176 GLOBAL ZERO-WASTE PACKAGING SOLUTIONS CURRENT AND FUTURE MARKET KEY COUNTRY LEVEL ANALYSIS, 2024–2034, (USD MILLION)
FIGURE 177 FINANCIAL OVERVIEW:
Key Players Analysis:
Ecovative LLC: Ecovative LLC specializes in sustainable packaging solutions using mycelium technology to create biodegradable materials. Their product offerings include packaging products made from agricultural waste and fungi, focusing on reducing plastic waste and promoting eco-friendly practices. Their strategy revolves around innovation in biomaterials and partnerships with various industries to enhance sustainability.
DS Smith plc: DS Smith plc is a leading provider of sustainable packaging solutions, offering a wide range of products, including corrugated packaging, plastics, and recycling services. The company emphasizes sustainability and circular economy principles, with a strategy focused on innovation, reducing carbon footprints, and enhancing the recyclability of its products to meet growing environmental demands.
Avani Eco: Avani Eco is known for its commitment to sustainable packaging, offering a variety of biodegradable and compostable products, including bags, food containers, and tableware. Their strategy focuses on educating consumers about the importance of eco-friendly practices and expanding their product lines to include more sustainable options for various industries.
Biome Bioplastics Limited: Biome Bioplastics Limited develops biodegradable and compostable bioplastics for various applications, including food packaging and consumer goods. Their strategy emphasizes innovation in material science and collaboration with companies to replace traditional plastics with sustainable alternatives, addressing both environmental concerns and market demand.
BIOPLA: BIOPLA produces biodegradable packaging solutions from natural materials, including films and bags. Their strategy focuses on global expansion and increasing consumer awareness about sustainable packaging.
Loliware Inc.: Loliware Inc. creates edible and biodegradable packaging, such as seaweed-based cups and straws. Their strategy emphasizes product innovation and promoting sustainable alternatives to single-use plastics.
Evoware: Evoware offers edible packaging made from seaweed, including food wraps. Their strategy focuses on sustainability and targeting consumers concerned about plastic waste
Sulapac Oy: Sulapac Oy develops biodegradable materials for packaging, focusing on cosmetics and food products. Their strategy is to collaborate with brands to create sustainable packaging solutions without compromising quality.
Market Key Players
Ecovative LLC
DS Smith plc
Avani Eco
Biome Bioplastics Limited
BIOPLA
Loliware Inc.
Evoware
Sulapac Oy
TIPA
World Centric
Notpla Limited
Regeno
Hero Packaging
Driver:
Increasing Environmental Awareness
Growing environmental consciousness among consumers and businesses is a significant driver of the zero-waste packaging solutions market. As awareness of issues like plastic pollution and climate change rises, more consumers are seeking sustainable alternatives that minimize waste. Companies are responding by adopting eco-friendly packaging solutions to meet consumer demand and enhance brand loyalty. This shift towards sustainability not only addresses environmental concerns but also aligns with corporate social responsibility goals, driving further adoption of zero-waste practices.
Stringent Government Regulations
Government regulations aimed at reducing waste and promoting sustainability are crucial drivers for the zero-waste packaging solutions market. Many countries are implementing bans on single-use plastics and introducing policies that encourage the use of recyclable and compostable materials. These regulations create a pressing need for businesses to adopt zero-waste packaging solutions to comply with legal requirements. As regulations become more stringent, companies are increasingly investing in sustainable packaging options to avoid penalties and improve their market positioning.
Technological Innovations
Technological advancements in materials and packaging design are significantly driving the zero-waste packaging solutions market. Innovations such as biodegradable plastics, plant-based materials, and smart packaging are enabling companies to create more sustainable options. These advancements enhance the functionality and appeal of zero-waste packaging, making it a viable alternative to traditional packaging solutions. As research and development in sustainable materials continue to progress, businesses can offer innovative packaging that meets consumer demands while reducing their environmental impact.
Restrain:
High Production Costs
One of the primary restraints affecting the zero-waste packaging solutions market is the higher production costs associated with sustainable materials. Biodegradable and compostable materials often require advanced manufacturing processes and technologies, resulting in increased production expenses compared to conventional packaging options. These elevated costs can deter businesses, particularly small and medium-sized enterprises, from transitioning to zero-waste packaging solutions. Consequently, the price-sensitive nature of many consumers and businesses may limit the widespread adoption of these sustainable alternatives.
Limited Infrastructure for Recycling and Composting
The effectiveness of zero-waste packaging solutions heavily relies on the availability of proper recycling and composting infrastructure. In many regions, inadequate waste management systems and limited access to recycling facilities pose significant challenges. Consumers may find it difficult to dispose of zero-waste packaging correctly, leading to contamination and reduced recycling rates. This lack of infrastructure can hinder the growth of the zero-waste packaging market, as businesses may be hesitant to invest in solutions that depend on efficient waste processing systems that are not yet in place.
Opportunities:
Growing Demand for Sustainable Products
The increasing consumer preference for sustainable and eco-friendly products presents a significant opportunity for the zero-waste packaging solutions market. As awareness of environmental issues continues to rise, consumers are actively seeking brands that prioritize sustainability in their packaging. Companies can capitalize on this trend by developing innovative zero-waste packaging solutions that appeal to eco-conscious consumers. This growing demand not only enhances brand loyalty but also opens new market segments, allowing businesses to differentiate themselves in a competitive landscape.
Expansion into Emerging Markets
Emerging markets present a lucrative opportunity for the zero-waste packaging solutions market as they undergo rapid urbanization and increasing environmental awareness. Countries in Latin America, Asia-Pacific, and Africa are witnessing a shift toward sustainable practices, driven by rising disposable incomes and changing consumer behavior. As these regions invest in waste management and sustainability initiatives, there is significant potential for companies to introduce zero-waste packaging solutions. Expanding into these markets allows businesses to tap into new customer bases and contribute to global sustainability efforts.
Trends:
Rise of Circular Economy Practices
The shift towards a circular economy is a prominent trend influencing the zero-waste packaging solutions market. Companies are increasingly adopting practices that emphasize resource efficiency and waste reduction, focusing on designing packaging that can be reused, recycled, or composted. This trend promotes the development of closed-loop systems where materials are continuously repurposed, minimizing waste. As businesses align their strategies with circular economy principles, they enhance sustainability and create innovative packaging solutions that meet consumer demand for environmentally responsible products.
Recent Development
In May 2022, G. Mondini trialed TIPA's biodegradable films as liners for its paper-based packaging options for chilled, wet, fresh food, and frozen products. The organization claimed that the partnership might enable G. Mondini to offer Paperseal packaging solutions made of paper designed for use in food applications and compostable items.
In October 2021, Tetra Pak announced its strategic partnership with Poka, which reflects its commitment to zero waste. The partnership may empower food production workers with technology, equipment, and training that can expedite zero-waste procedures.